
Abstract
Supercritical convective heat transfer characteristics of hydrocarbon fuel play a fundamental role in the active cooling technology of scramjet. In this paper, a 2D-axisymmetric numerical study of supercritical heat transfer of RP3 flowing inside the cooling channels of scramjet has been conducted. The main thermophysical properties of RP3, including density, specific heat, and thermal conductivity, are obtained from experimental data, while viscosity is evaluated from a commercial code with a ten-species surrogate. Effects of heat flux, mass flow rate, and inlet temperature on supercritical heat transfer processes have been investigated. Results indicate that when the wall temperature rises above the pseudocritical temperature of RP3, heat transfer coefficient decreases as a result of drastic decrease of the specific heat. The conventional heat transfer correlations, that is, Gnielinski formula, are no longer proper for the supercritical heat transfer of RP3. The modified Jackson and Hall formula, which was proposed for supercritical CO2 and water, gives good prediction except when the wall temperature is near or higher than the pseudocritical temperature.
1. Introduction
Hypersonic vehicle (such as scramjet) is usually defined as a vehicle traveling at a velocity above Mach 6, and it has drawn an ever increasing attention of many countries for its great value in military and commercial fields [1, 2]. However, the large heat release from combustion in combustor as well as the high enthalpy of the inflow makes thermal protection a main challenge. Active cooling with hydrocarbon fuel such as kerosene is proved to be an effective way [3–5]. For the sake of injection, the pressure inside the cooling channels is usually higher than the critical pressure of kerosene; thus the kerosene would become supercritical when absorbing heat. Supercritical fluids present many different property characteristics from liquid and gas. This would have a great influence on the heat transfer characteristics.
Many experimental and numerical studies are made on the supercritical heat transfer of hydrocarbon fuels. The experimental results of Zhong et al. [6] showed that when the inner wall temperature approaches the critical temperature, heat transfer enhancement happens. Linne et al. [7] conducted experiments on heat transfer and thermal stability of JP-7. They thought that this enhancement is like nucleate boiling under subcritical pressure. Experiments by Hu et al. [8] confirmed this and found that there is another enhancement which happens when the inner wall temperature and heat flux are extremely high and attributed this enhancement to cracking reactions of kerosene. As for numerical studies, Li et al. [9] investigated heat transfer of RP3 kerosene under supercritical pressures and found that enhancement does not always happen when the inner wall temperature is higher than the critical temperature of kerosene. Effects of centrifugal force on heat transfer were also studied [10]. The numerical research of Hua et al. [11] for n-heptane indicates that heat transfer deterioration happens when inner wall temperature is higher than the pseudocritical temperature.
The researches mentioned above have largely deepened the understanding of supercritical heat transfer characteristics of hydrocarbon fuels. However, the work conditions, such as the heat flux, the mass flow rate, and the size of the cooling channels, are different from those in a practical scramjet [12]. Table 1 has summarized the work conditions in the previous studies.
Summary of work conditions in previous studies.

The heat flux in a practical hypersonic vehicle is hard to know by experiments but can be predicted by theory and simulation. Simulation by Zheng and Sun [13] indicated that heat flux varies from 0.3 MW/m2 to 0.7 MW/m2 in a true scramjet traveling at Mach 6. However, the heat fluxes in most of the literature above are too large. The reason is that they focus on the regenerate cooling of rockets or aeroengines, which faces much higher heat fluxes.
In this paper, the working conditions simulated are as follows. Heat flux varies from 0.3 MW/m2 to 0.67 MW/m2 and mass flow rate ranges from 3 g/s to 6 g/s. The inner diameter of the cooling channel is 3 mm. The pressure inside the channel is 3 MPa. These working conditions are in accordance with the practical scramjet engine.
2. Simulation Method
2.1. Numerical Model
In this paper, 2D-axisymmetric simulations are performed. And the two-dimensional Reynolds averaged Navier-Stokes (RANS) equations are solved with the pressure based solver of FLUENT 6.3 [14]. The RNG κ-ε turbulent model is selected to simulate the turbulent heated flow inside the tube. The SIMPLE algorithm is employed to resolve the coupling between velocity and pressure. Further, before simulation, the distance of the wall-adjacent cell to the wall is checked to fit the requirement of y + ⩽1 for all of the flow fields.
Figure 1 shows the computational configuration. The heating section is 600 mm. Two unheated sections with length of 300 mm are placed before and after it in order to avoid the inlet and outlet effects. The size of the inner diameter and length of the heating section are very close to those of the practical scramjet engines.
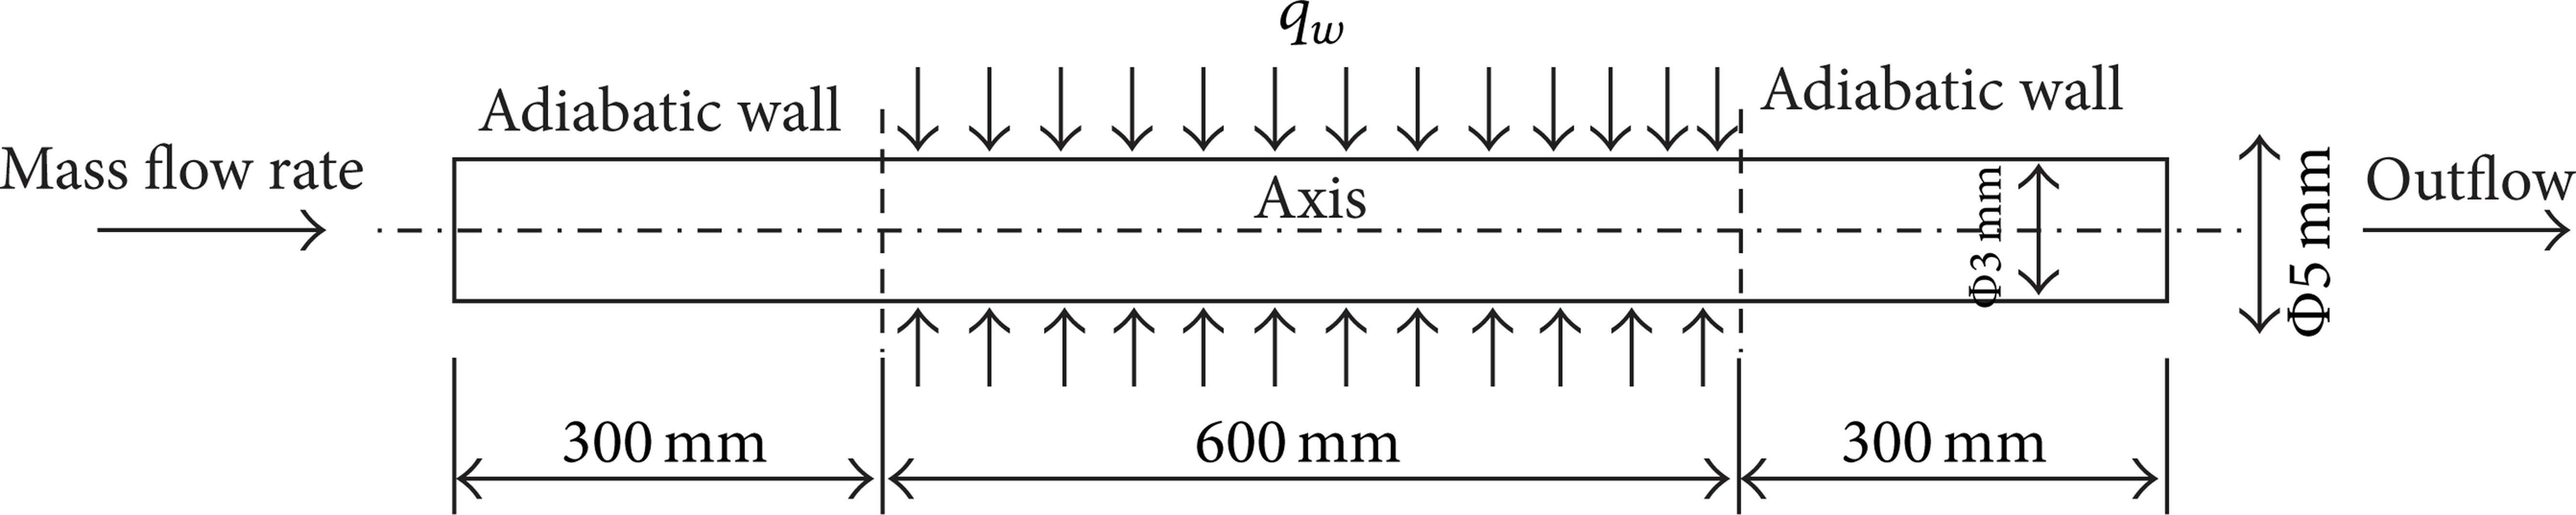
Computational configuration of the simulation.
2.2. Boundary Conditions
The boundary conditions are as follows. The inlet pressure is 3 MPa and the inlet temperature ranges from 300 K to 450 K. The inlet mass flow rate varies from 3 g/s to 6 g/s and the corresponding inlet velocity varies from approximately 0.5 m/s to 1 m/s.
The heated section is enforced at a constant heat flux. Four different heat fluxes are investigated in this paper, namely, 0.3 MW/m2, 0.4 MW/m2, 0.5 MW/m2, and 0.67 MW/m2. Other walls, including the beginning and ending unheated walls, are treated as adiabatic walls.
An outflow condition is employed to the outlet.
2.3. Thermophysical Properties of the RP3
The evaluation of the thermophysical properties of RP3 plays a key role in the simulation. Supercritical fluids usually present unique thermophysical property, which is neither like that of gas nor that of liquid. The properties experience tremendous variations under supercritical pressures, especially near the pseudocritical temperature. The “pseudocritical” temperature is defined as the temperature at which the specific heat reaches maximum. It is related to pressure. Under a certain supercritical pressure, there is a corresponding “pseudocritical” temperature.
The evaluation of the properties of kerosene is difficult, as it is a mixture which is composed of thousands of species. In this paper, a ten-species surrogate [6] is used to evaluate the viscosity of RP3 at 3 Mpa with NIST Supertrapp software [17]. Other properties, including specific heat, density, and thermal conductivity, are obtained from existing experimental data [18–20]. Figure 2 shows the thermophysical property variations of RP3 at 3 Mpa.

Thermophysical property variations of RP3 at 3 MPa.
The critical pressure and temperature of RP3 are considered to be 2.3 MPa and 646 K, respectively [21]. The “pseudocritical” temperature of RP3 at 3 MPa is approximately 672 K [18].
2.4. Validation of the Simulation Method
In order to validate the present numerical method in computing heat transfer of supercritical fluids, a problem of convection heat transfer of supercritical CO2 was considered following He et al. [22]. The critical pressure and temperature of CO2 are 7.38 MPa and 31.05°C, respectively [23]. Two test conditions were simulated. The mass flow rate, inlet temperature, and heat flux for the two cases are 1.48 kg/h, 32.7°C, and 31534 W/m2 and 1.37 kg/h, 51°C, and 29400 W/m2, respectively. The pressure in both cases is 9.5 MPa. Thus both are supercritical cases. Figure 3 shows the comparison of the simulated wall temperature with the experimental data. The relative error between the two sets of results is generally less than 10%, verifying the reliability of the present numerical method.
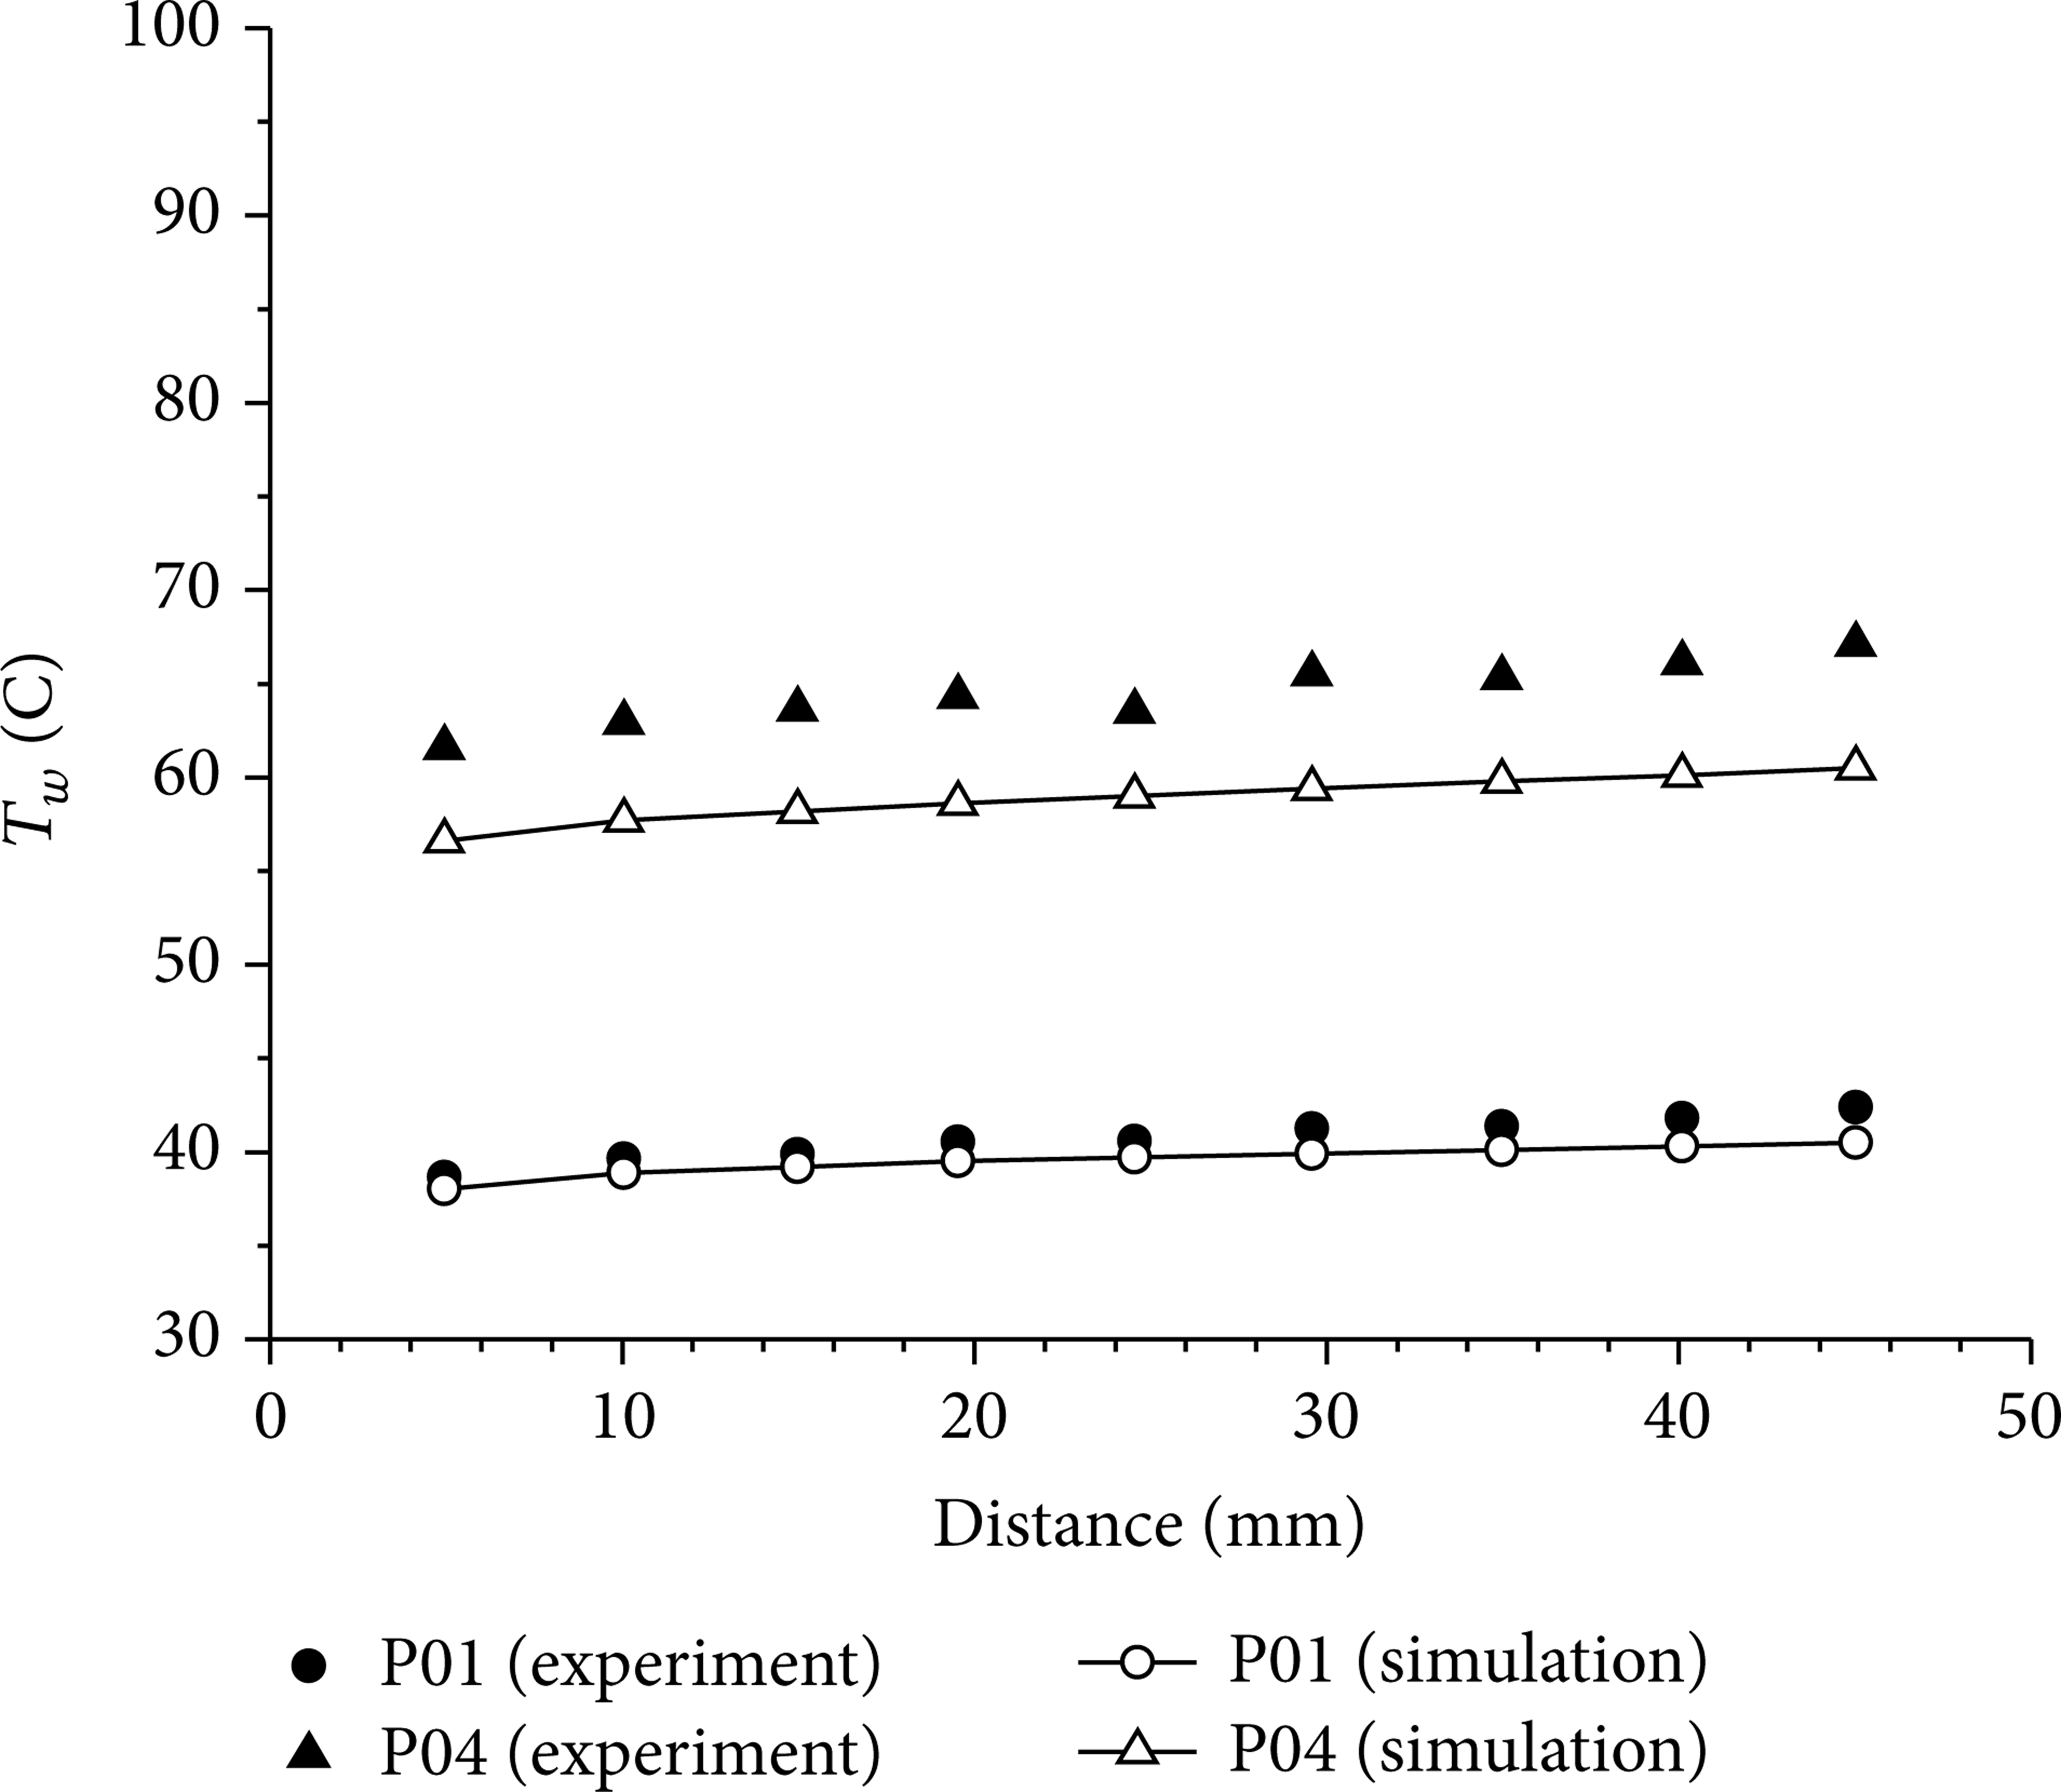
Comparison between the experimental and numerical data for supercritical CO2 inside a miniature tube.
3. Results and Discussion
Before numerical calculations, a mesh-sensitivity analysis has been conducted to ensure the accuracy of the present numerical investigations. A grid system with 50 and 12000 meshes in the radial and axial directions has been found to be sufficient. The meshes in the radial direction are clustered into the tube wall. Increasing the meshes from 50 to 75 in the radial direction and 12000 to 18000 in the axial direction, respectively, renders less than 4% deviation in the wall temperature.
3.1. Effects of Heat Flux
In this part, the effects of heat flux on supercritical heat transfer of RP3 flowing inside a cooling channel are investigated. The mass flow rate is 6 g/s, inlet temperature is at 300 K, and inlet pressure is at 3 MPa. The heat flux varies from 0.3 MW/m2 to 0.67 MW/m2, which is in accordance with the practical heat flux in scramjets.
Figure 4 illustrates the variations of wall temperature and fluid temperature along the flow direction in the heated channel section. The fluid temperature in this paper refers to the temperature at the center of the channel. In Figure 4(a), the wall temperature shows a sharp increase at the initial section (before x/d = 13) under all heat fluxes and then grows gradually when heat flux is relatively low (0.3 MW/m2 and 0.4 MW/m2). However, the wall temperature decreases first and then increases under higher heat fluxes (0.5 MW/m2 and 0.67 MW/m2). In Figure 4(b), the fluid temperature increases slightly at the initial section and then begins to grow rapidly. This is mainly caused by thermal boundary. In the initial heating section, thermal boundary is in the developing stage, and the thickness of the thermal boundary layer increases along the flow direction, which results in an increase of thermal resistance. Hence, heat is hard to transfer into the fluid. As a consequence, the fluid temperature changes slightly while the wall temperature shows a sharp increase.

Variations of (a) wall temperature and (b) fluid temperature at different heat fluxes.
Figure 5(a) shows the variations of Nusselt number at different positions. It can be seen that the Nusselt number decreases first and then increases along the tube under all heat fluxes. As analyzed before, this is mainly caused by thermal boundary. Figure 5(a) also indicates that the minimum values of Nusselt number under various heat fluxes occur at the same tube position, which is x/d ≈ 13. Before x/d = 13, Nusselt number decreases along the tube, and there are no obvious differences in the values of Nusselt number under different fluxes. When x/d > 13, Nusselt number increases along the tube, and it increases with heat flux at the same tube position. This indicates that, at the initial heating section, heat transfer is mainly dominated by thermal boundary and heat flux has little effects on it. After this section, Nusselt number increases with the increase of heat flux.
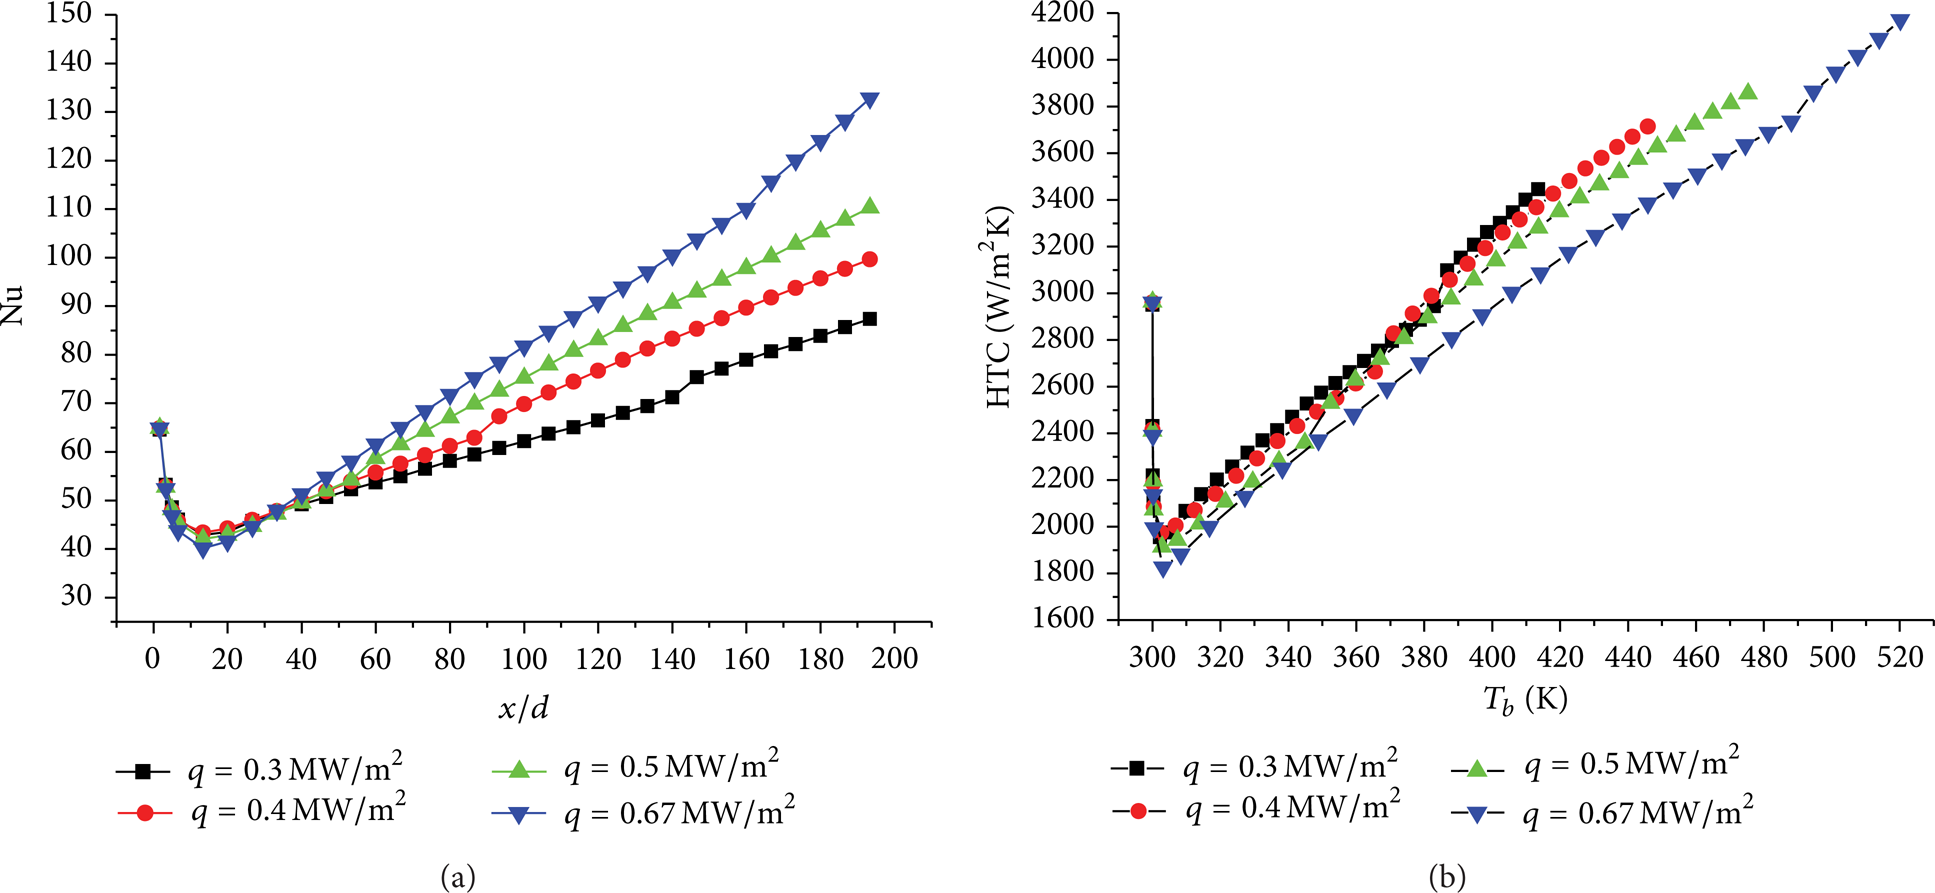
Variations of (a) Nusselt number at different positions and (b) heat transfer coefficient at different fluid temperatures.
Figure 5(b) presents the variations of heat transfer coefficient at different fluid temperatures. The decrease of heat transfer coefficient at initial section is also observed. Such a phenomenon also appears in Hall and Jackson's research [24]. It can also be seen that heat transfer coefficient decreases with the increase of heat flux at the same fluid temperature.
From the variation of Nusselt number at different positions in Figure 5(a), the trend of wall temperatures at different heat fluxes in Figure 4(a) can be explained. When heat flux is relatively low (less than 0.5 MW/m2), wall temperature shows a sharp increase and then increases gradually. However, when heat flux is higher than 0.5 MW/m2, wall temperature sharply increases first and then decreases and finally increases gradually. Such a phenomenon is caused by the comprehensive effects of heat transfer coefficient and fluid temperature. According to the principle of Newton's cooling, the wall temperature can be expressed by
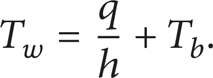
At the initial heating section, heat transfer coefficient decreases along the tube, making the first term on the right hand side of formula (1) increase. Meanwhile, the fluid temperature is almost constant. So the wall temperature increases. After the initial heating section, heat transfer coefficient quickly recovers and increases along the tube (see Figure 5(a)), causing the first term on the right hand side of formula (1) to decrease. However, the fluid temperature increases. So, the wall temperature can increase or decrease, depending on the comprehensive effects of these two terms. From Figure 5(a), the increase of Nusselt number is much rapider along the tube under higher heat fluxes. At a high heat flux, when the decrease of the value of q/h exceeds the increase of the fluid temperature, the wall temperature will decrease.
Nusselt number calculated from the present study was compared with two existing heat transfer correlations. One is the conventional Gnielinski formula [25], which is considered to have a relatively higher accuracy among the conventional heat transfer correlations. The other is the Jackson and Hall formula [26, 27], which was proposed for supercritical CO2 and water. Since supercritical fluids present similar characteristics, the Jackson and Hall formula is slightly modified in this study to be applied for supercritical heat transfer of RP3.
The Gnielinski formula can be expressed in the following form:

in which the friction factor f is calculated as

The Gnielinski formula is applied in heat transfer prediction in the following Prandtl and Reynolds number range:

The Jackson and Hall formula [26, 27] was slightly modified and can be expressed as follows:
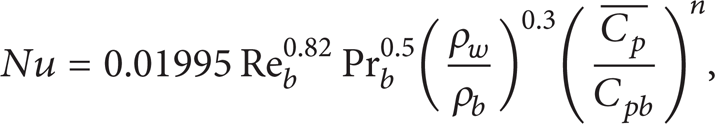
where the parameters,

Figure 6 shows the comparison of calculated Nusselt number in this study with Gnielinski formula and modified Jackson and Hall formula at different heat fluxes. It can be seen that Gnielinski formula works poorly for prediction of supercritical heat transfer of RP3. This is probably because it is applied in heat transfer with mild property variations. As for supercritical heat transfer with strong property variations, prediction from Gnielinski formula may cause large deviation. However, the modified Jackson and Hall formula gives a more accurate prediction under all heat fluxes, except at the latter section under 0.67 MW/m2, as shown in Figure 6(b). That is just the region where the wall temperature approaches the pseudocritical temperature and property begins to change sharply. This indicates that the modified Jackson and Hall formula works poorly in the near pseudocritical temperature region.

Comparison of the calculated Nusselt number with (a) Gnielinski formula and (b) modified Jackson and Hall formula at different heat fluxes.
3.2. Effects of Mass Flow Rate
In this part, the effects of mass flow rate on supercritical heat transfer of RP3 flowing inside a cooling channel are investigated. The inlet temperature is 300 K, the inlet pressure is at 3 Mpa, and the heat flux is at 0.5 MW/m2. The mass flow rate ranges from 3 g/s to 6 g/s.
Figure 7 presents the variations of wall temperature and fluid temperature along the tube at different mass flow rates. The fluid temperature under all mass flow rates increases along the tube. However, the wall temperature variations are more complicated. At larger mass flow rate (5 g/s and 6 g/s), the wall temperature is below the pseudocritical temperature of RP3 and it increases sharply in the initial section and then increases gradually. At mass flow rate 3 g/s, the wall temperature decreases along the tube after the initial section. At mass flow rate 4 g/s, the wall temperature first decreases after the initial section and then increases after x/d ≈ 107.

Variations of (a) wall temperature and (b) fluid temperature at different mass flow rates.
As analyzed before, wall temperature is influenced by fluid temperature and heat transfer coefficient. Figure 8 shows the heat transfer coefficient variations along the tube. The HTC (heat transfer coefficient) increases nearly linearly after initial section for mass flow rates 3 g/s, 5 g/s, and 6 g/s. However, it decreases at x/d ≈ 107 for mass flow rate 4 g/s.

Heat transfer coefficient variations at different mass flow rates.
The hump-shape trend for HTC at mass flow rate 4 g/s is mainly caused by sharp variations of properties such as Cp near the wall. The “pseudocritical” temperature of RP3 at 3 MPa is approximately 672 K [18]. As can be seen in Figure 7(a), the wall temperature at mass flow rate of 4 g/s approaches 672 K when x/d is 70. It can be expected that heat transfer coefficient would increase since Cp of fluid near the wall increases sharply, and this is proved in Figure 8. Then the wall temperature rises very slowly (the wall temperature nearly keeps constant from x/d = 70 to x/d = 107) since heat transfer is enhanced because of the sharp increase of Cp near the wall. Once the temperature of fluid near the wall rises above the “pseudocritical” temperature, Cp decreases sharply; see Figure 2(a); thus heat transfer coefficient decreases. That is why HTC decreases at x/d = 107. At mass flow rates of 5 g/s and 6 g/s, the wall temperatures are below the “pseudocritical” temperature of RP3 and Cp changes nearly linearly; thus HTC curve does not present a hump-shape trend. At mass flow rate of 3 g/s, although the wall temperature is higher than the “pseudocritical” temperature, the location where the fluid temperature approaches the “pseudocritical” temperature and Cp increases sharply is far from the inner wall; thus its effects on heat transfer are limited. So the hump-shape trend of HTC is mainly caused by thermal property (especially Cp) variations of fluid near the wall. When the wall temperature approaches the “pseudocritical” temperature, heat transfer is slightly enhanced. Once the wall temperature rises above the “pseudocritical” temperature, HTC decreases. This trend is in accordance with that of Cp near the “pseudocritical” temperature; see Figure 2(a). A similar conclusion can be found in researches by Hua et al. [11, 15, 16].
Figure 9 shows the comparison of calculated Nusselt number in this study with Gnielinski formula and modified Jackson and Hall formula at different mass flow rates. The error between the calculated Nusselt number and Gnielinski formula is large. Additionally, even the qualitative trend is not consistent under 4 g/s. The numerical result shows that Nusselt number decreases at x/d = 110 while the Gnielinski formula predicts that it increases all the way. Under 5 g/s and 6 g/s, the modified Jackson and Hall formula gives a good prediction. However, under 3 g/s and 4 g/s, when the wall temperature is near or higher than the pseudocritical temperature, the modified Jackson and Hall formula works poorly too.

Comparison of calculated Nusselt number with (a) Gnielinski formula and (b) modified Jackson and Hall formula at different mass flow rates.
In Figure 9, near the exit of minitube, the Nusselt number at the lowest mass flow rate of 3 g/s exceeds that of three other cases. Generally speaking, Nusselt number or HTC increases with mass flow rate. However, the horizontal ordinate in Figure 9 is x/d, a spatial variable. Since the heat flux for all mass flow rates is uniform, the fluid temperature near the exit of minitube at mass flow rate 3 g/s would be higher than that at other mass flow rates. Higher fluid temperature results in higher HTC (generally speaking, HTC increases with fluid temperature, as can be seen in Figure 5(b)) and lower thermal conductivity (thermal conductivity decreases with fluid temperature before 700 K; see Figure 2(c)). So Nusselt number near the exit of minitube at mass flow rate 3 g/s would increase rapidly and then exceeds that of three other cases. Table 2 has summarized the variations of many parameters from x/d = 120 to the exit of minitube at different mass flow rates. As can be seen obviously, Nusselt number at mass flow rate 3 g/s has increased by nearly 93% attributed to the higher fluid temperature (500∼600 K) while Nusselt number at mass flow rate 6 g/s has increased by only 25%.
Parameter variations from x/d = 120 to the exit of minitube.

3.3. Effects of Inlet Temperature
In this part, the effects of inlet temperature on supercritical heat transfer characteristics of RP3 are investigated. The mass flow rate is 6 g/s, the inlet pressure is at 3 Mpa, and the heat flux is at 0.5 MW/m2. The inlet temperature ranges from 300 K to 550 K.
Figure 10 shows the wall and fluid temperature variations along the tube at different inlet temperatures. Both types of temperature increase along the tube, except that the wall temperature at inlet temperature 300 K decreases first after initial heating section and then gradually increases. As discussed before, this is caused by thermal boundary. As can be seen in Figure 11, the thermal boundary develops before x = 0.36 m and the thickness of it increases. As a consequence, the wall temperature increases sharply before x/d = 10. After the initial section, the thickness of the thermal boundary hardly changes, and the wall temperature decreases slightly since heat transfer coefficient increases. Additionally, the wall temperature increment in initial heating section decreases with increase of the inlet temperature. At inlet temperature 300 K, the wall temperature increment in initial heating section is approximately 95 K. However, it is reduced to only 25 K at inlet temperature 450 K. This indicates that the effects of thermal boundary on heat transfer decrease with increase of the inlet temperature. Generally speaking, the higher the inlet temperature is, the higher the wall temperature is. However, since the thermal boundary effects are much stronger at 300 K than those at other temperatures, the wall temperature in the initial heating section at 300 K is even higher than that at 350 K and 400 K.

Variations of (a) wall temperature and (b) fluid temperature at different inlet temperatures.

Temperature distribution at inlet temperature 300 K.
Figure 12 illustrates the heat transfer coefficient variations along the tube at different inlet temperatures. The heat transfer coefficient presents the same trend under all inlet temperatures. It decreases in the initial heating section and then increases along the tube. At the same position, the higher the inlet temperature is, the higher the heat transfer coefficient is.

Heat transfer coefficient variations at different inlet temperatures.
Figure 13 shows the heat transfer coefficient variations with fluid temperature at different inlet temperatures. Generally speaking, the heat transfer coefficient increases with increase of the fluid temperature. The higher the fluid temperature is, the higher the heat transfer coefficient is. Moreover, the curves for different inlet temperatures overlap with each other at some temperature regions. For example, from 400 K to 450 K, the curves for inlet temperatures 350 K and 400 K overlap totally. This indicates that when other parameters (such as heat flux, mass flow rate, and pressure) are fixed, the heat transfer coefficient is determined by fluid temperature, but not by the way how the kerosene is heated to this temperature.

Variations of heat transfer coefficient with fluid temperature at different inlet temperatures.
Figure 14 shows the comparison of calculated Nusselt number in this study with Gnielinski formula and modified Jackson and Hall formula at different inlet temperatures. As discussed before, the errors between the Gnielinski formula and calculated results are large while the modified Jackson and Hall formula gives a good prediction. However, at inlet temperature 450 K, when the wall temperature is near or higher than the pseudocritical temperature, the modified Jackson and Hall formula works poorly too.

Comparison of the calculated Nusselt number with (a) Gnielinski formula and (b) modified Jackson and Hall formula at different inlet temperatures.
4. Conclusions
In this paper, numerical study of the forced convective heat transfer of a typical hydrocarbon fuel RP3 flowing inside cooling channels of scramjet under supercritical pressure (3 MPa) has been conducted. The working conditions and geometry of the cooling channels are in accordance with those in the practical scramjet engine. The effects of many key parameters, including the wall heat flux, mass flow rate, and inlet temperature, on the supercritical heat transfer characteristics of RP3 were investigated. The Nusselt number obtained from numerical calculations was compared with that from the conventional heat transfer correlation, that is, the Gnielinski formula, as well as with that for supercritical CO2 and water, that is, the modified Jackson and Hall formula. The following conclusions could be reached.
When the wall temperature rises above the pseudocritical temperature of RP3 under a supercritical pressure, heat transfer coefficient decreases because of the sharp variations of thermal properties of the fluid near the inner wall.
The conventional heat transfer correlations, that is, the Gnielinski formula, are not proper for supercritical heat transfer of RP3, since they can only deal with mild property variations.
The modified Jackson and Hall formula, which was proposed for supercritical CO2 and water, gives good prediction of supercritical heat transfer of RP3, except when the wall temperature is near or higher than the pseudocritical temperature.
Conflict of Interests
The authors declare that there is no conflict of interests regarding the publication of this paper.
Footnotes
Acknowledgments
This work was supported partially by the National Natural Science Fund of China (Grant nos. 11372348 and 91216118). The authors also greatly acknowledge and thank the College of Aerospace Science and Technology at National University of Defense Technology for support of their work.