
Abstract
Based on the CT scanned images, a realistic geometric model from nasal cavity to upper six-generation bronchia is rebuilt. In order to effectively simulate the particle movement and deposition, LES model is used and the particles are tracked in the frame of Lagrange. Seven kinds of typical particles, including micron particles (1, 5, and 10 μm) and nanoparticles (1, 5, 20, and 100 nm), and three representative respiratory intensities are adopted as computational case, respectively. Deposition efficiency (D E ), deposition concentration (D C ), and capture efficiency (C E ) are introduced. Furthermore, the locations of particle deposition are visualized. The results indicate that the injecting particles from different nasal inlet present “transposition effect.”The D E values of micron particles are much higher than nanoparticles. The particle diameter plays a weaker role in nanoparticle depositions than micron particles. The highest values of D E and D C both occur in nasal cavity, while the highest C E up to 99.5% occurs in bronchus region.
1. Introduction
Airborne particles in air, which may cause illness of the human respiratory tract such as bronchitis and emphysema, aggravate cardiovascular diseases and asthma attacks, and decrease lung function after being inhaled into body, have become a main factor for air pollution. On the other hand, more and more nebulizers are adopted to cure respiratory diseases such as asthma. Thus, good knowledge of airflow structure, movement, dispersion, and deposition of aerosols in the upper respiratory tract is very important, which can provide credible theoretical foundation not only for effectively preventing illness, but also for delivering pharmaceutical aerosols accurately to the targeted part while effectively enhancing therapeutic effect [1, 2].
There are a number of in vivo and in vitro experimental studies conducted to investigate the deposition of fine and ultrafine aerosols in respiratory airways. In vivo depositions of fine and ultrafine aerosols in human subjects have been carried through in many studies without interacting particles [3–6]. However, regional deposition can be predicted for the empirical limitations within broad sections such as tracheobronchial, pulmonary, and extrathoracic regions. So, in vitro studies have been conducted which have considered fine and ultrafine aerosols deposition in human casts and replica models [3, 7–9]. From the abovementioned experiments, it can be found that although in the human respiratory tract particle depositions can be acquired by experimental method, the accuracy is limited to a certain extent because the experiment cannot be easily conducted in vivo. Even when real human experiments can be conducted, movement mode, movement track, and deposition of particle inside respiratory tract intuitively can be difficult to obtain. Concerning mastering airflow state, the effects of flow field and temperature field on particle movement and deposition are more difficult.
Hitherto, many researchers have investigated computation fluid dynamics modeling of airflow and particle movement in the respiratory tract all over the world. Most models employ low-Reynolds k-ω model and standard k-∊ model to describe gas flow and track particle movement in the frame of Lagrange [10–12]. Just recently, the LES method is applied to the study of airflow in the human respiratory tract.
The most actual computations are often based on the idealized geometrical model and rarely on the realistic human body. A geometric model including mouth, pharynx, larynx, and trachea was built by Zhang et al. [10, 11] and LRN k-ω model was chosen to describe airflow field. They numerically computed movement and deposition of particles from trachea to upper three-generation bronchia model adopting symmetry model A provided by Weibel [13]. Based on the abovementioned model, Matida et al. [12] selected standard k-ω model to depict airflow field and employed close-wall modification function to improve computation accuracy of the velocity close to wall. This made the computation result more accurate for high airflow rate, but there were still some deviations in experimental data.
From the previous geometric model, there were two types of trachea-bronchia model: symmetry model and asymmetry model. Although the asymmetric model already accorded with real human respiratory tract even more, there was still more difficulty to numerical simulation. Thus, symmetry model was used more generally; the most typical model in them was Weibel A. Zhang et al. [10, 11, 14] had done a series of numerical simulations based on this model. The trachea and upper three-generation bronchia in Weibel A and oral cavity, pharynx, and larynx model were combined and used in Cheng's experiment. Zhang and Kleinstreuer [15] built a three-dimension geometric model from oral cavity to upper three-generation bronchia and investigated heat and mass transfer in this airway model. Zhang et al. [16] studied a (Weibel type A) 16-generation model. A representative human tracheobronchial tree had been geometrically represented with adjustable triple-bifurcation units (TBUs) in order to effectively simulate local and global micron particle depositions.
Recently, CFD simulations based on magnetic resonance imaging (MRI) and CT scanned images were conducted [17–19]; however, the bronchial structure was very limited. Ma and Lutchen [20] reconstructed a model extended from mouth to ten-generation and included two-thirds of the airways obtained by multidetector row computed tomography (MDCT) imaging on normal healthy human subjects. Steady oral inhalation (15, 30, and 60 L/min) and aerosol (1–30 micrometer) deposition were computed by CFD using the realizable k-epsilon turbulence model. A computational framework for multiscale simulation of gas flow in subject-specific airway models of the human lung was described. This work demonstrated the importance of multiscale simulation of pulmonary gas flow for accurate prediction of flow characteristics at large and small airways and their interactions.
Summarizing the abovementioned numerical simulation study, it can be concluded that the present study of geometric model focuses on human respiratory tract including oral cavity, pharynx, larynx, and upper three-generation bronchia. The study progress of nasal cavity is slow because nasal cavity has intricate structure. Previous numerical simulations of fluid flow in the upper airway have most used the RANS to solve the time averaged velocity field. This needs a model for the Reynolds stresses, most commonly the 2-equation k-∊ model as used. It is confirmed that the k-∊ model provides inaccurate results for turbulent flow when it is compared with experimental models. Considering that the flow in this area will undergo a transition from a laminar to turbulent regime due to the structure of laryngeal jet it is expected that the use of the standard k-∊ model would not be proper.
Direct numerical simulation (DNS) is a high fidelity approach that solves the complete range of spatial and temporal scales of flow scales. But the computational cost of DNS is very expensive and time consuming, even at low Reynolds numbers. Large eddy simulation (LES) methodology arises and becomes a compromise between the RANS and DNS formulations, which divides characteristically the flow field into small and large scales by a filtering procedure. It calculates directly the transient behavior of the large scale motion of the flow which tends to have the most important effect on the turbulent transport. Meanwhile the smallest eddies are calculated by LES using a subgrid scale model. Steady RANS (with both k-∊ and k-w models) and unsteady LES predictions of the upper airway flow characteristics are compared by Mihaescu et al. [21]. It is shown that LES is still the preferred tool to capture relevant airway-related flow features although its computational cost is expensive. And steady RANS cannot reproduce the flow features of the flow separation regions downstream in a constricted area.
In this paper, a three-dimensional geometric model of realistic human upper respiratory tract including nasal cavity, pharynx, larynx, trachea, and the upper six-generation bronchial is rebuilt from the CT scanned images of a healthy 19-year-old boy. LES model is used to describe the airflow and the particle is tracked and analyzed in the frame of Lagrange. The inhalable particles deposition in realistic human upper respiratory tract is researched for different respiratory intensity.
2. Description of Model
2.1. Geometric Model
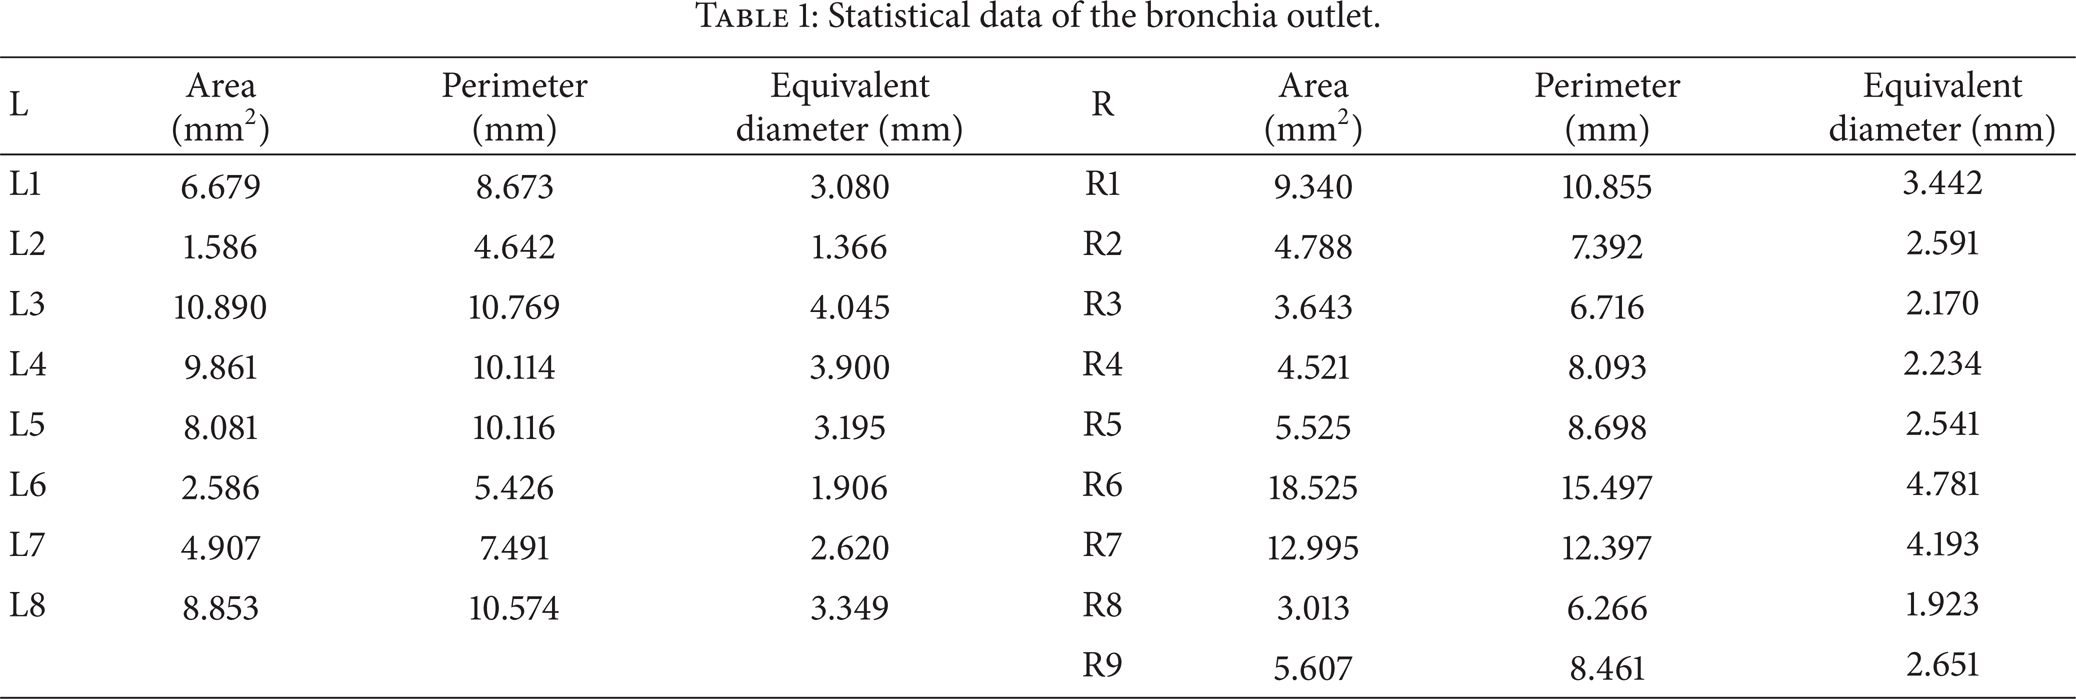
Using image recognition techniques as MIP and VRT, the upper airway including nasal cavity, pharynx, larynx, trachea, and bronchia is converted into an STL model, which indicates that a triangle mesh will be generated around the selected volume. The obtained 3-dimension upper airway is shown in Figure 1. The geometric structure of the upper airway is very complex, especially for the nasal cavity, which is different from most present models used by computational fluid dynamics. This will cause complicated flow fields into the upper airway and complicated particle transport and deposition principles along the airway. The more real flow characteristics can be obtained using the more real geometrical model. The trachea and bronchia are separately illustrated in Figure 2 for more particular knowledge of the structure, from which we can find that the bronchia is asymmetric; specifically the center lines of the bronchia form a spatial solid angle. The size and equivalent diameter of every generation bronchia are shown in Table 1.
Statistical data of the bronchia outlet.

The three-dimensional geometrical model of realistic human upper respiratory tract rebuilt from the CT scanned images including nasal cavity, pharynx, larynx, trachea, and upper six-generation bronchia.

The bronchia distribution.
2.2. Governing Equation
The airflow structure will be very complex because sharp shrink and expand surface exist in the pharynx-larynx and bifurcate structure exists in the bronchia with more complex structure. Thus, the unsteady LES model is adopted in this paper. The continuity and movement equations are as follows:

where i, j = 1, 2, 3, ρ is fluid density, t is time, x denotes the spatial coordinate,
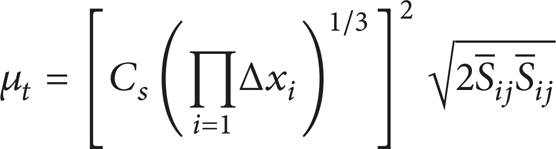

where x is grid size, C s is Smagorinsky constant, the value often ranges from 0.1 to 0.2, and 0.1 is chosen in this paper.
The particle phase in the air can be considered a dilute phase, neglecting the interaction between particles. The Lagrangian dispersed phase model is used for the prediction of the trajectory of particle. This is done by integrating the force balance on the particle. In the Lagrangian reference frame, movement vector of a single particle can be written as

where m p is particle mass, d p is particle diameter, v i represents particle velocity vector, C D stands for particle resistance coefficient, and g is acceleration of gravity. The three terms on the right hand are Stokes resistance, gravity force, and Saffman's lift force considered in this paper.
Particle velocity can be obtained by the integrated (3); furthermore particle position can be tracked by the following equation:

The particle deposit efficiency (D E ), deposition concentration (D C ), and capture efficiency (C E ) are introduced to quantificationally analyze particle deposit in different region of the respiratory tract:

where N d denotes the number of particles depositing on wall of certain region in respiratory tract and N t represents the total number of particles inhaled into the model. A i denotes the area of wall of certain region and N i represents the number of injecting particles of certain region. This numerical simulation is conducted by the CFD software of ANSYS FLUENT 14.0. The number of particles used in each simulation case is about 5000,000, and, for each numerical simulation, one week computation time is needed.
2.3. Initial Condition and Boundary Condition
First of all, three-cycle presimulation is conducted to eliminate initial effect because the inlet velocity is stable during stable breath. The stream flux of nasal inlet is assumed to be constant; the direction for inhalation and exhalation is reverse. The pressure outlet boundary is imposed on outlet of bronchial; that is, the pressure is zero and gradient of other variables is zero. When the particles impact model wall, it is marked as deposition and the track computation is over, which accords with the real instance well. Different from many papers, the pressure inlet condition is selected in this paper. One box extending from nasal inlet is added to consider the inlet effect because the pressure at nasal inlet is not equal one atmosphere but the boundary of the box.
2.4. Numerical Procedures
In this paper, block partition grid method is employed in order to save computer source and computation time. Thus, most regions of this complex computational domain are partitioned by tetrahedron grids, and the total number of grid is not very large. In order to exclude effect of the grid number on computational results, the grid numbers about 500,000, 1000,000, and 200,000 are tested. It is found that 1000,000 grids is enough accurate for this problem resolution and adopted for this paper.
The numerical solutions of the continuity and momentum equations are carried out with Fluent. In the present simulation, the coupled airflow equations and pressure fields are solved by PISO algorithm with underrelaxation. The particle transport equation is also solved with the commercial software in combination with particle tracking. Particles are released simultaneously at the box boundary after the constant flow field has been established. The force of particle caused by airflow is considered, which is called one-way method. Computation tracking particle is conducted every two steps.
3. Result and Discussions
3.1. Local Distributions of Injecting Particle from Right and Left Nasal Inlet
In order to compare the effect of airflow rates and particle diameter on injecting particle distributions from different inlet, three airflow rates and one type of micron particle and nanoparticle are investigated.
As shown in Figure 3 the distributions of injecting particles from left nasal inlet differ greatly from right inlet according to airflow rates and particle diameter. At low airflow rate, the injecting particles form left inlet first flow into left nasal cavity and then move toward the front channel wall gradually. At the junction of nasopharynx the particles fully occupied the front wall area. Through the contracting-expanding nozzle structure of throat-glottal border the particles turn to move forward to the back wall; the “fore-and-aft transposition effect” is completed after the larynx-glottis border. After the larynx-glottis border the left injecting particles move further to left wall area and at last most of the particles enter into the first left bronchia. The contracting-expanding structure at the border among pharynx, larynx, and glottis composes the “spray effect” which has a great effect on flow field and drives the interlaced motion. Meanwhile the transposition area is also the high deposition area (as shown in Figure 4). At middle respiration rate, the same phenomenon can be seen. But the “transposition effect” is completed until the bronchial entrance. The injecting micron particles from right or left nasal inlet enter into bronchia more equably, while nanoparticles move into the bronchia with high-uniform mixture. When the velocity of particles is rising, the inertia effect is enhanced and the transposition effect is carried out slowly. Nanoparticles are affected by Brownian force and Saffman's lift significantly resulting in more symmetrical distribution in bronchia region. At high respiration rate, the transposition pattern somewhat changes. The left injecting particles move slowly to the right wall area. At the entrance of the main trachea, the left injecting particles occupy the right side, which forms “left-right transposition effect”. The majority of microparticles flow into the corresponding bronchia again, while nanoparticles evenly flow into both sides of bronchia. As the speed increased, the effect of inertia is strengthened and results in the transform of “left-right transposition” instead of “fore-and-aft transposition.” It could offer theoretical basis for efficient drug targeting.
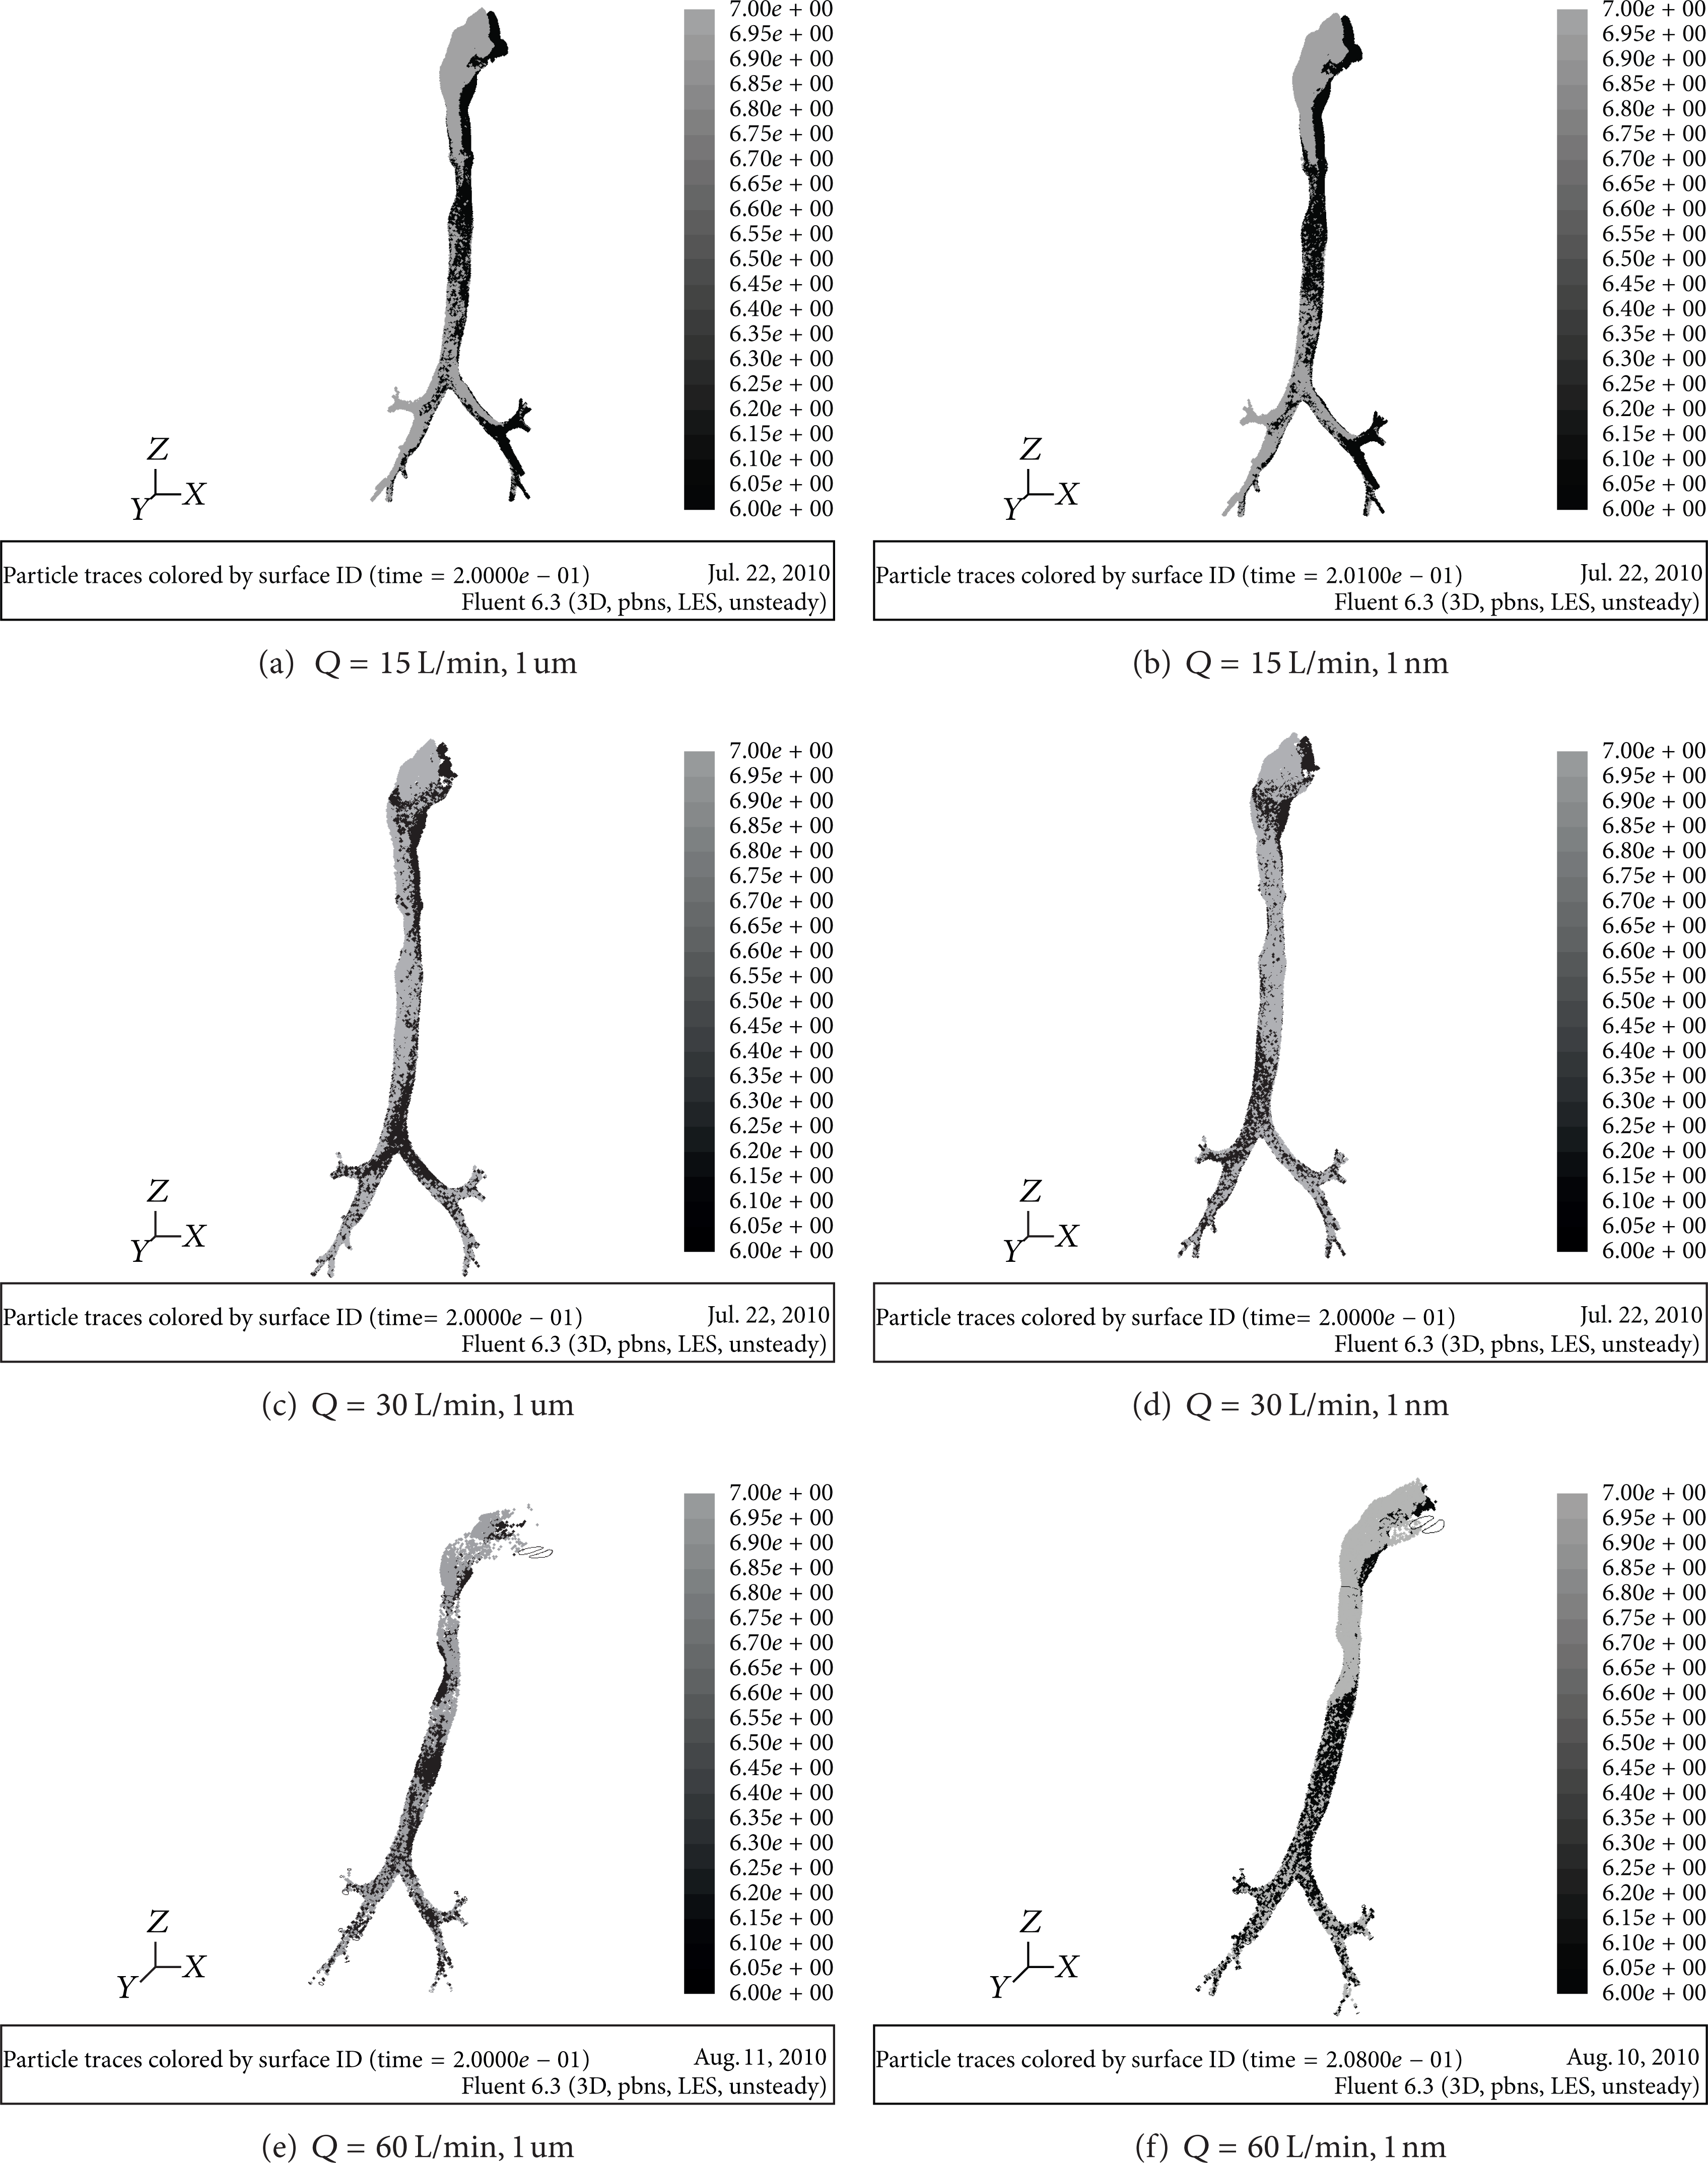
Distributing conditions of particles from left and right nasal inlet (black presents the left injecting particles; gray denotes the right injecting particles).
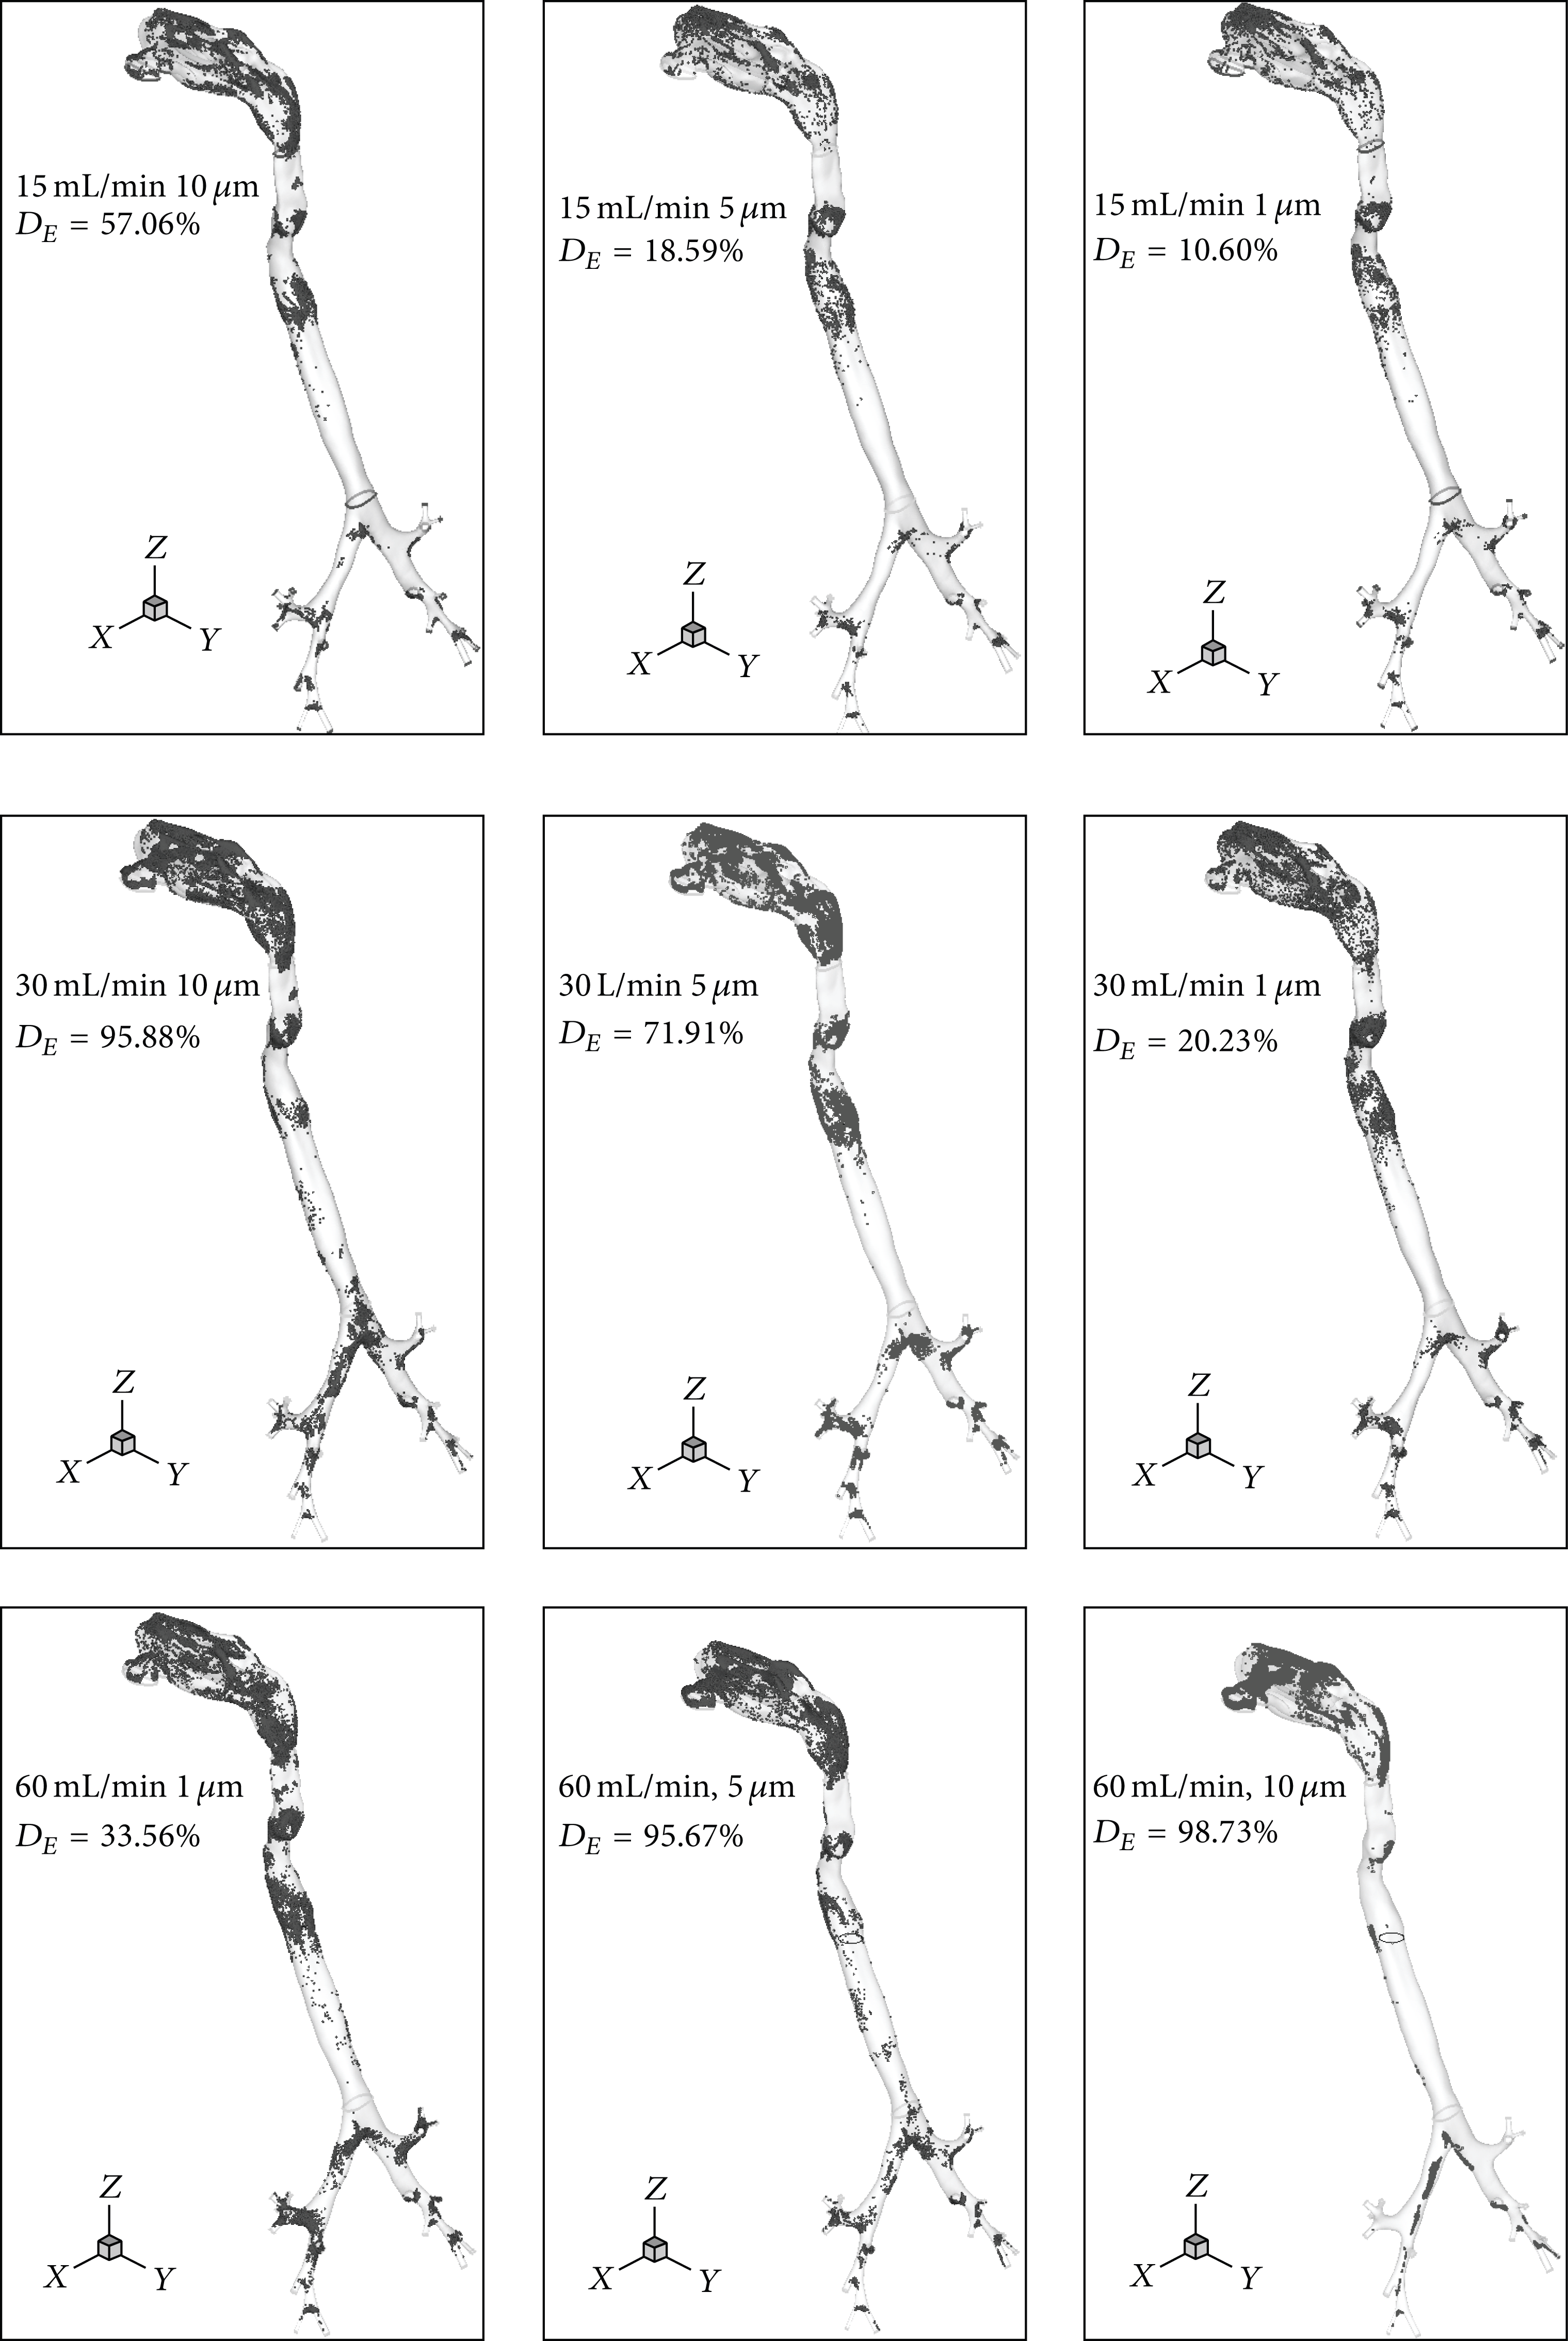
3D distributions of micron particles deposition in the whole computation domain in different conditions.
3.2. Deposition Location of the Particles in Various Conditions
In order to investigate the particle deposition and the formation mechanism of “hot spots,” Lagrange method is implied to track the particle movement. Three airflow rates including Q = 15 L/min (low-level breathing at resting condition), Q = 30 L/min (middle-level breathing at light exercise condition), and Q = 60 L/min (high-level breathing at moderate exercise condition) are adopted as computational case, respectively. The particle depositions in different parts are visualized in Figures 4 and 5. Darker color particles stand for the deposition on the front wall and the lighter color particles for the back wall.

3D distributions of nanoparticles deposition in the whole computation domain in different conditions.
It can be seen from Figures 4 and 5 that both micron particles and nanoparticles show a significant accumulation and asymmetric deposition with a high level. Particle depositions are affected significantly by the geometric structure, particle diameter, and respiratory intensities. In all conditions, it displays a high deposition on the surface in special region including four syphon structure surfaces among nasal cavity, throat, and glottis and two spray structures consisting of pharynx-glottis and glottis-throat around the carinal ridges. The depositions focus more on the front wall area. A big curvature of airway wall leads to the rapid impact of particles and the formation of deposition. The sharp contraction of tracheal section generates the “spray effect,” which makes the air flow change greatly and produces a large and high flow shear on particles. So in these areas they show high depositions. The carinal ridges between upper and lower levels bronchia are the main resistance surface for air flow; particles are affected by inertia remarkably. It leads to the direct impact between particles and wall, which then forms the deposition. There is less particle deposition or even no deposition on flat-straight wall in pharynx, trachea, and bronchia under various conditions.
For micron particles the deposition concentrations increase exponentially following the breath intensities and particle diameter. When the condition is 15 L/min and 1 um, the D E value is only 10.6%. While the deposition concentrations rapidly augment to 98.73% in the condition of 60 L/min and 10 μm, the deposition concentrations of the condition (60 L/min, 5 μm) are comparable to that of the condition (30 L/min, 10 μm); however the deposition concentrations of the condition (30 L/min, 5 μm) are higher than the condition (15 L/min, 10 μm). These phenomena reveal that the breath intensity affects the deposition more significantly than particle diameter. The reason may be that the movements of micron particles are dominated by inertia impact and gravity, and Brown forces, Saffman's lift force, and so on will be ignored.
As for nanoparticles the deposition concentrations increase with the respiratory intensity also, while the magnitude is much lower than micron particles. It indicates that the role of inertia is still dominant. But the deposition concentrations first decrease and then increase with the decrease of particle diameter. The total changing of deposition concentrations is less than 4%. It implies that the role of gravity weakens remarkably, and Brown force and Saffman's lift force begin to play an important role. At different respiratory intensity, the particles of 20 nm reach the minimum value. At both low and high respiratory intensity, there is a certain amount of deposition on the flat-straight section of the throat and trachea wall, while at middle respiratory intensity the deposition is relatively less. The reason could be that at low respiratory intensity, nanoparticles are dominated by Brownian forces and easily form the deposition on the flat-straight wall; at moderate respiratory intensity viscous drag force is equivalent to Brown force which hinders the deposition of particles; at high respiratory intensity a large velocity gradient and high shear flow field occur and then Saffman's lift force plays a dominant role and forms a high deposition. At the same time there are obvious depositions on bronchial wall area and carinal ridges at high respiratory rate. The reason could be explained by the fact that the velocity gradient of airflow field on the resistance surface region is high and causes the lateral forces; Saffman's lift force can easily change the track of the small particles. When the diameter is less than 20 nm, the particle deposition concentrations begin to increase slightly. It is the result of the interaction role of Saffman's lift and Brown force.
3.3. Statistical Number of Particle Deposition and Escape
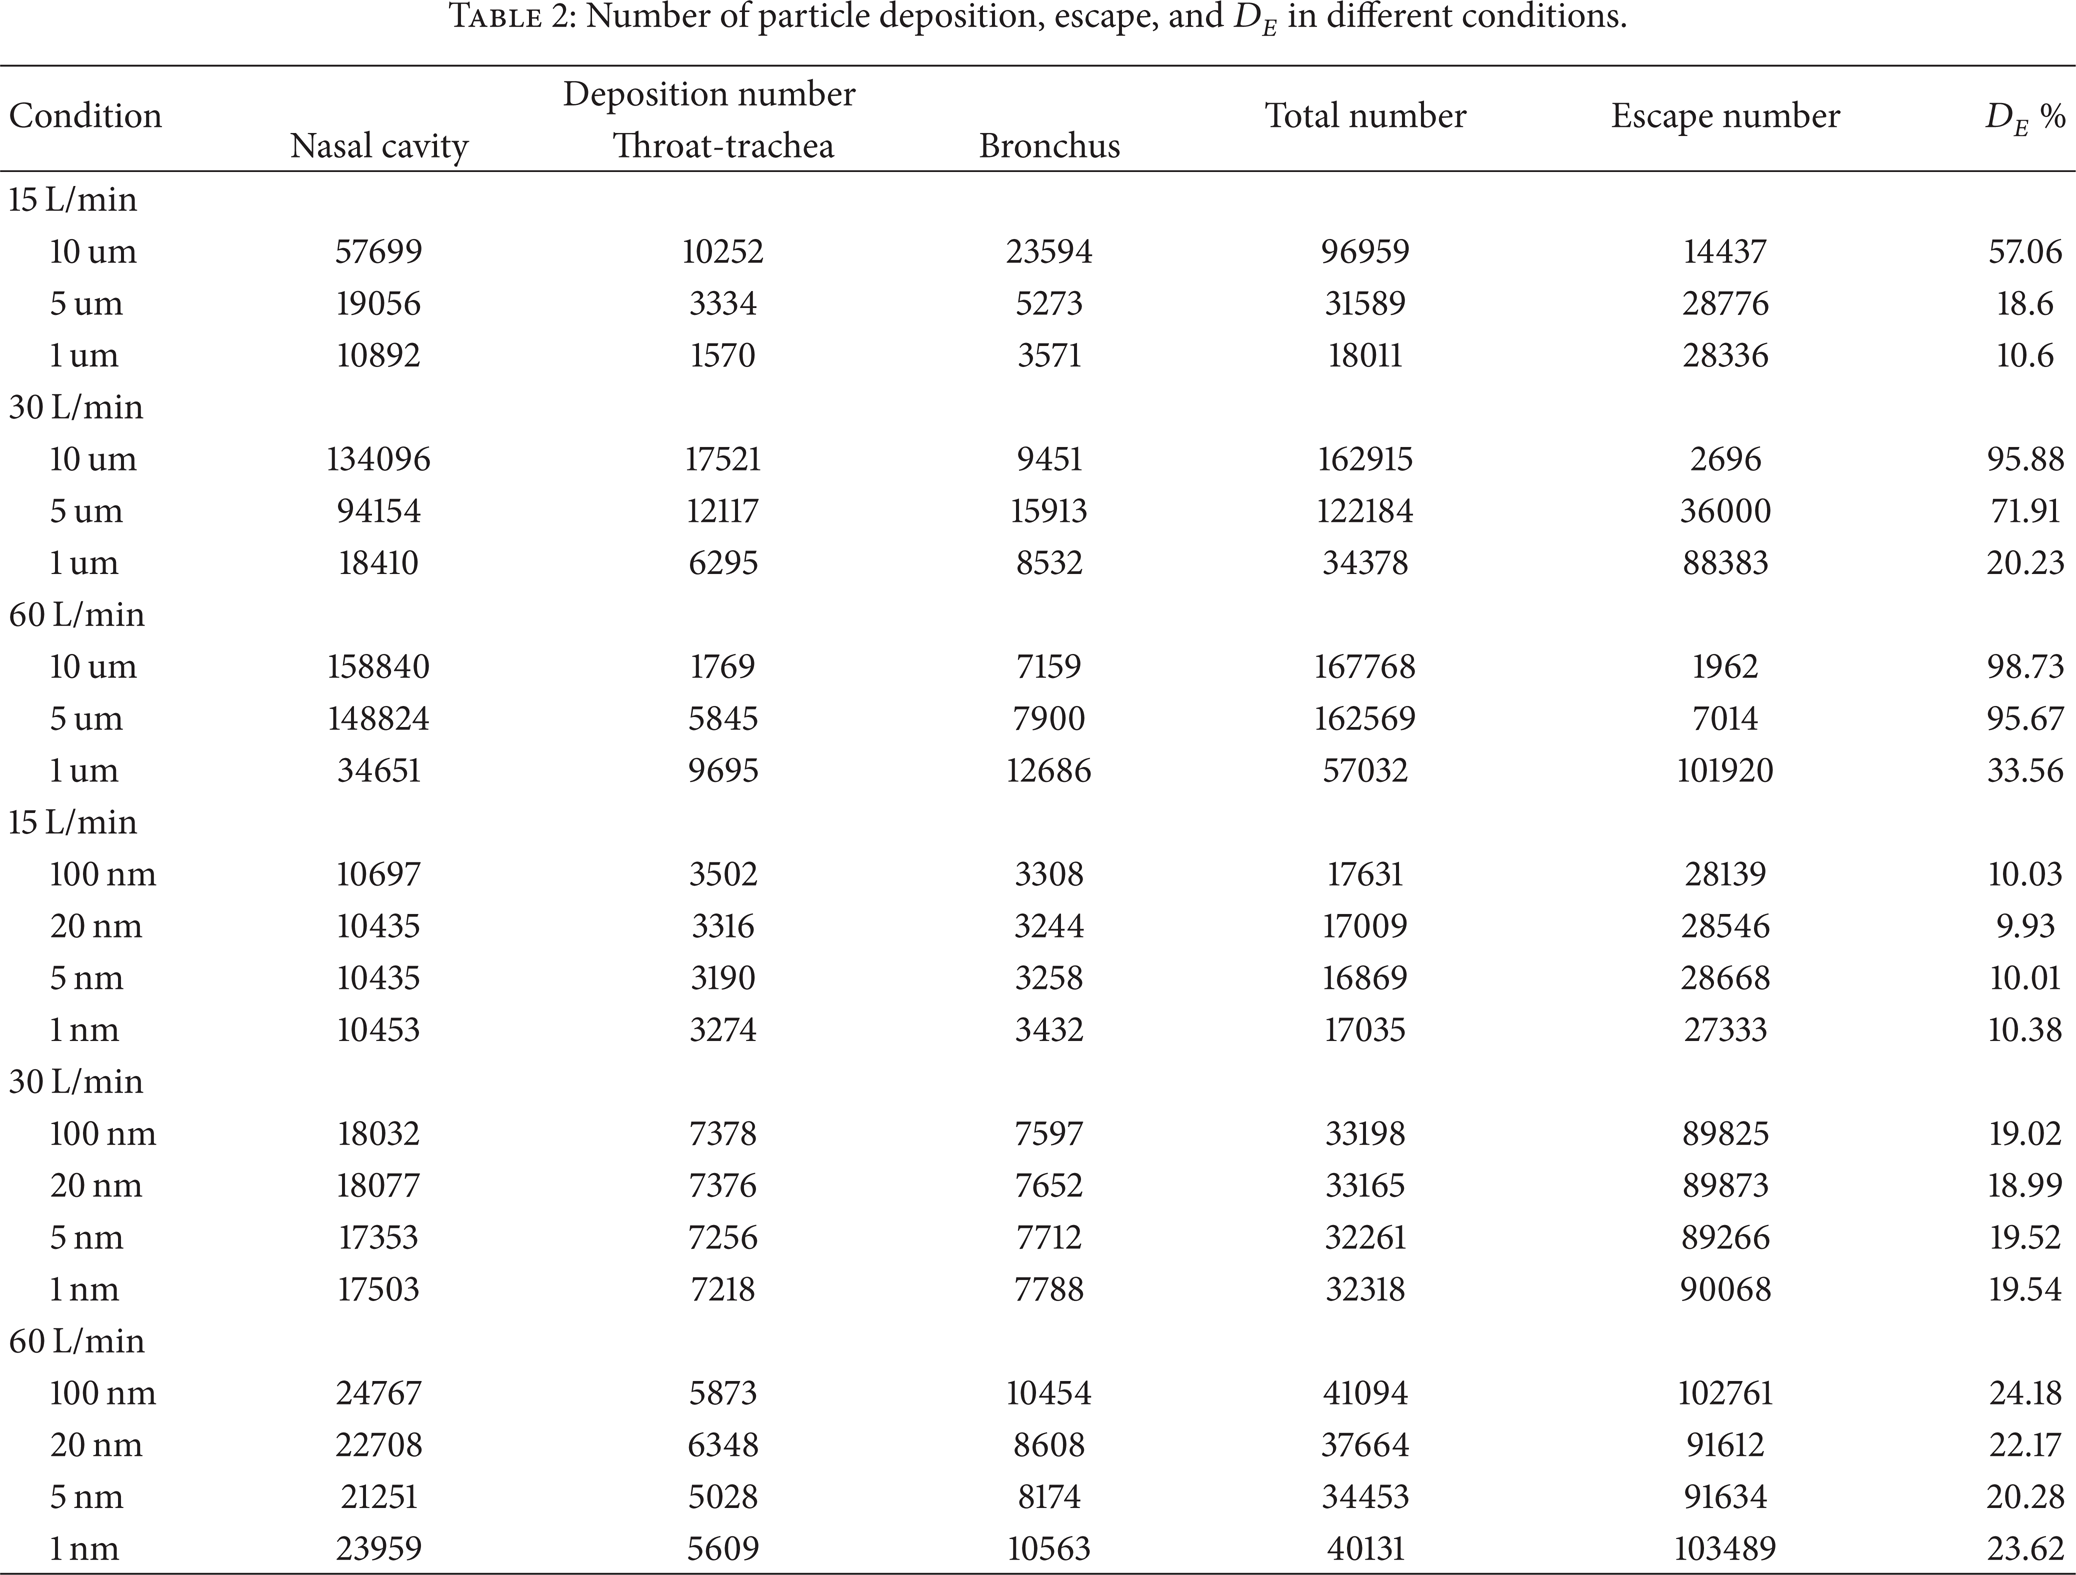
To quantitatively understand the depositions of the fine particles in different conditions, the deposition number, the escape number, and the suspending number are counted and analyzed; meanwhile the wall is divided to several subregions. The total number of injecting particles into the model is 169,920, the regional division is shown in Figure 1, the particle number of deposition and escaping in different regions is displayed in Table 2, and the changing trends of D E values with diameter under different breath intensities are plotted in Figure 6.
Number of particle deposition, escape, and D E in different conditions.
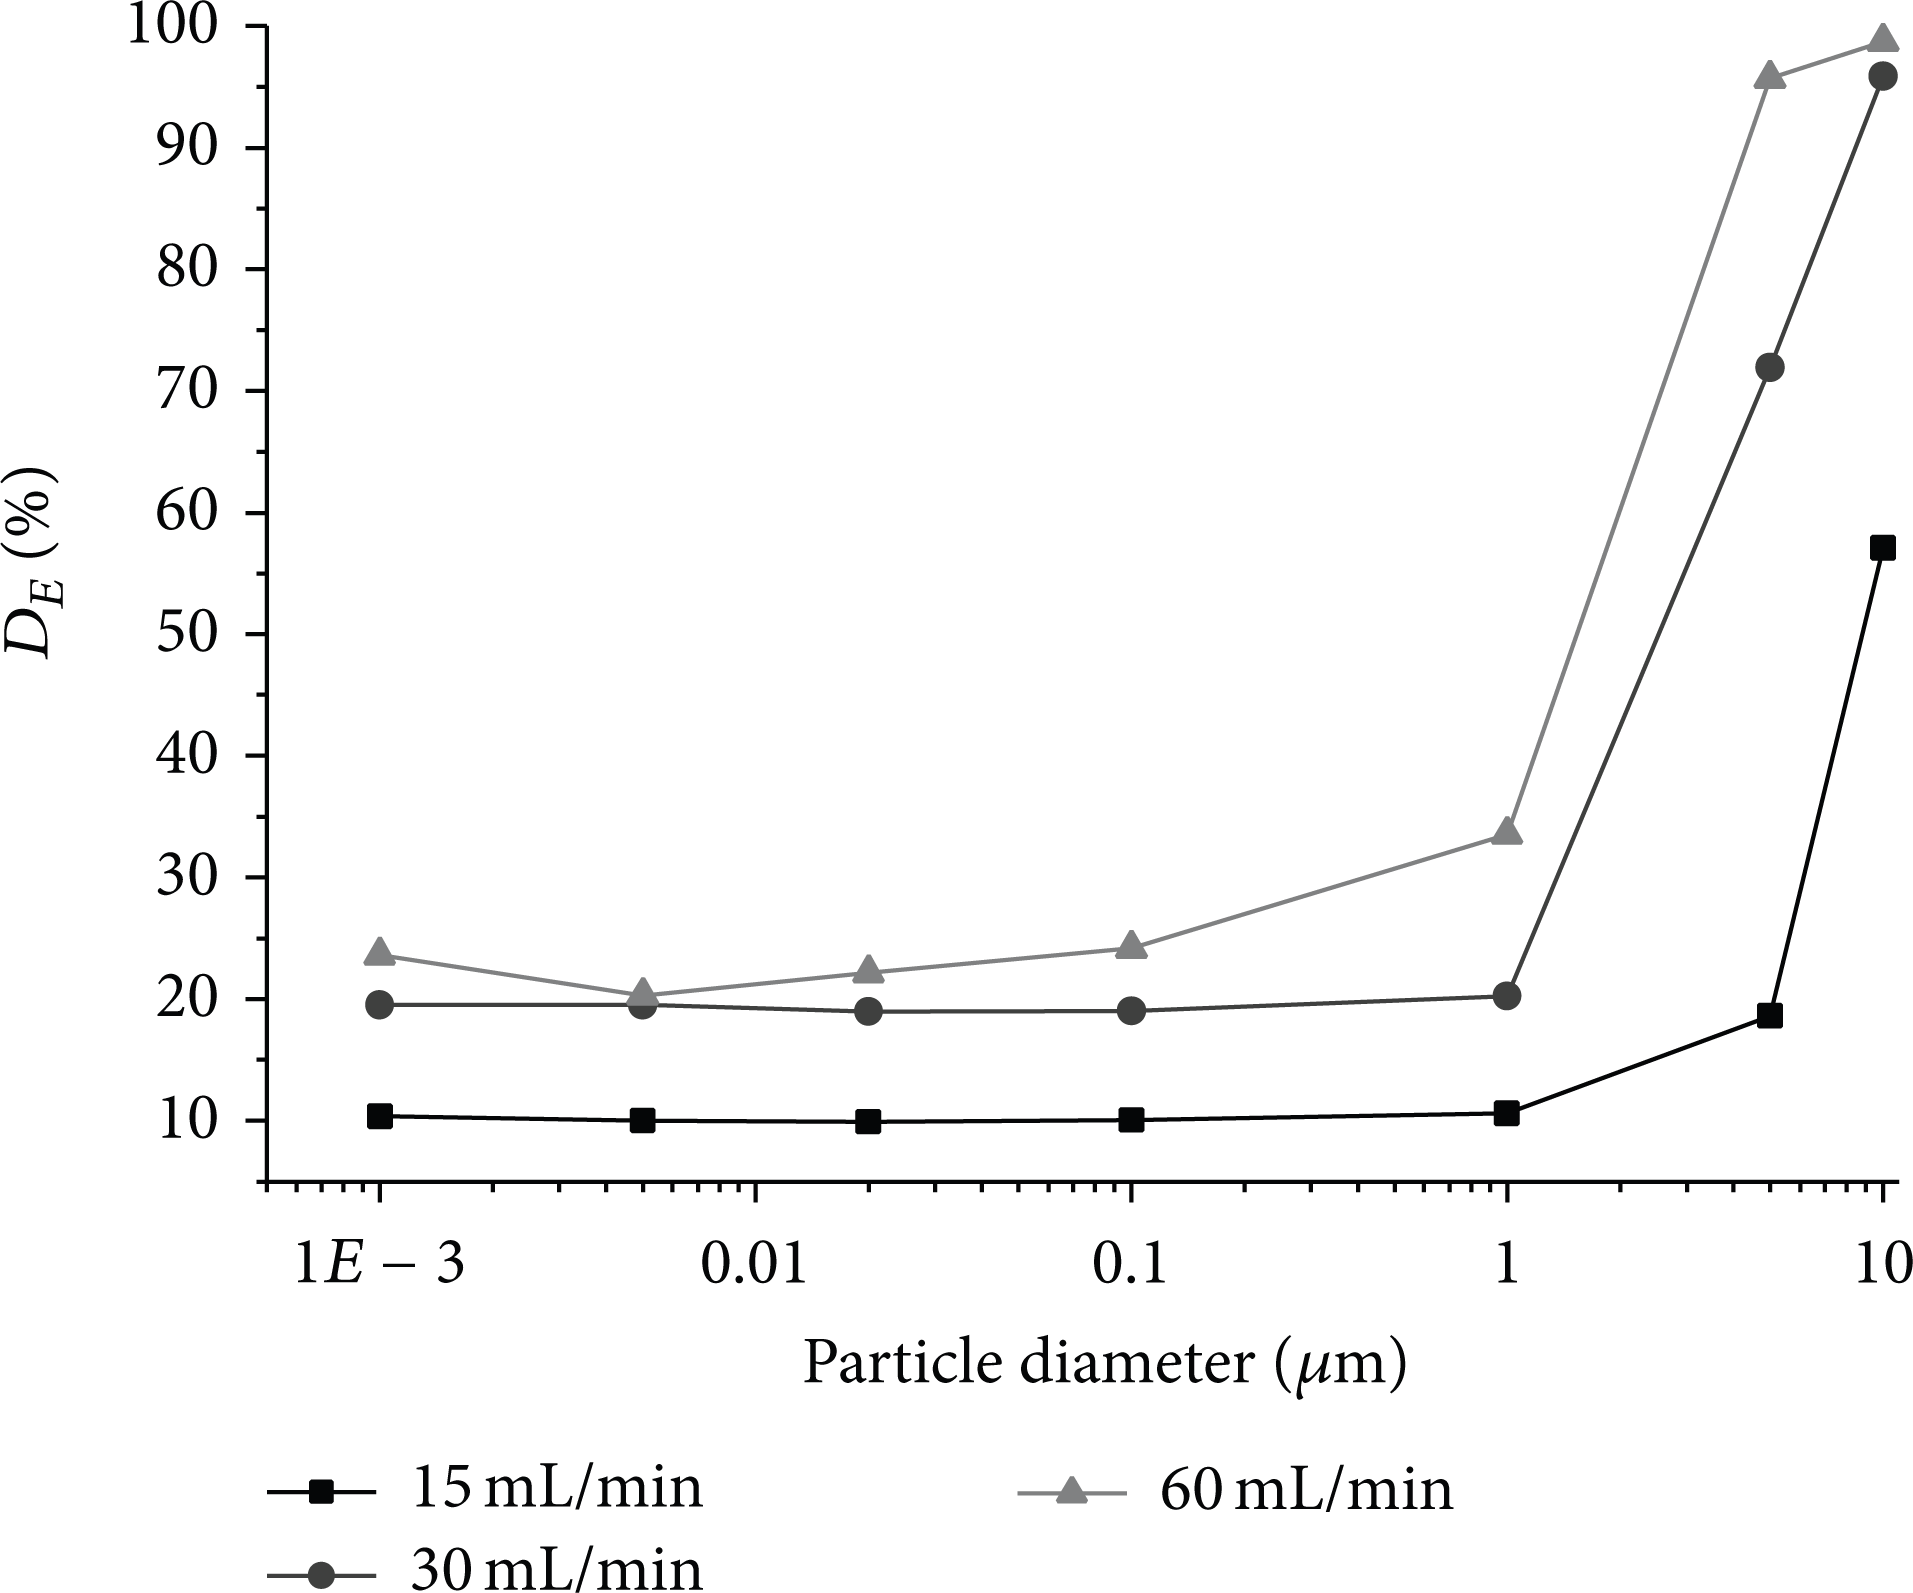
Variation of total D E values in the whole computation domain as a function of particle size.
For micron particles, the deposition numbers increase rapidly following the rise of respiration intensity and particle size. When the particle diameters have large difference, the decay effect is more notable. The particles are almost completely deposited, and the escaping number of particle is only 1962. In the condition nasal deposition number reaches 158,840 particles, only about 5% particles escape from this region. Both the maximum and the minimum escaping numbers occur in high respiration intensity of 60 L/min. The reason may be that the inertia and gravity play an important role for the large particles and easily form deposition, while the small particles are subject to viscous drag force and Brown force which hinder the particle deposition. So the small particles could escape rapidly from upper respiratory tract in high velocity.
As for nanoparticles, the particle numbers of deposition and escape are greatly influenced by the change of respiration intensity, and the numbers both imply that the speed of particles is a crucial factor for particle movement in this condition. However the effect of particle size is very weak for deposition and escape. The fluctuation range is from 0.02% to 2.9%. The number of escape particles is almost at a stable value. When the respiration rate increased from 15 L/min to 30 L/min, the deposition rate nearly doubled, while the escape particles nearly enlarged 3 times. It suggests that the impact of gravity and viscous drag force weaken, and Brown force and Saffman's lift force start to play a dominant role. In low respiration rate about 75% nanoparticles are neither deposited nor escaped, but are suspending. The particles are significantly affected by Brownian force and not easy to deposit. In high respiratory intensity, only about 20% of particles are suspended, and most particles escape and enter into the next bronchia.
As shown in Figure 6 the curves of D E values display a trend like “L” with the decrease of particle diameters. The total D E values for nanoparticles change smoothly and slowly, first decreasing and then increasing a little. When the particle diameter reaches microlevel, the values get a rapid rise; and the D E values multiply with respiration. The particles ranging from 1 nm to 1 um under different respiration are difficult to deposit and easy to reach the lung.
3.4. Comparison of Particle Depositions in Partial Wall
In order to understand the conditions of particle depositions in different parts, the local D E values are computed, and the differences between microparticle and nanoparticle are comparatively analyzed. It is shown in Figure 7 that the D E values in the nasal cavity under different conditions are almost the highest. The values increase significantly with the rise of respiration intensity, and D E value of condition (60 L/min, 10 um) reaches nearly 95%. The depositions in this area can be excreted by the mucus, and its impact on human health will be limited. Bronchial D E values are generally higher than or comparable to the throat region. It indicates that more particles deposit facilely on carinal ridges.
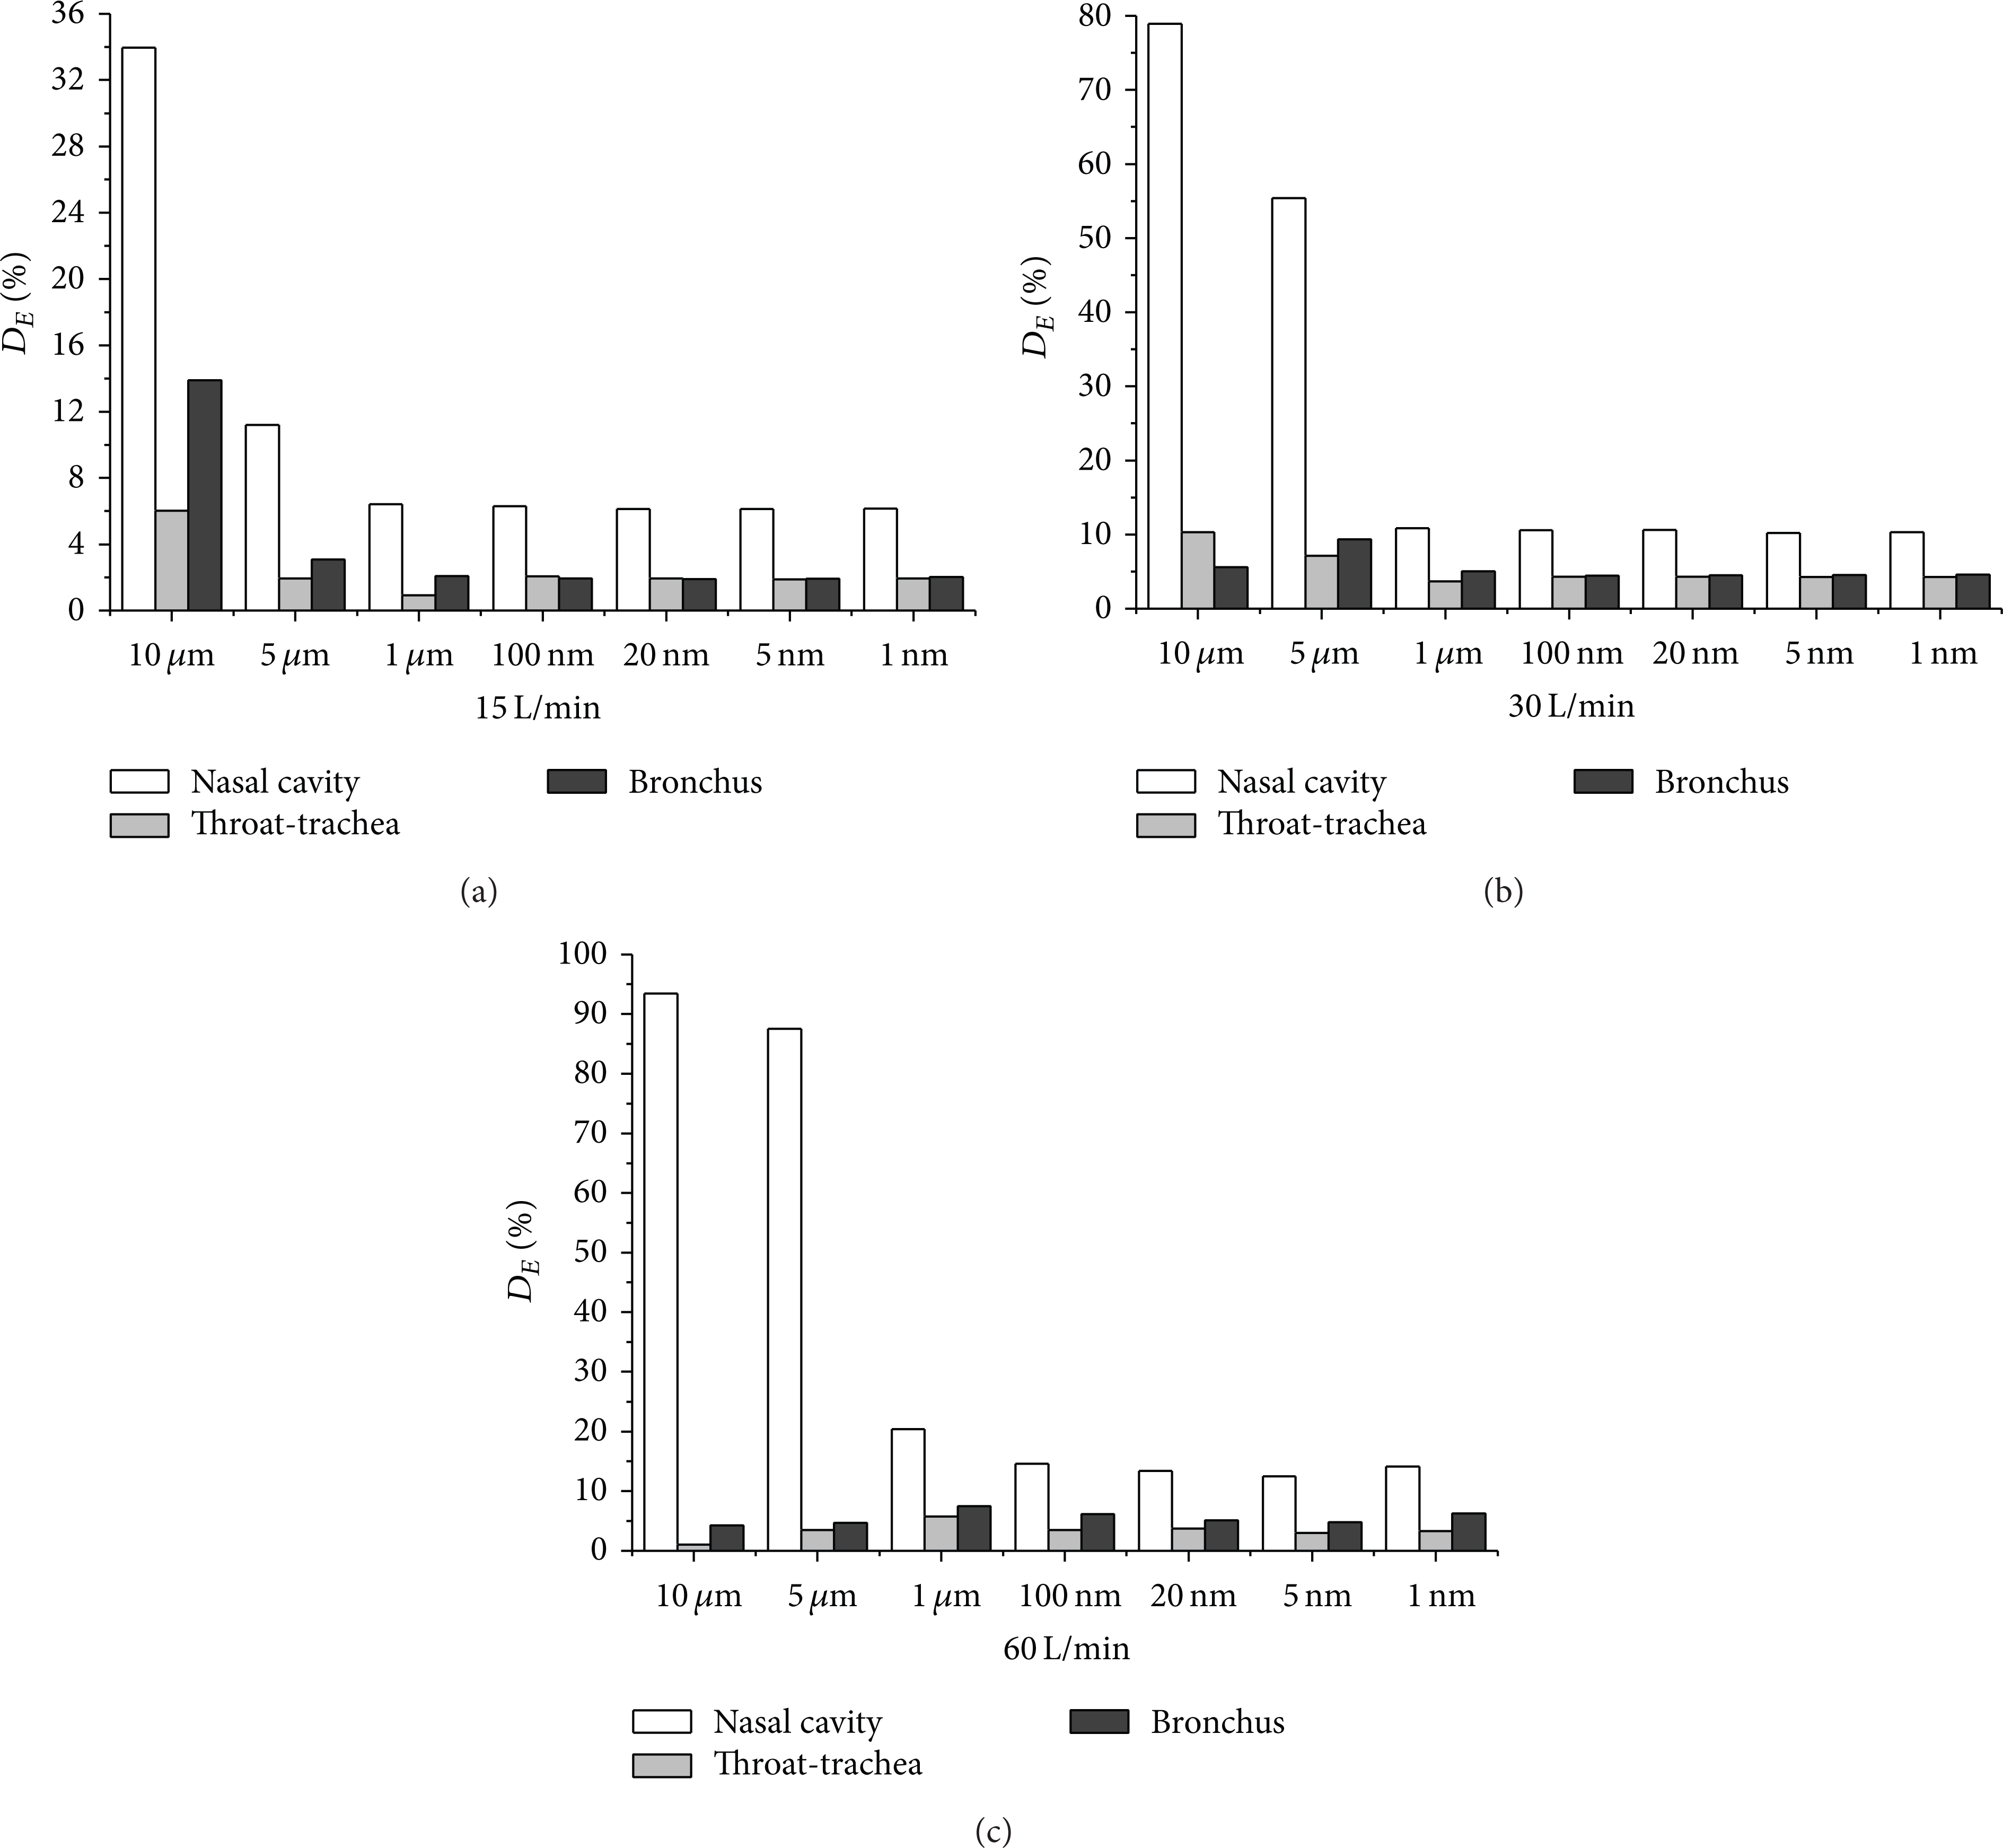
Particle D E values for partial area in different conditions.
For micron particles, there is a large difference in D E values in different regions. In the condition of 60 L/min and 10 um, the value of nasal cavity is 93.48% and that of the throat section is only 1.04%, indicating that the movement and deposition of particles are affected significantly by the changing flow. That is also the result of inertia. The effect of particle size is different from different regions. The D E values of nasal cavity show a unilateral increasing trend, while for the throat and bronchial segment at high intensity the values all decreased with breathing, and at low intensity the values show contrary trend. The reason may be due to the changing of dominant force.
For nanoparticles, the D E values in different regions are much lower than micron particles, and all are less than 10%. The D E values distribute evenly. The D E values of throat are comparable to bronchial segment indicating that the changes in flow affect the shear function of airflow field little. The D E values increase linearly with respiration intensity, but the influence has been reduced substantially more than micron particles. The change of the size shows a weak influence on the D E values, and the fluctuation is less than 0.1%. The effect of gravity and inertia causing the particle depositions at this time has been secondary; meanwhile Brown force and Stanford lift force begin to dominate the nanoparticles deposition.
3.5. Capture Efficiency of Partial Area
C E is introduced to analyze the capturing performance of the injecting particles in different regions. It can be seen from Figure 8 that the C E values of nasal cavity are highest in some situations, but the maximum value occurred on the bronchia wall for the capture of large diameter particles. The value of the condition (60 L/min, 10 um) reaches 99.5%, showing that the capturing performance of the bifurcation structure and blocking face is strongest for large particles, and the values of throat segment are the lowest in different conditions. In the condition (30 L/min, 10 um), the C E values of different region are all displaying a very high degree, above 60%, while, for the condition (60 L/min, 10 um), the C E values of nasal and bronchia are higher than 90%. It suggests that different walls can all form an effective capture for large particles in middle and high respiratory intensity.
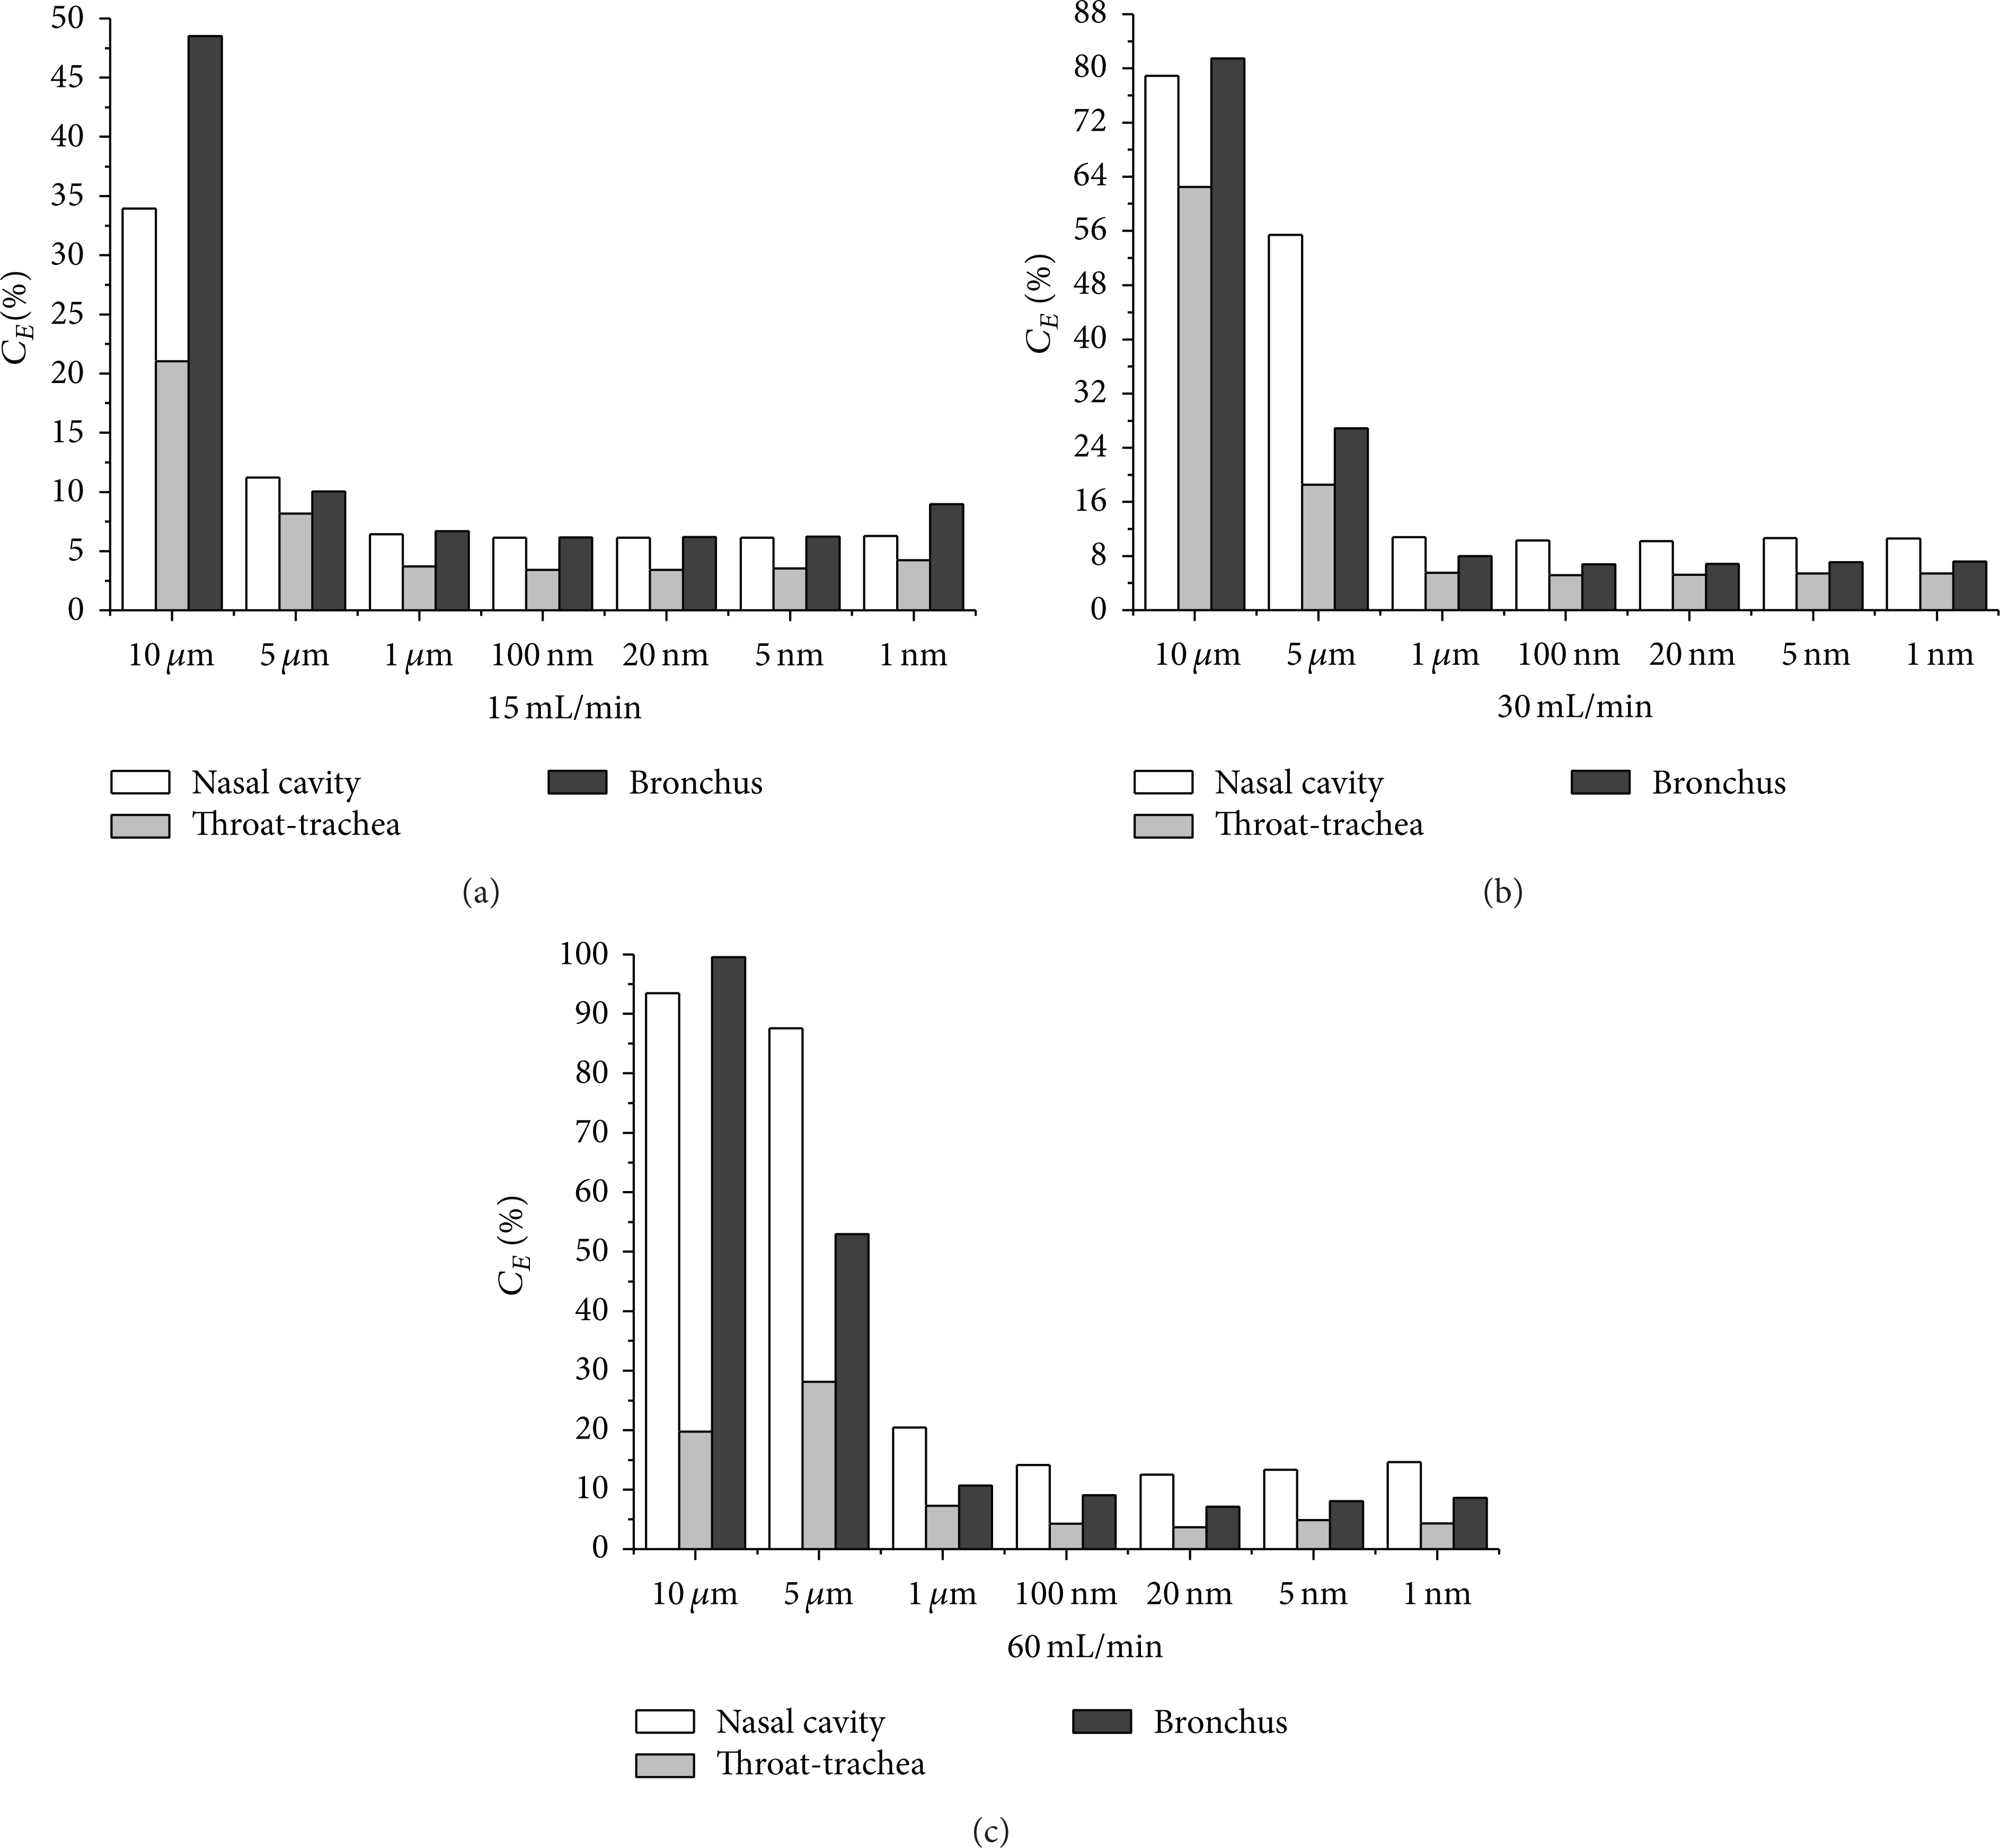
C E values for partial area in different conditions.
For micron particles, the C E values of nasal cavity and throat increase linearly with respiration and particle size, while the values of throat section display a different trend of first increasing and then decreasing at high respiratory intensity. As for nanoparticles the C E values of different regions show little difference, and the changes in flow have little effect on C E values. The C E value increase with the rise of respiration indicating that inertia is still influential. The C E values displayed a trend like “U” with the increase of particle size. This result is due to the weak effect of the local geometry on nanoparticles, and the role of Brown's force enhances and leads to the rise of C E values.
3.6. Deposition Concentration (D C ) of Partial Area
The D C is characterized with the deposition number of partial area per unit area. The results of D C values in different partial area are shown in Table 3.
Capture efficiency (C E ) values of partial area in different conditions.

As seen from Table 3 the distribution of particle depositions under different conditions displays a high asymmetric concentration. The maximal D C value reaches 1308 particles/cm2 formed in nasal cavity, and the minimum value is 21 particles/cm2 in the throat section. The difference between them is nearly 60 times. The D C values of nasal region in different conditions are all highest. The radical changes of flow track lead to the formation of the “hot spot.” Bronchial D C values are generally higher than that of throat region, which show variable trends with the particle diameter and the changes of respiration, where the “hot spot” easily leads to respiratory diseases.
The D C values of micron particle are generally higher than that of nanoparticles. For micron particles, D C values change with breathing intensity significantly, and different regions show quite different trends. Under low and medium respiration intensities, the D C values most increase with particle size except bronchial segment with moderate respiration. In high respiratory intensity the D C values start to decrease with increasing particle size except nasal cavity. The reason is that the big particles can form more effective depositions in nasal cavity and throat section with the increase of respiratory intensity and little particles enter into the next generation bronchia.
As for nanoparticles, the D C values in different regions display a little difference, and all increase with the respiration rate. In the same respiration rate, the D C values change a little with particle diameter. In medium and low respiration rate, the difference of the D C values is no more than 5 particles/cm2, implying that nanoparticles can form a uniform deposition. The particle diameter slightly affects the deposition. With the increase of respiration, the D C values of bronchia are significantly increasing and approaching nasal cavity gradually.
4. Conclusions
A real upper respiratory tract including nasal cavity, pharynx, larynx, trachea, and 6-generation bronchia is built. LES model is used and the particle deposit efficiency (D E ), deposition concentration (D C ), and capture efficiency (C E ) are introduced and computed. Seven kinds of particles including micron particles and nanoparticles and three representative respiratory intensities are discussed.
The injecting particles presented transposition effect in the junction among pharynx, larynx, and the glottis, while following respiratory intensities the fore-and-aft transposition turned to left-right transposition effect. In all conditions, a large number of particle depositions focus on the surface of four 90° syphon structures.
The D E values of micron particles are much higher than nanoparticles and affected significantly by the respiration intensity and particle size, while the size of particle plays a weak role on nanoparticles deposition. Under different conditions, the highest value of D E and D C both occur in the nasal cavity region. The maximum D E reached 93.48%, and D C is 1308 particles/cm2 which is nearly 60 times more than minimum D C . The C E value in bronchus region is the highest up to 99.5%. The particles are almost completely captured which indicates that blocking cross face has the strongest performance for capturing particles. That tends to form hot spots of deposition and cause respiratory diseases.
The particle deposition is affected significantly by the geometry structure, particle diameter, respiratory intensities, spray effect, and so on. Micron-sized particles are easily affected significantly by particle size, viscous drag, and gravity; however nanoparticles are easily affected by Brownian forces and Saffman's lift edge effect.
Conflict of Interests
The authors declare that there is no conflict of interests regarding the publication of this paper.
Footnotes
Acknowledgment
The authors wish to express their thanks to Natural Science Foundation of China (Grant no. 51376161).