
Abstract
The conventional gathering and transportation mode of heating the produced fluid of oil wells with hot water or steam may result in excessive energy consumption. In order to perform the unheated transportation, the idea of hydraulic suspension transport of the gelled crude oil is proposed based on the actual production of Daqing Oilfield, and the experimental system is established to test characteristics of oil particle distribution which have an important effect on the hydraulic suspension transportation. In the experiment, the image of gelled crude oil particle distribution was obtained in a horizontal pipe with inner diameter of 0.053 m, and then the law of particle distribution was investigated by the theoretical model. The results showed that the gelled crude oil hydraulic suspension transport could be achieved without any chemical reagent when the gelled crude oil was transformed into particles and dispersedly suspended in water. The results also showed that the gelled oil particles of 0–4 mm in size accounted for 92% or more of all particles, and the percentage of gelled crude oil particles of a size of 4 mm gradually increased with the increasing mixed flow rate.
1. Introduction
Due to the properties of high pour point and viscosity in Daqing Oilfield, the conventional way of the gathering and transport process is blending the hot water and heating wellhead output. Unfortunately, this method will greatly increase the consumption of energy to raise the temperature of the mixture in the transport process. To solve the problem, the mode without heating can be used, which will result in the blocking up of pipelines and the unsafe factors. The reasons may be that the bulk gelled crude oil is suspended in the water when the temperature is below the pour point. Designing new fluidization equipment, which cuts the bulk gelled crude oil into small oil particles and makes the particles be suspended in the water, the low-energy and safe transportation will be realized. The key issue is that the distribution of particle size of the gelled crude oil has important effect on the safe transportation.
A number of studies on the size and distribution of multiphase flow droplet were conducted. Berthoumieu et al. have measured the size of the spherical droplets at the gas velocity of 20–80 m/s and the approximate water drop speed of 10 m/s with phase Doppler particle analyzer (PDPA), observed droplets using black lighting technology and froze droplet movement with stroboscopic light, analyzed the characteristics of the droplet distribution by image processing, and finally found that the droplet size was mainly between 30 and 300 μm [1]. Angeli and Hewitt have suggested that the pipe materials had greater impact on the size of droplets by comparing the rule of droplet size distribution in oil-water dispersed flow between stainless steel pipe and acrylic resin. The data has been obtained using a video recording technique which employed an endoscope, based on the experimental conditions, as follows: pipe diameter was 25 mm, flow rate was 1.1∼1.7 m/s, and oil phase viscosity was 1.6 mPa·s [2]. Simmons and Azzopardi have measured the size distribution of kerosene and aqueous potassium carbonate solution by means of two optical measurement techniques in the pipe with inner diameter of 0.063 m. One was a backscatter technique using a Par-Tec 300C and another was diffraction technique using Malvern 2600. The results showed that Hinze theory was more suitable for calculating the maximum size of droplet at low dispersed phase concentration, but both Hinze theory and the modified model failed to give a proper description at high concentration of the dispersed phase [3]. Luo et al. have investigated the phase distribution of bubbles inside a two-phase droplet suspension using a three-dimensional photographic method, which simultaneously got the flowing front and left view images with a plane mirror that was vertically placed at an angle of 45° against the side face of the pipe. The results showed that this method was not applicable to a low porosity flow at concentration of less than 10% due to the absence of fully overlapping air bubbles [4]. Desnoyer et al. have measured the droplet size distribution ranging from 1 μm to 2 mm of nickel dioxide solution at the density of 1020 kg/m3 and hydrogen chloride solution at the density of 1050 kg/m3 in the mixing stirred vessel using a laser granulometer [5]. Lovick et al. have counted the rule of droplet size distribution mainly ranging from 20.6 μm to 230 μm in kerosene-water two-phase flow using a light back scattering technique and a high-speed video recorder in an agitation tank with the oil phase fractions in a range of 5–10% [6]. Lovick and Angeli [7], Al-Wahaibi and Angeli [8] have carried out a study on the droplet size distribution using a stainless steel tube with a diameter of 38 mm and at the oil phase viscosity of 5.5 and 6 mPa·s, respectively. The results showed that Rosin-Rammler distribution function was the optimum in this case. Vielma et al. have researched the droplet size distribution in oil-water mixture with conductivity probe technique. The tests were conducted with a superficial velocity 0.025 m/s for a mineral oil and 1.75 m/s for water, and the results showed that Log-Normal distribution function was able to describe the phenomenon of oil droplet size distribution more accurately [9]. Maaß et al. have conducted lots of experiments on the rule of drop distribution in liquid-liquid two-phase flow and concluded that the two technologies of the two-dimensional optical reflection and a fiber optical sensor were better than the technology of the focus beam reflectance measurement through a comparative study among three techniques [10]. Moradi et al. have measured the droplet size distribution ranging from 2 to 40 μm in water-oil emulsion with three distribution functions using digitally processing optical micrographs. The results showed that Log-Hyperbolic and Log-Normal distribution functions were optimal [11].
The above researches of the distribution of particle size provided important guideline for this study. However, there were two problems in this literature. (1) The working fluids of the experimental and numerical investigation usually used the substitute of the real oil-water two-phase flow; the substitution could not reveal the accurate physical property of crude oil which directly affected oil-water flow state. (2) The temperature of oil-water mixture in these studies was higher than the pour point, and the studies on the oil-water two-phase flow state below the pour point have not been reported. Therefore, in order to realize the safe transportation, the idea of gelled crude oil has been proposed and the experimental study on the distribution of particle size has been carried out. The main contents are as follows: the experimental system of the hydraulic suspension transport has been designed and research object for the water-gelled crude oil droplet system has been created. Oil particle distribution characteristics and prediction model of the maximum gelled crude oil particle have been obtained from the experimental results coupling with the relevant mathematical model. The aim of this paper is to provide technical support for low-energy and safe transportation in the oilfield.
2. Experimental Process and Methods
Since the crude oil produced from the majority of oilfields in China has the characteristics of high pour point, high viscosity, and high wax content, the conventional approach for gathering and transport system is to heat crude oil. The main process is to convey the oil-water mixture by mixing the hot water which is heated by furnace. The biggest drawback of the above process is huge energy consumption. Reducing the outlet temperature (i.e., temperature of mixing water) of the heating furnace has great significance in the energy conservation of the system; thus the hydraulic suspension transport is an effective solution. The idea of the hydraulic suspension transport is as follows: a special way is taken to make the crude oil be suspended in water in the form of particles without heating, and the temperature of the mixing water in the oil-water gathering and transport pipeline is below the pour point of crude oil.
The experimental setups are calibrated prior to the experiment, and the accuracy of the experimental setups can be acceptable. The main accuracy of the setups is as follows: the accuracy of the thermometer is 0.2°C, the accuracy of the flow meter is 0.5%, and the accuracy of water-cut ratio is 0.01%.
2.1. Hydraulic Suspension Experimental Process for Transport of Gelled Crude Oil
The flow chart of the hydraulic suspension transport system was designed in this paper as shown in Figure 1. The main processes of this system seen from Figure 1 are as follows: M-N-G1 indicates the pipe of wellhead output, E-F-G2 indicates water mixing pipe (the mixed water was obtained from underground to achieve low energy consumption and environment protection), and G3-H-K indicates pipe for transport of wellhead output mixed with water with a total length of 1100 m. As can be seen from Figure 1, the fluidization setup is the most important equipment in the system. Figure 2 shows the photograph of the equipment which has an input diameter of 10 mm and wellhead output diameter of 8 mm. It can be seen that the water-gelled crude oil flowing through the fluidization setup generates complex physical processes. The steps of the progress are as follows: (1) the wellhead output is squeezed into long stripped shape through variable glove vane of the fluidization setup; (2) particles are formed by a vertical water flow; (3) gelled crude oil hydraulic suspension conveying system is achieved.
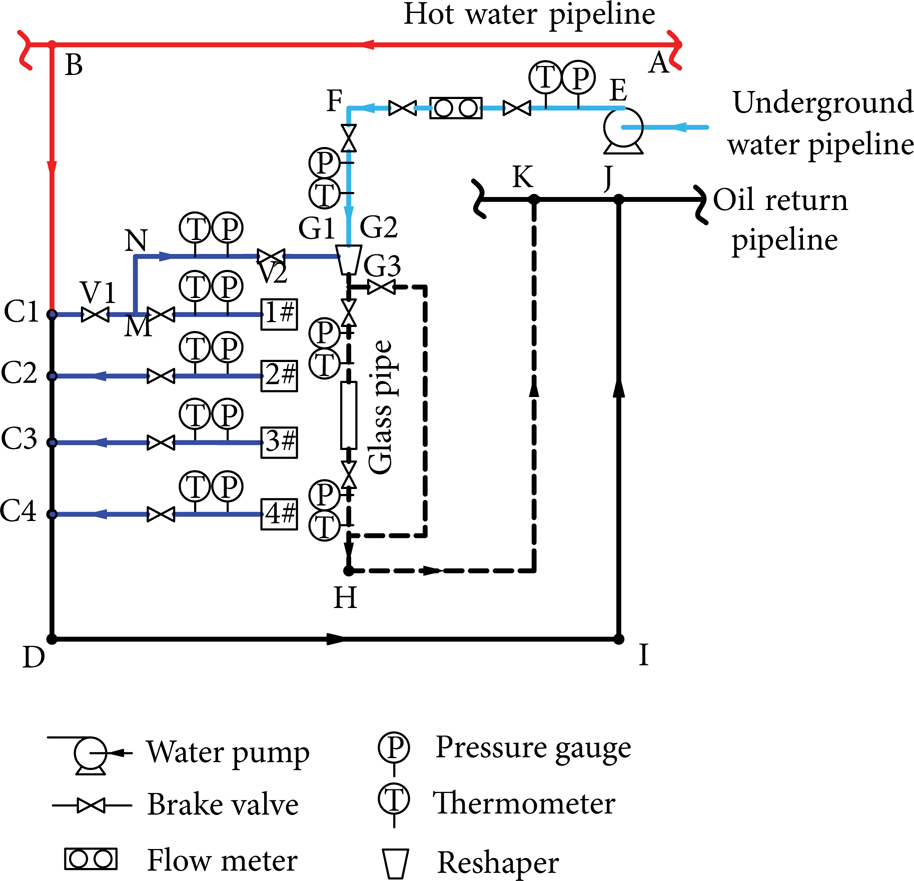
Flow chart of the hydraulic suspension transport system located at Daqing Oilfield.

Photograph of the fluidization setup.
2.2. Experimental Methods
2.2.1. Control and Regulation of Experimental Parameters
The change of mixed flow rate affects the shear rate of phases, which leads to different movement trace of particle size and the distribution difference in particle size. As the amount of the wellhead output at the wellhead is a constant, the mixed flow rate is changed by altering the amount of mixing water in this experiment.
2.2.2. Acquisition of Particle Images
The distribution of gelled crude oil particles was observed by utilizing the level quartz glass tube with high transparency and thermal stability in the experiment. The main parameters of quartz glass tube are as follows: length of 1 m, inner diameter of 53 mm, thickness of 3.5 mm, and pressure capacity of 2.5 MPa.
The major methods previously used for acquisition of particle and particle images include backlit imaging technology [12], liquid immersion imaging method [13], and microscope video technology [14]. These methods are mainly applicable to the study of microparticles. As the gelled crude oil particles were in macroscopic scale at low flow rate, the imaging method was employed to obtain particle image using NikonD7000 camera with the technical parameters shown in Table 1.
Technical parameters of camera.

3. Theoretical Assumptions and Models
3.1. Quasi Fluid Assumption
When the water-gelled crude oil is gathered and transported at the temperature below their pour points, the crude oil is transformed into gelled particles after fluidization equipment in hydraulic suspension transport process. Differing from solids and liquids in the general state, the gelled crude oil particles have two properties of the defined interface of solids and yield-pseudoplastic fluids.
In this paper, the gelled crude oil particles were treated as quasi fluid. In other words, they could be regarded as a special kind of continuous media pseudoplastic fluid in terms of space-time statistical significance when ignoring the particle microstructure. In such case, the physical quantity of gelled oil particles could be expressed as Eulerian coordinate and continuous-time function.
3.2. The Degree of Overcooling to Gather and Transport the Multiphase Flow
The multiphase flow process of water-gelled crude oil in pipeline, the particle size, and distribution characteristics of gelled crude oil are directly related to the gathering and transportation temperature. The degree of overcooling to gather and transport the multiphase flow is defined as follows:
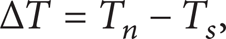
where ΔT is the degree of overcooling to gather and transport the multiphase flow, °C; T n is pour point for crude oil of 38.0°C; T s is water-gelled crude oil pipeline gathering and transportation temperature, °C.
The degree of overcooling reflects the extent to which temperature of water-gelled crude oil gathering and transportation is lower than pour point for crude oil, which directly affects the particle size and distribution characteristics of gelled crude oil. Therefore, the degree of overcooling is used as an important independent variable in this paper.
3.3. Viscosity of Gelled Crude Oil
In this paper, the gelled crude oil is yield-pseudoplastic fluid with a strong shear thinning property. The viscosity, as a function of temperature and shear rate, decreases with increasing shear rate, which can be expressed as follows:

where μap is viscosity of gelled crude oil, Pa·s;
3.4. Model for Analysis of Statistical Distribution Properties of Gelled Crude Oil Particles
In the hydraulic suspension transportation process, the size and distribution of gelled crude oil particles directly affect the dynamic characteristics of the multiphase flow. A study on the size and distribution properties of particles in fluid provides the basis for other relevant research.
3.4.1. Probability Density of Gelled Crude Oil Particle Distribution
To describe the distribution characteristics of gelled crude oil particles, it is necessary to adopt an appropriate probability density function for describing the rule of particle group distribution in gelled crude oil. In the actual pipeline transportation of water-gelled crude oil multiphase flow, gelled crude oil particles have an irregular and nonuniform performance. The average diameter was employed for the analysis of particle size, while the imaging method was used for the measurement of particle size. The experimental data were fitted with Normal distribution [15, 16], Log-Normal distribution [17, 18], and Rosin-Rammler distribution [19, 20], respectively. In order to investigate the rule of particle size distribution of gelled crude oil, the experimental data was compared with the value of distribution function; a fitting curve diagram for the above three distribution functions is completed.
(1) The probability density function f(d) of gelled crude oil particles based on the Normal distribution model can be expressed as follows:

where d is equivalent diameter of gelled crude oil particles, mm; μ is average diameter of gelled crude oil particles, mm; σ is standard deviation of diameter of gelled crude oil particles, mm.
The distribution function can be expressed as follows:

among
Equations (3) and (4) show that the distribution function F N (d) in Normal distribution follows the Normal distribution of mean μ and variance σ2, which can be generally expressed as distribution function F N (d)∽N(μ, σ2).
Mean μ and variance σ2 are calculated based on the following equations:
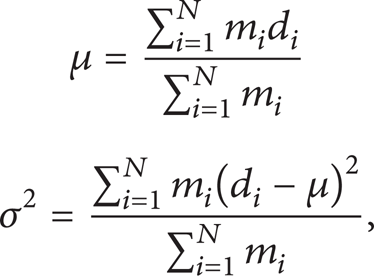
where N is number of gelled crude oil particles (including average diameter); d i is particle diameter of ith gelled crude oil, mm; m i is number of gelled crude oil particles with diameter of d i (including average diameter).
(2) The probability density function fLN(d) of gelled crude oil particles based on the Log-Normal distribution model can be expressed as

where μ′ is the mean of ln d and σ′ is the standard deviation of ln d; the distribution function can be expressed as

Thus, FLN(d) follows the Normal distribution of mean μ′ and variance σ′2, denoted by FLN(d)∽N(μ′, σ′2).
Equation (6) is improved based on (3); that is, the Log-Normal distribution density model is obtained after improving Normal distribution density model.
(3) The probability density function f(d) of gelled crude oil particles based on the Rosin-Rammler distribution model can be expressed as

where l is median diameter size distribution of particles in gelled crude oil, serving as a parameter of particle size distribution range, mm; m is characteristic parameter of particle distribution.
Its distribution function can be expressed as

By taking the logarithm of (9), the equation can be converted to

Therefore, with lnd as x-axis and ln{− ln[1 − F(d)]} as y-axis, a double logarithmic coordinates system has been established with slope of m.
3.4.2. Error Analysis of the Distribution Function
The weighted average error method was used to judge the agreement between distribution function of gelled crude oil particles and actual measurements. For the distribution of gelled crude oil particle size the weighted average error refers to the cumulative sum of the percentages of particle number in a certain range after multiplying with the absolute error between the distribution function and actual particles in such range, and the calculation method is shown in

where S is the weighted average error;
3.5. Prediction Model for Maximum Particle Size
Hinze's model is often used to predict the maximum size of the liquid droplet shown in (12), but the prediction model corresponding to the maximum particle size of gelled crude oil has not been reported. The revised Hinze's prediction model is utilized in this paper. The main idea of Hinze's prediction model is as follows: when the particle size follows a logarithmic Normal distribution, the maximum particle size can be calculated with Sauter mean diameter d32, of which the coefficients a, b, and δ are calculated with reference to Azzopardi's processing techniques shown in (14)–(16):
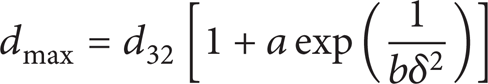
among


where dmax is the predicted maximum diameter of particle, mm; dmax′ is the measured maximum diameter in the experiment, mm; d N ′ is the measured particle size that is smaller than a random number in the experiment.
In the liquid-liquid two-phase flow, b in (12) is a constant of 4, while a of 1.35 and δ of 0.61 are constants when they follow logarithmic Normal distribution. In other two-phase flows, the particle size will be selected depending on the actual situation.
4. Results and Discussion
Experimental parameters are as follows: output of oil well is 16.14 t/d; water-cut ratio is 82.1%; specific speed of oil phase is 0.02 m/s; specific speed of water phase is 0.45∼0.70 m/s (Figure 3); the temperature of wellhead output is 35°C; buried depth of pipeline is 1.8 m; mixing water temperature is 12°C; mixing water flow rate is 3∼5 m3/h; and degree of overcooling is 22.4∼23.6°C. During the process of the experiment, the viscosity of the oil is measured by Brookfield viscometer with an uncertainty of 2% and the results are shown in Figure 4 (A is wax precipitation point for crude oil, B is anomalistic point for crude oil, and C is losing flow point for crude oil in Figure 4).

Schematic diagram of specific speed.

The change of the viscosity of the oil with the temperature.
4.1. Probability Analysis of Particle Distribution of Gelled Crude Oil
The front view flow image shown in Figure 5 was photographed at visual glass segments at mixed flow rates of 3.7 m3/h, 4.7 m3/h, and 5.7 m3/h, respectively. As could be seen from the image, irregular gelled crude oil particles existed in continuous water phase as dispersed phase, and their scale and size distribution varied with the flow rate.

Photograph of the gelled crude oil particle distribution.
To accurately obtain the size of gelled crude oil particles, the Image-Pro Plus 6.0 (Media Cybernetics) software was used to handle the images of gelled crude oil particles in this paper: (1) filter original image to remove the noise; (2) adjust the current brightness, contrast ratio, and gamma settings with contrast enhancement; (3) determine the gelled crude oil particles to be measured on the image after treatment, and segment overlapping particles with the watershed transform; (4) due to irregularity of gelled crude oil particles, use the average parameter as the diameter of the particles, and convert the size of gelled crude oil particles according to the relationship between pixel on the scale and corresponding image size. The error in the determination of particle size must be less than 1% [21].
In order to investigate the distributing rule of gelled crude oil particle size, at least 2,300 points were selected from each image of different working conditions for statistical analysis. The actual particle size distribution, Normal distribution, Log-Normal distribution, and Rosin-Rammler distribution at different mixed flow rates are shown in Figure 6.

Change of the gelled crude oil particle distribution with the mixed flow rate.
Figure 6 shows that the size of gelled crude oil particles was mostly concentrated in the range of 0∼4 mm and smaller gelled crude oil particles accounted for a large proportion of total participles. Meanwhile, Figure 6 also indicates that both Log-Normal distribution and Rosin-Rammler distribution agreed with the actual particle size distribution very well. When the particle was in the 0.2–0.4 mm size range, Rosin-Rammler distribution was slightly larger than the measured value, and Log-Normal distribution data was slightly smaller than the measured value; when the particle was in the 0.4∼0.6 mm size range, both Log-Normal and Rosin-Rammler distribution were slightly smaller than the measured values; when the particle was in the 0.6∼2 mm size range, Log-Normal distribution data was slightly larger than the measured value and the Rosin-Rammler distribution was slightly smaller than the measured value; when the particle was larger than 2 mm, both Log-Normal distribution and Rosin-Rammler distribution were slightly smaller than the measured values.
Figure 6(a) shows the particle of less than 4 mm in size accounting for 92.6% at mixed flow rate of 3.7 m3/h; Figure 6(b) shows the particle of less than 4 mm in size accounting for 93.8% at mixed flow rate of 4.7 m3/h; Figure 6(c) shows the particle of less than 4 mm in size accounting for 94.1% at mixed flow rate of 5.7 m3/h. Therefore, two conclusions can be drawn. (1) The percentage of particle size within 4 mm increases with the increasing mixed flow rate. This may be due to the fact that the larger particles might be cut into smaller particles under stronger shearing action, which is caused by continuous phase of water and dispersed phase of gelled crude oil particles when oil-water mixture flow rate increases. Meanwhile, the increasing of mixing water decreases the proportion of oil phase and the number of gelled crude oil particles and reduces the collision chance between particles. As small particles are not easily aggregated into large particles, the particle size of gelled crude oil is very small. On the other hand, with the flow rate increasing, the kinetic energy of the system leads to a larger interfacial energy between oil and water based on the perspective of energy balance. Furthermore, the particle size is the smaller, the area of oil-water interfaces and the interface energy are greater. It is more difficult to cause the aggregation of gelled crude oil particles. Therefore, the numbers of smaller particles in gelled crude oil increase with increasing flow rate. (2) With increasing the mixing water rate, the percentage of particles size within 4 mm gradually decreases. This may be due to the fact that increasing the mixing water rate decreases shear rate. For yield-pseudoplastic fluid, the viscosity decreases with increasing of shear rate, and large particles are easily to be cut into small ones with a smaller viscosity. According to (2), the decreasing of viscosity becomes smaller and smaller with increasing of shear rate, which will lead to decreasing of the chance for large particles to be broken into small ones.
Figure 7 shows the absolute error between Normal distribution, Log-Normal distribution, Rosin-Rammler distribution, and the actual distribution of gelled crude oil particle size at different flow rates. The following conclusions can be drawn from Figure 7. (1) When the sizes of particles are less than 1mm and in the range of 1.6∼3 mm, the maximum absolute error between Normal distribution and the actual particle size distribution happens, which provides the poorest description of the experimental data. For particles in other size ranges, the absolute error is small, which provides a better description of the experimental data. (2) Log-Normal distribution and Rosin-Rammler distribution: the absolute error between both distributions and actual particle distribution is smaller in this experiment, so that they are able to properly describe the experimental data.

The absolute error between three distributions and the actual distribution of particles at different mixed flow rates.
In order to further describe the distribution effects of three distribution functions at each small area and the whole range of particle size, the weighted average error of three distribution functions is calculated based on (11) and the results are shown in Table 2.
The weighted average error of three distribution functions.

Through a comprehensive analysis based on Table 2 combined with Figures 6 and 7, Rosin-Rammler distribution and Log-Normal distribution show very small weighted average error and the weighted average error of the former was slightly smaller than that of the latter. Therefore, Rosin-Rammler distribution function in describing the size distribution of particles in gelled crude oil is slightly superior to the Log-Normal distribution.
4.2. Sauter Mean Diameter d32 of Gelled Crude Oil Particles
Based on the experimental data at mixed flow rate of 3.7 m3/h, 4.7 m3/h, and 5.7 m3/h, the Sauter mean diameter d32 of the gelled crude oil particles is calculated with the above-mentioned statistical distribution model (13), as shown in Table 3.
Main calculated results of Sauter mean diameter d32 of the gelled crude oil particles.

Three conclusions can be drawn from Table 3. (1) Sauter mean diameter becomes smaller with increasing subcooling temperature because of non-Newtonian fluid property of experimental fluid. Non-Newtonian high pour point oil has sheared thinning property which is more obvious with decreasing temperature. The shear thinning behavior is mainly caused by the reduction of energy dissipation system as a result of damage to the bond of the particles and consequent changes in the wax crystals size, shape, arrangement, and orientation crude oil which were not conducive to the segmentation. (2) The Sauter mean diameter of oil-water dispersed flow decreases with increasing mixture flow rate, which is mainly due to the fact that the enhanced shearing action of continuous phase and the gelled crude oil particles intensified the cracking of gelled crude oil particles in dispersed phase, thus resulting in a reduction of gelled crude oil particle size in oil-water mixture. (3) The Sauter mean diameter of gelled crude oil particles is gradually reduced with increasing water-cut ratio, which is mainly caused by two reasons: one is the enhanced fluid shear action and the other is the decrease of collision frequency between gelled crude oil particles with increasing of the water-cut ratio.
4.3. Prediction Model of Gelled Crude Oil Maximum Particle Size
The maximum particle size of gelled crude oil and its relative error are calculated with Hinze's model shown in (12) and Sauter mean diameter d32 shown in Table 3. The results are shown in Table 4.
The relative error of maximum particle size between Hinze's model and testing value.

Table 4 shows that the relative error of the maximum particle size of gelled crude oil is more than 40% using Hinze's liquid-liquid maximum particle size prediction model, which indicates that this model is not suitable for the prediction of maximum particle size of gelled crude oil. Therefore, Hinze's maximum particle size prediction model is modified in this paper on the basis of Hinze's maximum particle size prediction model shown in (12) and Azzopardi processing method. In order to obtain the modified prediction model, the parameters of b, a, and δ have been recalculated in this paper.
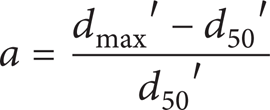
According to (14) and (15), combined with the specific experimental data, the results are derived as follows: a = 5.71, δ = 0.37. Then, combining with (12), b = − 5.6 is obtained. The modified model of maximum particle size of gelled crude oil is shown in
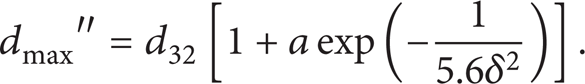
According to the fitted equation (17), the maximum particle size of gelled crude oil and its relative error are calculated with a 99.7% confidence level under the experiment conditions. The results are shown in Table 5.
The relative error of maximum particle size between the modified prediction value and testing value.
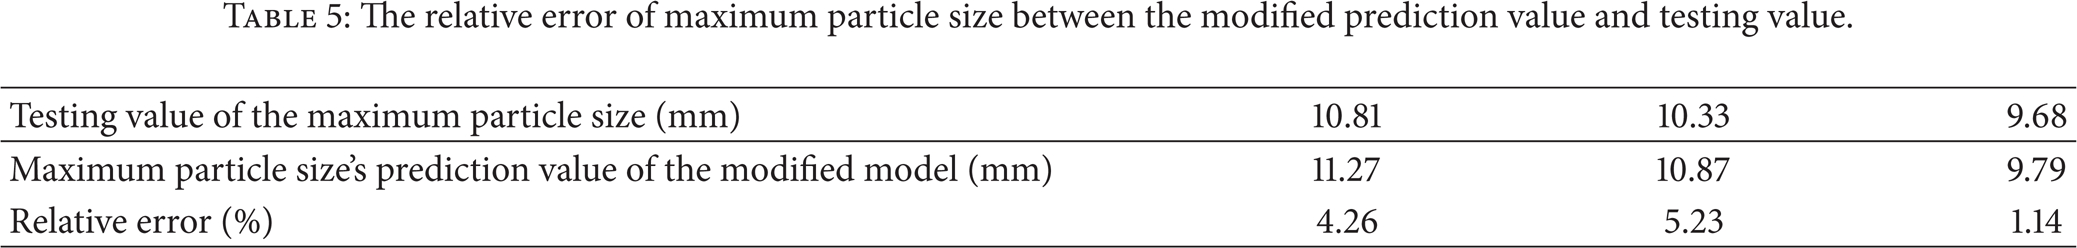
Table 5 shows that the prediction result of gelled crude oil maximum particle size using modified maximum particle prediction model agreed with the measured value very well; their relative error is less than 6% when the converted speed of oil phase is 0.02 m/s and that of water phase is 0.45∼0.70 m/s, and degree of overcooling is 22.4∼23.6°C.
5. Conclusions
In this paper, a study was carried out on the characteristics of particle size distribution in gelled crude oil based on the water-gelled crude oil hydraulic suspension transport test. The main conclusions were drawn as follows.
The hydraulic suspension system for transport of gelled crude oil was established in the oilfield, then an experiment on the hydraulic suspension system for transport of gelled crude oil was carried out by directly using oil-water mixture produced from oil wells at different flow rates, and finally the water-gelled crude oil two-phase flow image was obtained. The results showed that the gelled crude oil particles were dispersedly suspended in water.
Under the conditions of the oil phase specific speed of 0.02 m/s, the water phase specific speed of 0.45∼0.70 m/s, and overcooling temperature of 22.4∼23.6°C, the smaller gelled crude oil particles accounted for a larger percentage, of which particles in the size range between 0 and 4 mm exceeded 92%; and with the increase of mixed flow rate, the percentage of the gelled oil particles of less than 4 mm in size increased, and the increasing trend was gradually declining; as the subcooling temperature increased, the Sauter mean diameter of gelled crude oil particles became smaller.
Both Rosin-Rammler distribution and Log-Normal distribution were able to properly describe particle distribution of gelled crude oil, of which the former was slightly better than the latter in describing the particle size distribution.
The prediction model for the maximum particle size of gelled crude oil was presented at a 99.7% confidence level with relative error of less than 6%.
Conflict of Interests
The authors declare that there is no conflict of interests regarding the publication of this paper.
Footnotes
Acknowledgments
This work is supported by the National Natural Science Foundation of China (no. 51176024), New Century Talents Support Program of Heilongjiang Province (no. 1253-NECT-003), and the Natural Science Foundation of Heilongjiang Province (no. E201253). A very special acknowledgement is made to the editors and referees who have made important comments to improve this paper.