
Abstract
Battery packs are critical components to electric vehicles. They are designed to last for the designed life cycles. Temperature affects the performance and life span of batteries. Maintaining stable and evenly distributed temperatures within the operating temperature range among all modules and battery cells is one of key factors to prolong the life of battery packs. This paper studied the effects of the ventilation locations of the inlets and outlets and the gaps among battery cells on the rate of heat dissipation and temperature distribution in the pack. An existing battery pack was used as a baseline design. A computational fluid dynamics model was created to analyze the temperature distribution and air flow conditions. The design intent is to keep the package changes to the minimum but with better cooling efficiency. The results show that the locations and shapes of inlets and outlets have significant impact on the battery heat dissipation. A design is proposed to minimize the temperature variation among all battery cells. The temperature difference between highest and lowest ones for the evaluated event is reduced from 6.04°C to 3.67°C with 39% improvements, and the heat dissipation rate is improved with 3.8%.
1. Introduction
People have been paying great attention about global warming which is recognized as a result caused mainly by the emissions of greenhouse gases from fossil fuel combustion. To help in relieving the global warming and crude oil depletion, electric vehicles (EV) are considered to be the mainstream of the future transport vehicles. And battery/battery pack is one of the main power sources of EV. Battery pack as the main power source of EV is required to meet the high energy and power density, long cycle life, long lasting time, and so forth. Lithium-ion batteries are one of the ideal energy storage systems for the electric vehicles. Generally, the battery pack has a number of battery modules or cells in series and/or in parallel to achieve the desired voltage and capacity. For long distance travel, a vehicle would be equipped with a larger battery pack, and a large amount of heat thus is generated. A single cell overheats and failure can happen and degrade the performance of the entire pack; therefore a favorable ventilation system design can quickly take away the tremendous heat generated by the high power demand (hard acceleration, climbing, etc.) and can maintain the performance and reliability of the battery pack.
The common heat transfer types for the ventilation systems are air-cooling, liquid-cooling, phase change cooling, or any combination. Air cooling system has the advantages of simple structure, light weight, low cost, easy maintenance and repair, and no liquid leakage problems. It is suitable for electric vehicles [1]. With the increase of the elderly population in Taiwan, the design of the vehicle in response to the needs of elder person has gradually increased. Our research team has an intelligent mobile carrier project (Research Contract number NSC-99-2218-E-027-001) focusing on the need of short-haul travel of the elderly to create a smart, light-weighted, and powered by lithium-ion batteries, as shown in Figure 1.

Intelligent light weight vehicle for the elderly.
Several scholars have carried out some ventilation systems for battery packs. Pesaran associated with other scholars [2–6] explored the strengths and weaknesses of cooling systems of the battery pack. They also used heat transfer principles and finite element analysis (FEA) to predict the temperature distribution of cells in the pack. Based on the simulation results, the temperature increases 1.2°C in the series ventilation system with each additional line of cells. Finally, they focused on the problem of battery integration and indicated that not only should the battery pack maintain the maximum temperature of the pack below the allowed working-temperature limit but also it needs to maintain the temperature uniformity among the cells in the pack. The maximum temperature differences among modules for a small pack and for a large pack were suggested to be below 2°C∼3°C and 7°C∼8°C, respectively. Zolot et al. [7] studied battery pack designs for a hybrid electric vehicle (HEV), including the arrangement of the module and thermal path analysis of the battery packs, under three different temperatures (0°C, 25°C, and 40°C) and three different driving cycles (HWFET, FTP, and US06). The experimental results show that the case of maintaining the battery pack temperature at 25°C has the best thermal performance of battery pack for all three driving traffic cycles. Payne et al. [8] studied the thermal management system for the battery pack of plug-in hybrid electric vehicle (PHEV). They investigated different fin designs for the cells and the modules and also studied the effect of serpentine manifold on the pressure drops and the flow field characteristics of the pack. Ghosh et al. [9, 10] analyzed the heat transfer performance of the ventilation system for the HEV by using computational fluid dynamics (CFD) software, ANSYS-FLUENT. The aims of their studies were to maintain the cells under the working-temperature range and to keep the pack with uniformly distributed temperature. They also optimized the cooling path of the entire ventilation system to ensure that the battery pack had the most uniform temperature distribution under all operating conditions. Ma et al. [11] conducted a series of studies for commercially available lithium-ion battery packages of PHEV. They used the FEA software, ABAQUS, to evaluate the thermal performance of the 26650 Li-ion battery cells and used CFD software for flow field analysis to obtain the air temperatures around the cells in the pack and then mapped the air temperatures to the finite element model to analyze thermal characteristics of the battery pack. Results of analyses were compared with those from the experiments, and they showed a good correlation. Sun et al. [12] used the complex analysis method, which is combined with the 3D CFD model, the equivalent circuit model, FORTRAN codes, and other tools, to evaluate the thermal performance of the battery pack of an HEV. In order to achieve the minimum temperature difference among the cells, a set of design of experiments (DOE) was used to obtain an optimal design. Lin [13] used the CFD software, ANSYS-ICEPACK, to analyze the cooling effects of two different cell gaps on the lithium-ion batteries. The simulation results show that the bigger the cell gap is, the better the heat is dissipated. Sui et al. [14] used CFD software ANSYS-CFX to simulate the ventilation structure of a nickel-metal hydride (Ni-MH) battery pack of an HEV. According to the simulation results, the temperature field distribution of battery pack was improved with a ladder-pattern layout. Lin et al. [15] used the CFD software, ANSYS-ICEPAK, to analyze the heat transfer performance of battery module for an EV and to investigate the effects of the cell gap on the battery cooling. Fan et al. [16] utilized a high air flow rate to improve the temperature uniformity for an existing lithium-ion battery module of a PHEV. They used a commercial CFD code, ANSYS-FLUENT 12.0., for their analyses.
Most literatures studied either the effects of the gaps among cells on the thermal performance of the battery pack or the effect of the configurations of cooling air inlets/outlets of the ventilation systems on the heat dissipation of the battery pack. The study with both considered is hardly seen. In this present study, a typical and common design battery pack (similar to the one in the literature [13]) was used as the baseline design. We used a forced air cooling system and optimized the thermal performance of the battery pack considering the inlet locations and the shapes of the outlets. This paper aims to keep the maximum temperature of battery pack below the target value and to maintain the uniformity of temperature distribution. Uneven gaps among the battery cells were also considered in the study.
2. Heat Generation
The battery pack is one of the major heat sources of the EV. One must first understand the thermal behaviors of the cell or module in the pack. In this study, the heat produced from chemical reaction or mixing effects was ignored. The heat generation rate of one unit cell [17] is shown in

where q is the heat generation rate of one cell in units of W, I is the current in units of Amp, I > 0 for discharge and I < 0 for charge, E is the equilibrium voltage or open-circuit potential of the cell in units of V, U is the voltage or potential of the cell in units of V, T is the temperature in units of K, and dE/dT is the temperature coefficient in units of V/K. The first term on the right-hand side of (1), I(E − U), is the joule heating caused by the internal resistance of battery and can be rewritten in terms of the internal resistance R as qjoule = I2 × R. (E − U) is the overpotentials. The second term on the right-hand side of (1) is the reversible entropic heat, denoted by qentropy, which is due to the entropy changes from electrochemical reactions and can be positive or negative.
Due to very low activity of the electrolyte and small gap inside the battery, the internal convection effect of the battery can be ignored [20, 21]. The battery cell mainly consists of opaque substances with very little radiation; therefore the radiation effect is not considered. The internal heat transfer of the battery is mainly from the heat conduction. The energy balance in a unit cell can be written as

where ρ is the local density in units of kg/m3, C p is the local specific heat in units of J/(kg K), k x , k y , and k z are the local thermal conductivities in x, y, and z coordinates, respectively, in units of W/(m K), Q is the cell heat generation rate per volume in units of W/m3, T is the local cell temperature in units of K, and t is the time in units of s. The temperature distribution in the battery can be calculated using (2).
3. Modeling
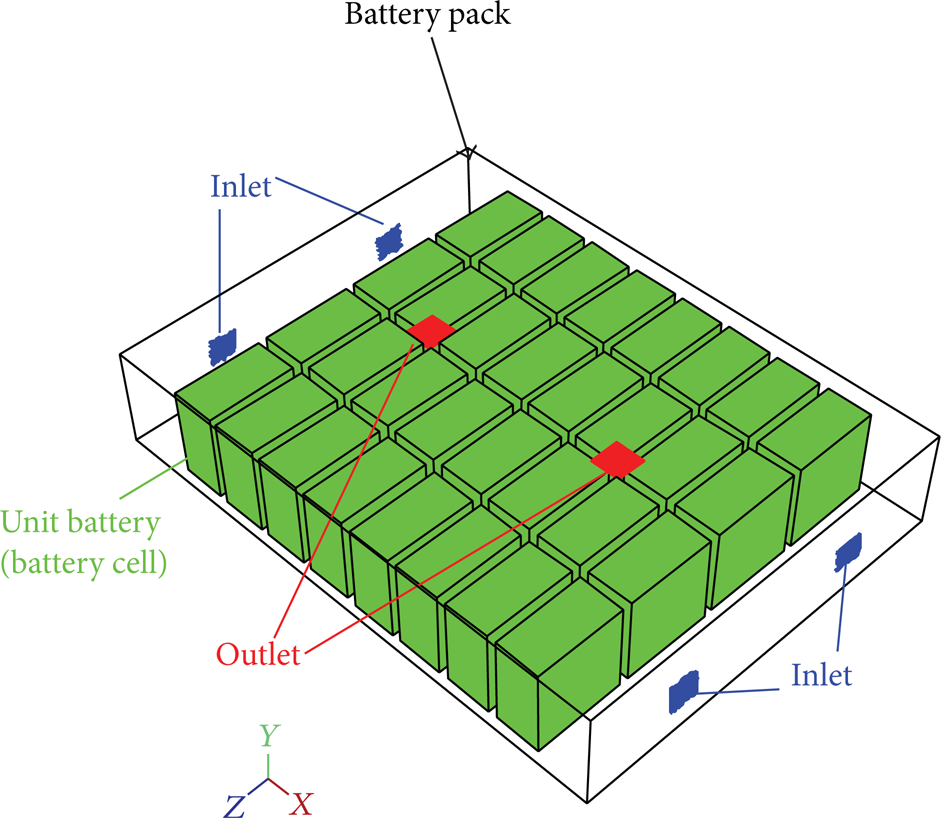
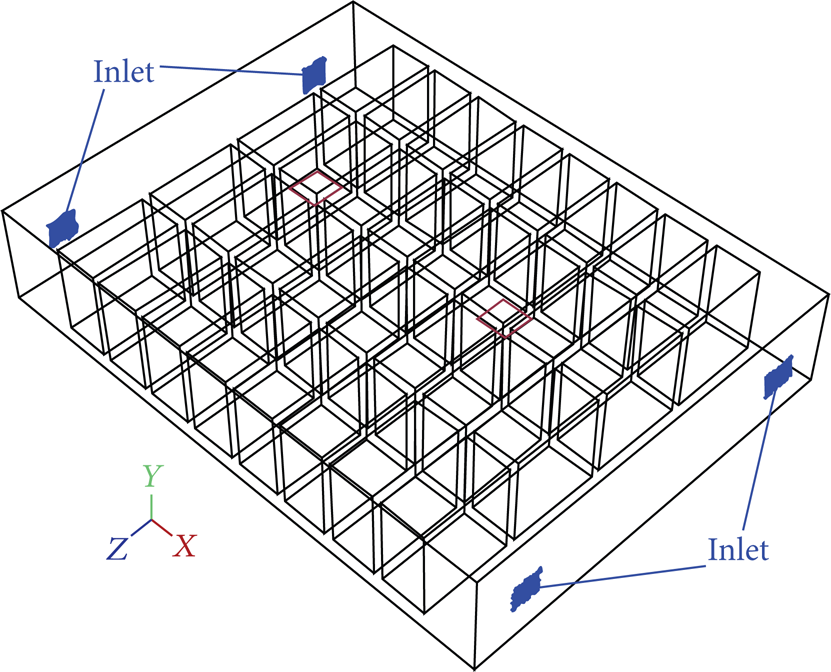
The heat transfer process of battery pack is a typical field-thermal coupling phenomenon. The heat is generated from the core transferring to housing while the cooling air passes the cell housing taking away the heat. There are thirty-two battery cells arranged in eight rows and four columns in the pack. The gap among cells is 15 mm apart. Two inlets are located at the front and back of the pack and two outlets are at the top of the pack. Each has the dimension of 50 mm × 50 mm. The inlets are aligned with the center of gap 2 and gap 4, as shown in Figure 2. Aluminum alloy is used for the pack case with a thickness of 3 mm. The analysis model includes the unit cell, battery pack, and ventilation system. Each part is described in the following sections.
Baseline battery pack.
3.1. Unit Cell
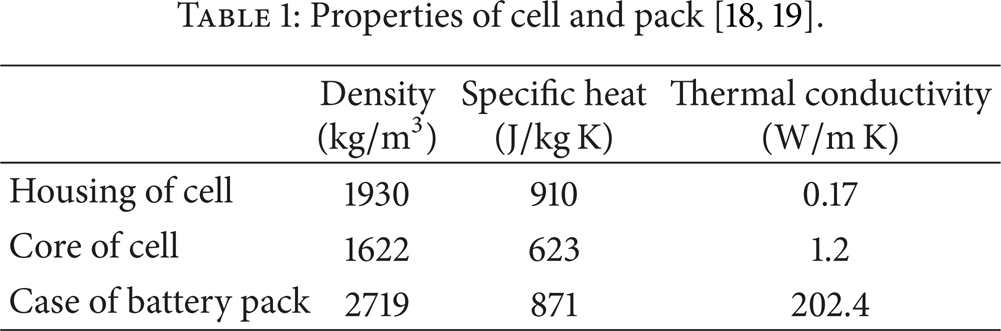
In the present study, we focus on exploring the temperature distribution of the entire pack. A lump battery system is used. The battery cell is modeled with a single core and a thermal stability plastic housing [18]. The cell is in rectangular parallelepiped shape with dimensions of 75 mm (length) × 150 mm (width) × 150 mm (height). The housing material of cell is 3 mm thick heat resistance plastic. The heat generation rate of a unit cell is assumed to be 12.8 W. The detailed properties used for the analysis are summarized in Table 1. The mesh size for cells is 5 mm × 5 mm × 5 mm. All cells use structure meshes, hexahedral elements, as shown in Figure 3. A total of 432,000 grids are created for the thirty-two cells.

Meshes for cell.
3.2. Battery Pack and Ventilation System Type
The entire battery pack of thirty-two cells is arranged in a pattern of eight rows and four columns. The gap among the cells can affect the heat dissipation of the battery pack. In this research, the gap of 15 mm was used in the baseline design. The battery pack case is made of aluminum alloy with a thickness of 3 mm. In order to install four fans at both ends of the case, four opening holes of 50 mm × 50 mm face directly to gap 2 and gap 4 and two outlets are located on the top of battery pack.
The heat conduction formula of the ventilation system of battery pack [3] can be described as follows:

where N is the number of rows in the ventilation path, q is the cell heat generation rate in units of W, M b is the cell mass in units of kg, C b is the weighted-average heat capacity of the cell in units of J/(kg K), T ba is the average cell temperature in units of K, Tin is the incoming fluid temperature to the cell in units of K, Tout is the temperature of the fluid leaving the cell in units of K, m f is the mass flow rate of fluid in units of kg/s, C f is the fluid specific heat in units of J/(kg K), M f is the mass of fluid in units of kg, T f is the surrounding fluid temperature in units of K, and t is the time in units of s. The second terms of left-hand side and right-hand side of (3) are the thermal inertia of cell and of fluid, respectively. For the steady state condition, these two terms are zero.
The inlets and outlets of the cooling system in a traditional series ventilation system are placed in the same direction, as shown in Figure 4. The cooling air passes the first row of cells and then the second row and sequentially flows through the rest to the last row and exits. The cooling air enters from the inlets, encountering the cells at the first row, absorbing the heat generated from the cells, and continuously flowing through the gaps among cells till the last row. Since the air flows through the whole pack in sequence, the temperature of the air gets higher, and the capability of carrying heat/transferring heat gets lower. The cell temperature in the second row is higher than that in the first row, and so forth. However, the end row of the cells is closer to the outlets and easier to get cool; it has lower temperature than the row before it instead.

Series ventilation system.
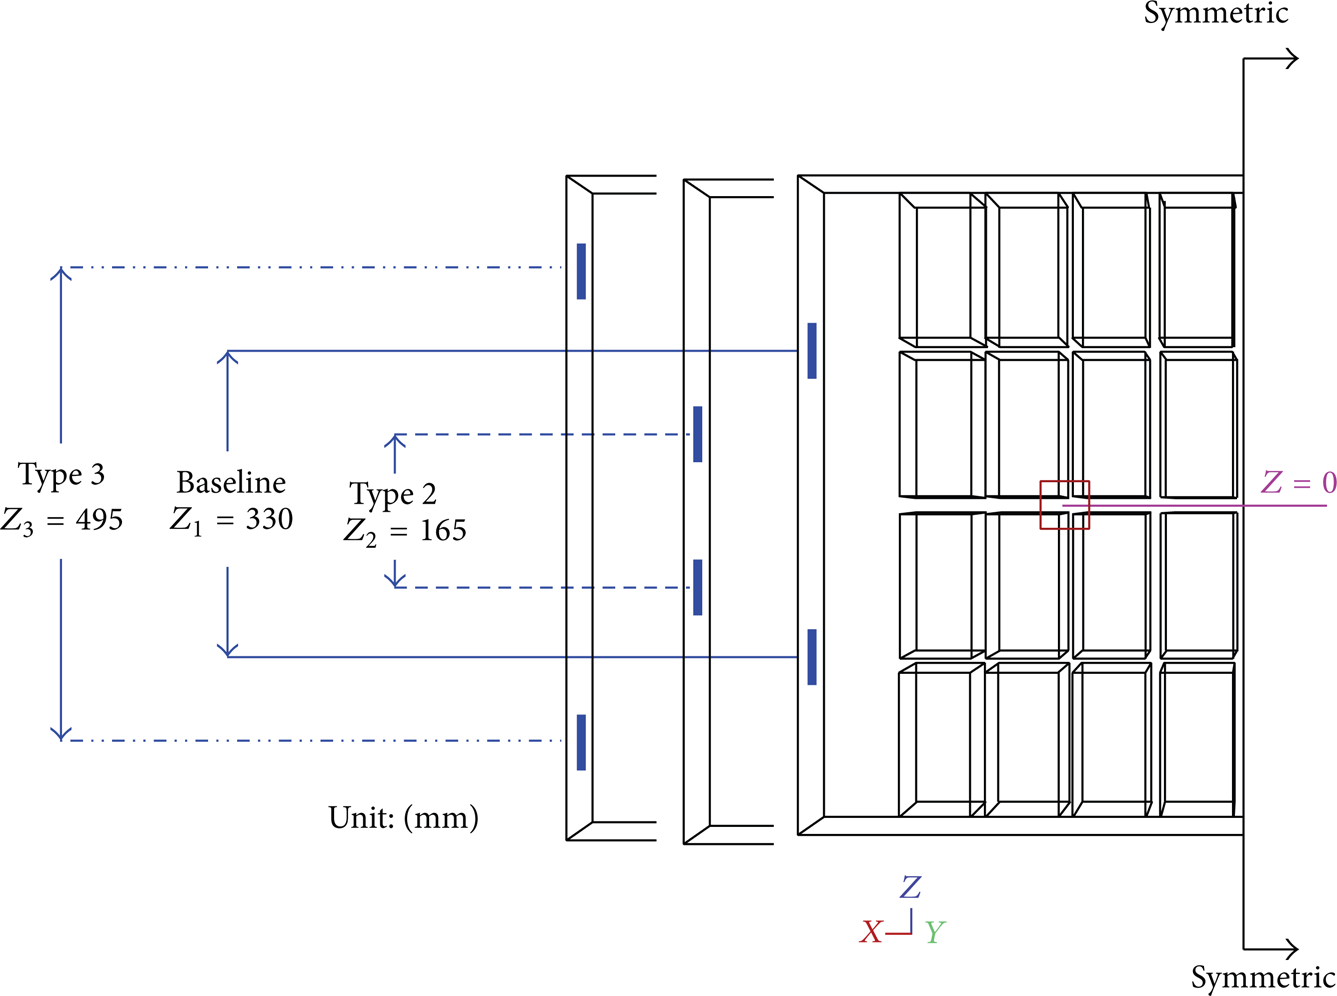
The traditional series ventilation systems generally have large temperature differences among the cells. This present study used a semiseries ventilation system to improve the condition. There are thirty-two battery cells in the pack. The cooling air enters from the inlets located at two ends of the battery pack and exits through the outlets on the top of the battery pack. The detailed configuration and dimension of the battery pack are shown in Figure 5. The detailed material properties are shown in Table 1.

The configuration and dimensions of semiseries ventilation system, baseline design.
3.3. Computational Fluid Dynamics (CFD) Model
In order to maintain the uniformity of the mesh size, the element length of the fluid and structure must be consistent. In this study, we used CFD preprocessing software, GAMBIT. The mesh size of 5 mm is selected for the entire pack. All of cells used structure mesh, hexahedral elements, with a total of 432,000 grids from the thirty-two cells. The internal flow field of the pack used nonstructure mesh, tetrahedral elements, with grid numbers around two million. At least three or more layers were used among the cells, as shown in Figure 6.

The unstructured gird mesh for internal field flow and the air gap of the battery pack.
To simplify the model and save computation time, the following assumptions were made in this study.
The fluid in the pack is air with Reynolds number (Re) of 23058, and the flow field associated is turbulent flow.
The boundary condition for inlets is given intake fan, and for outlets is selected pressure outlet. The performance curve of intake fan is shown in Figure 7.
No-slip boundary condition between the fluid and the surface of cell is complied.
The room temperature is applied on the inlets as 300 K (approximate 27°C) and a pressure of one atmosphere.
In order to understand heat transfer characteristics of the proposed heat dissipation in the cruise mode, the steady-state flow field analysis was chosen.
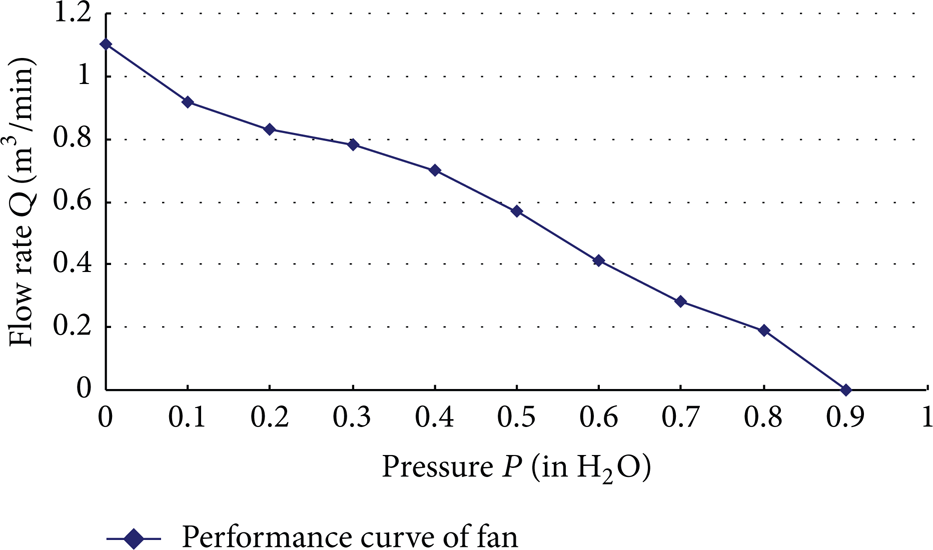
The performance curve of intake fan.
For the numerical simulation, the commercial CFD software package, ANSYS-FLUENT 12.0, was utilized. The convergence criterion was set such that the residual value of governing equations for the momentum equation is below 1 × 10⁻⁵, for continuity equation is below 1 × 10⁻⁵, and for the energy equation is below 1 × 10⁻⁷. For the turbulence flow field problem, the standard k-∊ turbulence model was used. The residual value of turbulent kinetic energy k and dissipation rate ∊ are set 1 × 10⁻⁵ in the simulation. If the above conditions cannot be reached, a maximum number of iterations of 2000 times are set for termination of operation.
4. Baseline Design Simulation
Figure 8 shows a temperature distribution in the battery pack of the semiseries ventilation system. Figure 8(a) shows that the maximum temperature is 43.96°C at the surface of cell while the maximum temperature of the entire pack is 46.98°C occurring in the core within cell, as shown in Figure 8(b). The maximum temperature difference ΔT max between the surface and core of the cell is 3.02°C (Table 21).
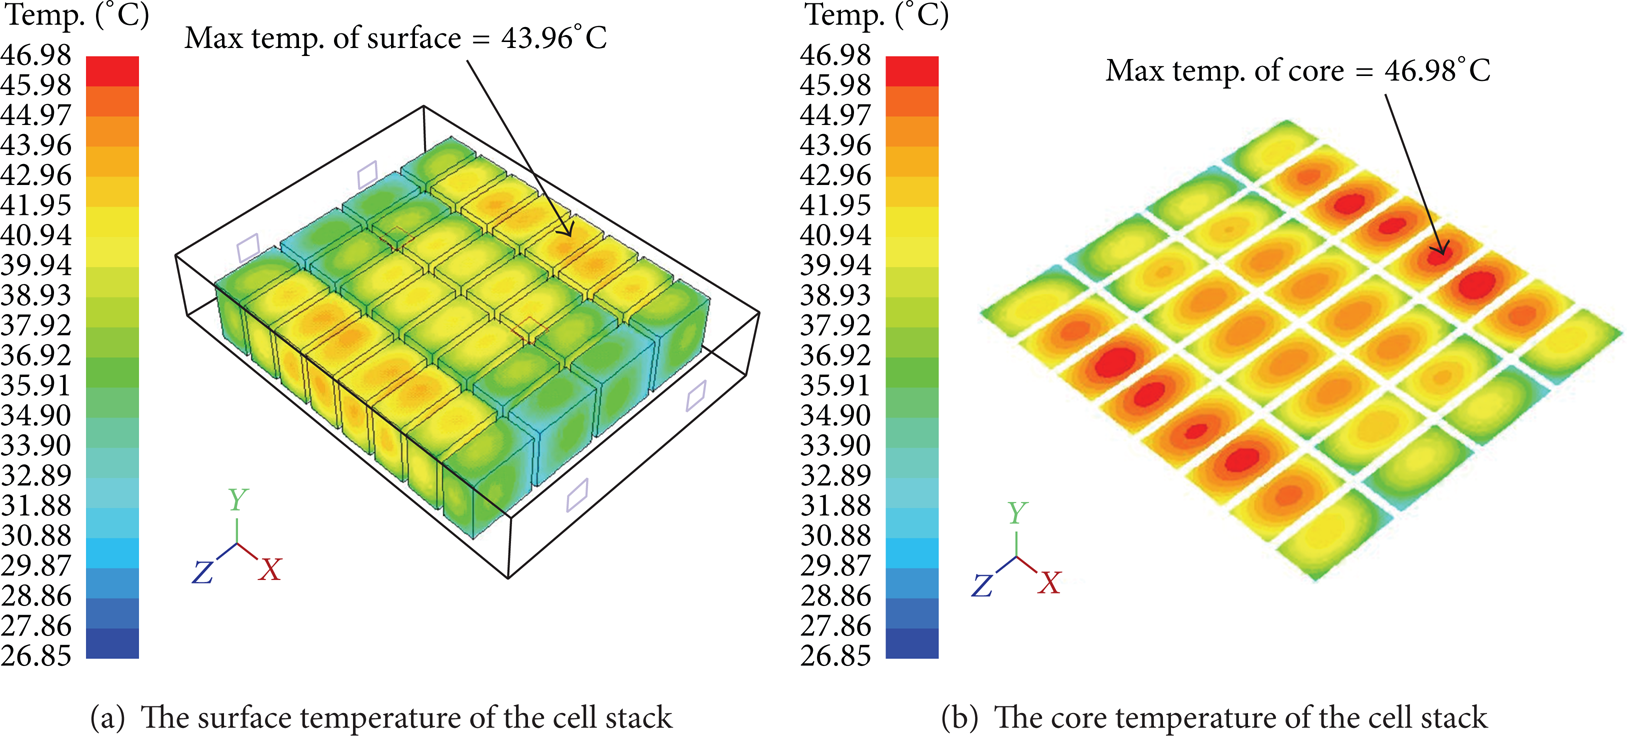
The simulation results of baseline design.
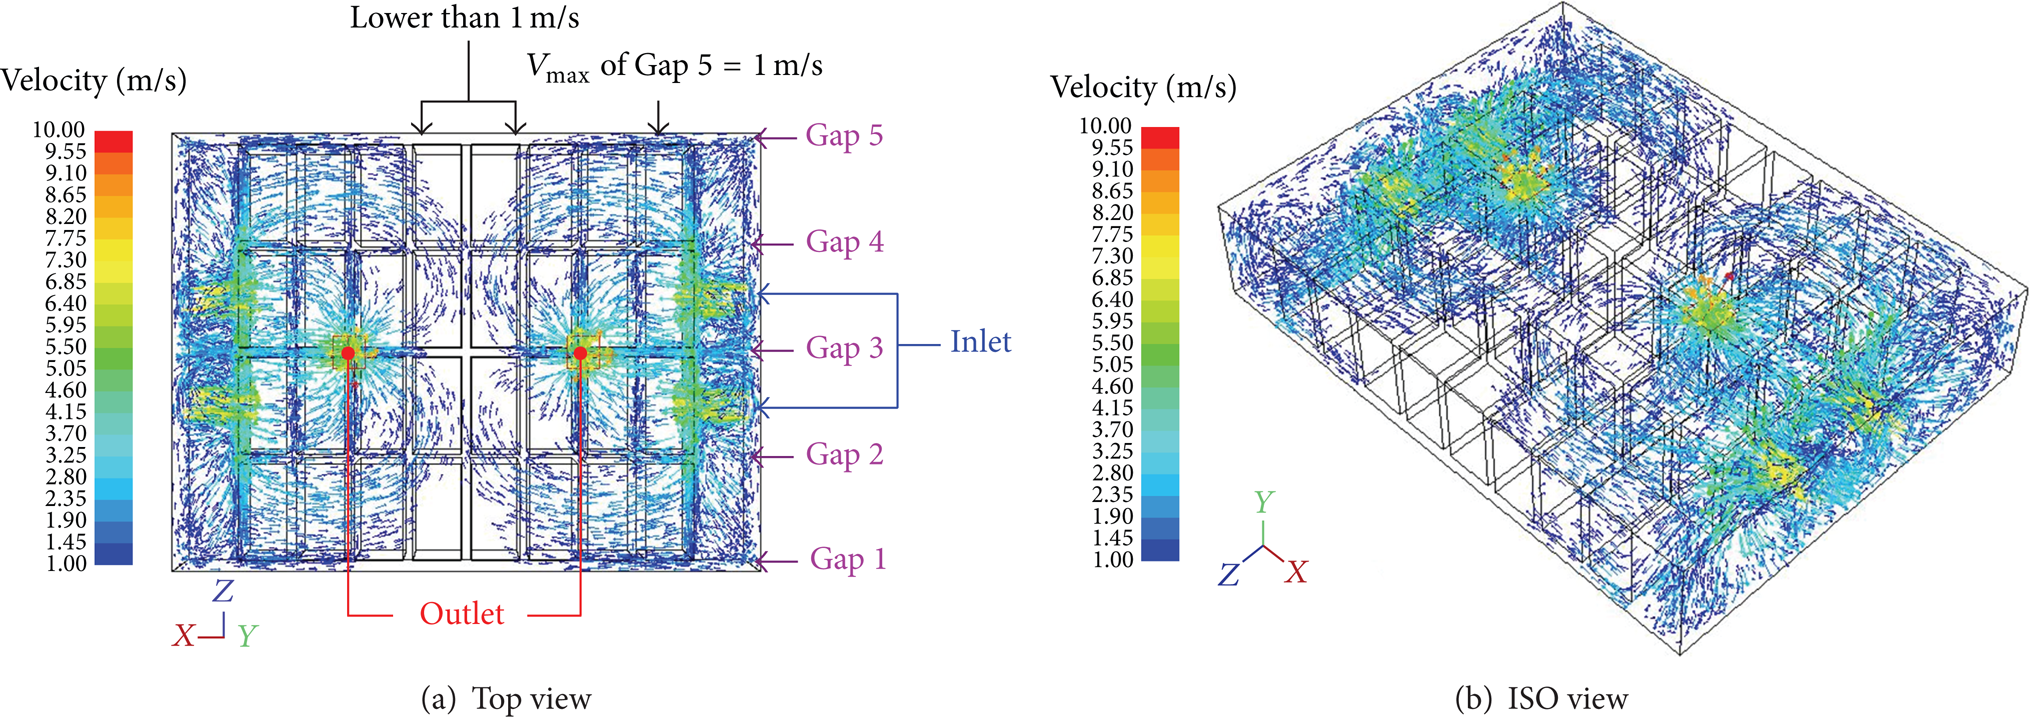
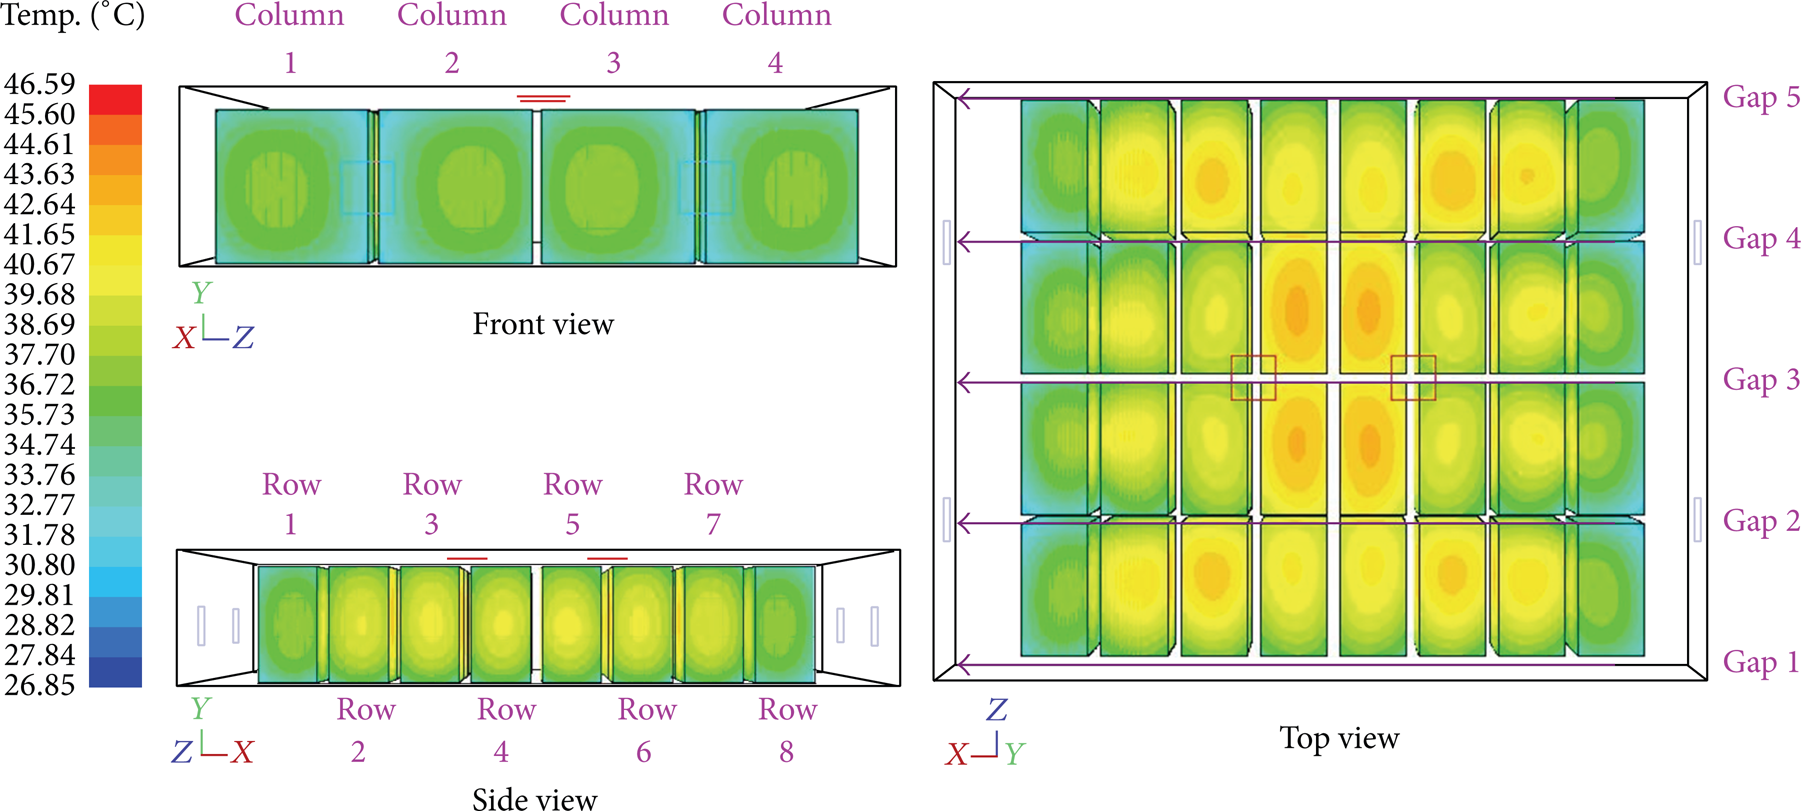
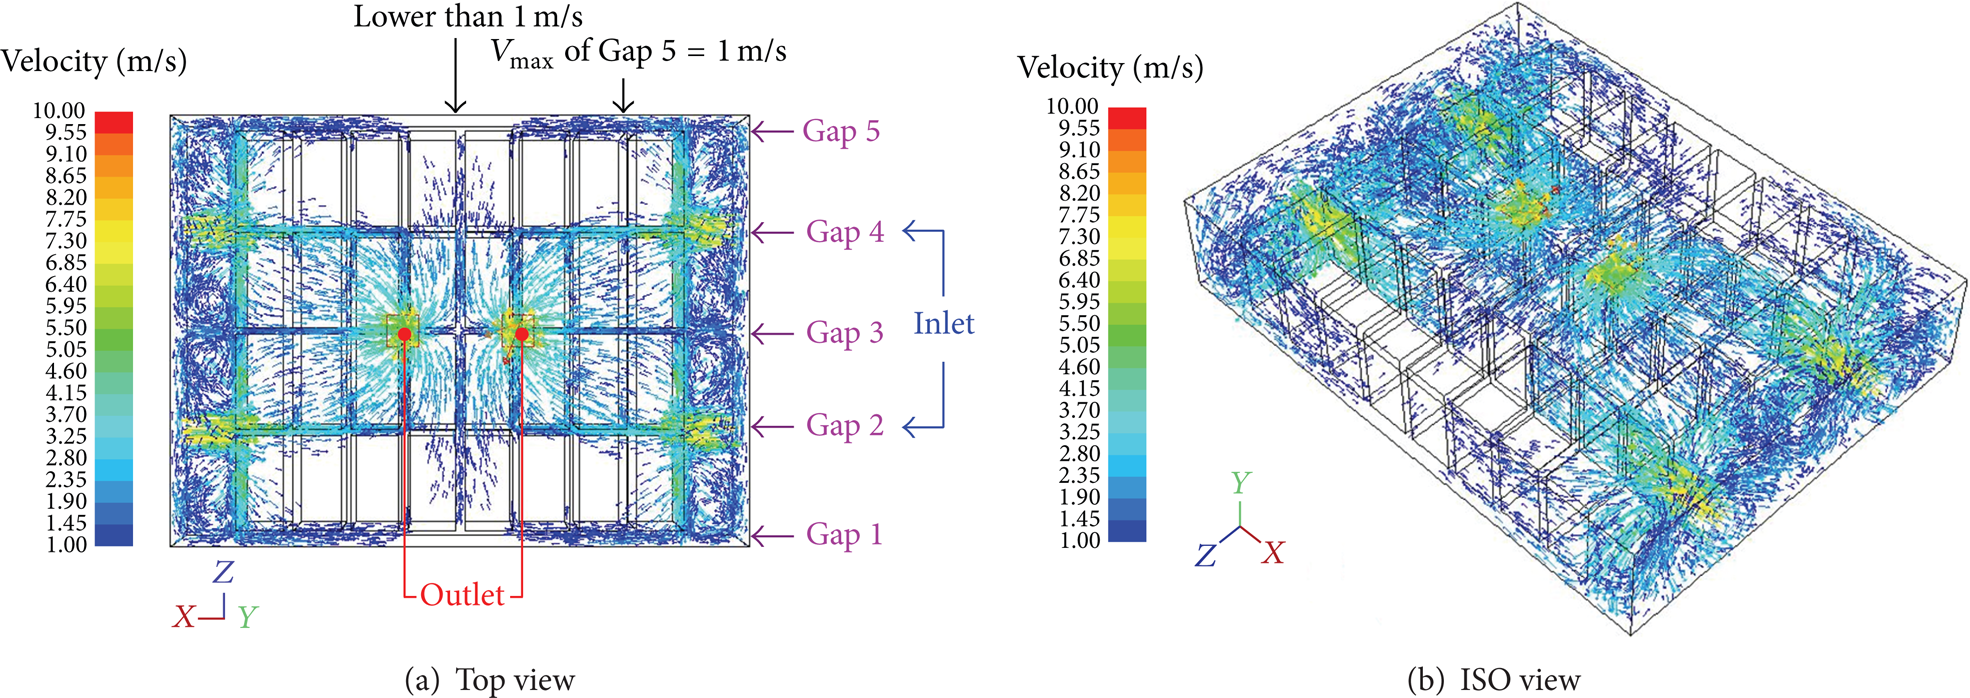
Figure 9 shows that cell temperatures at both ends (Row 1 and Row 8) of the pack are lower, which is due to the fact that those cells are close to the inlet of cooling air. However, the cells among Column 1 and Column 4 inside the pack have higher average temperatures. The velocity of the cooling air inside the pack is shown in Figure 10; the faster velocity is about 6.32 m/s occurring in Gap 2 and Gap 4, and the velocity of cooling air at Gap 1 and Gap 5 is mostly below 1 m/s (blank portion of pack in the Figure 10), respectively.

The orthographic view of temperature distribution in the pack (baseline design).

Flow velocity of cooling air in the pack (baseline design).
The maximum temperature of each cell in the pack is drawn into a bar chart, as shown in Figure 11. The cell temperatures within the pack are symmetrically distributed and detailed data which can be found in Table 2. The battery cells in Row 1 and Row 8 have low temperature due to the position close to the intake fan, and temperature of cells among the middle two columns (Column 2 and Column 3) is lower than the lateral cells due to the fact that the cooling air inlets are facing Gap 2 and Gap 4. The air outlets of pack are located at Gap 3 which is above the battery cell and its resistance is relatively small; most of the cooling air flows through this path and takes away the heat generation form cells. Only a small amount of the cooling air flows through the outermost gaps, Gaps 1 and 5, and at the rates lower than 1 m/s. The cooling effect is limited, therefore, the outer battery cells in Column 1 and Column 4 have higher temperatures, as shown in Figure 9 (side view).
The maximum temperature of each battery cell of baseline design (Unit: °C).


The maximum temperature distribution in the pack (baseline design).
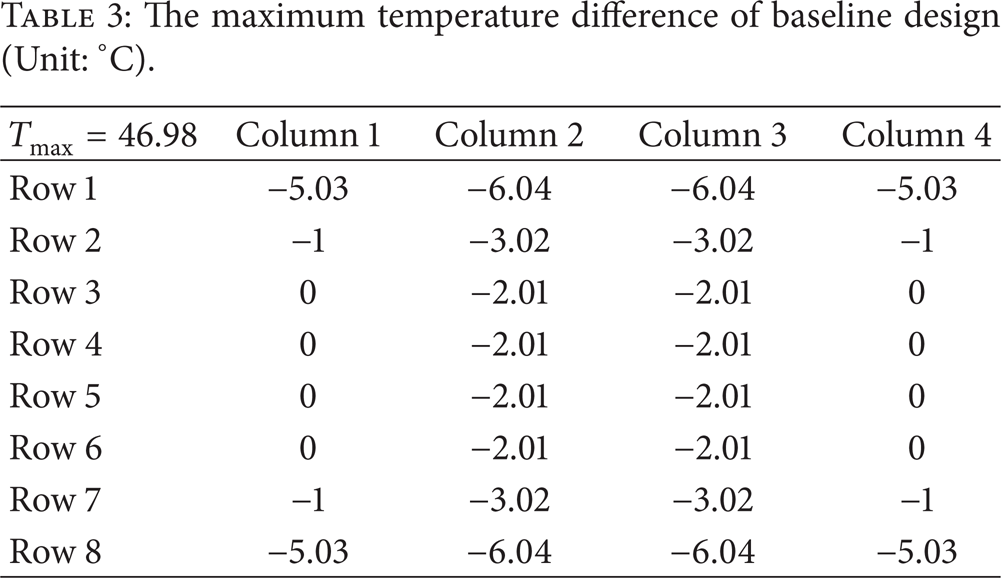
The uniform of the temperature distribution is one of the important factors that affected the performance and the reliability of the battery pack. In this study, the highest cell temperature in the pack minus the temperature of each cell (T max − Tcell) was used to represent the uniform of the temperature distribution; the detailed data can be found in Table 3. The maximum temperature difference in the baseline design is −6.04°C (negative sign indicates that the temperature is below the maximum temperature); B21, B28, B31, and B38 exceed the recommended value of 5°C in the literature (BColumn # Row # is the battery cell ID used in the column-row of the pack; that is, B21 is the battery cell in the second column and the first row). The higher battery cell temperature will eventually lead to the performance of the entire pack decreases. Therefore, the next chapter will be a series of optimized designs to find the ideal location and shape of cooling air inlet and outlet and the appropriate size of the cooling channel.
The maximum temperature difference of baseline design (Unit: °C).
5. Design Optimization
The Optimum Design of this study was defined as the total size of the whole pack structure and the total air flow rate of the intake fan remains unchanged; that is, the number of air inlet and the dimension of inlet are fixed. Under these constraints, the optimization is to find the ideal locations of the inlets and outlets, as well as the gaps between battery cells.
5.1. Optimum Design for the Inlet Location
In order to improve the uneven temperature distribution, the first step was adjusting the inlet from the basic position while the outlet position remains unchanged. Type 2 was adjusting the intake fans position toward the middle faced Column 2 and Column 3, as shown in Figure 12. Type 3 was adjusting the basic position outwards faced Column 1 and Column 4, as shown in Figure 13. Two types of the new design and the baseline design with associated positions are shown in Figure 14. The simulation assumptions of Type 2 and Type 3 are the same as in the baseline design.

Cooling air inlet layout of Type 2.
Cooling air inlet layout of Type 3.
The three designs of inlet placement.
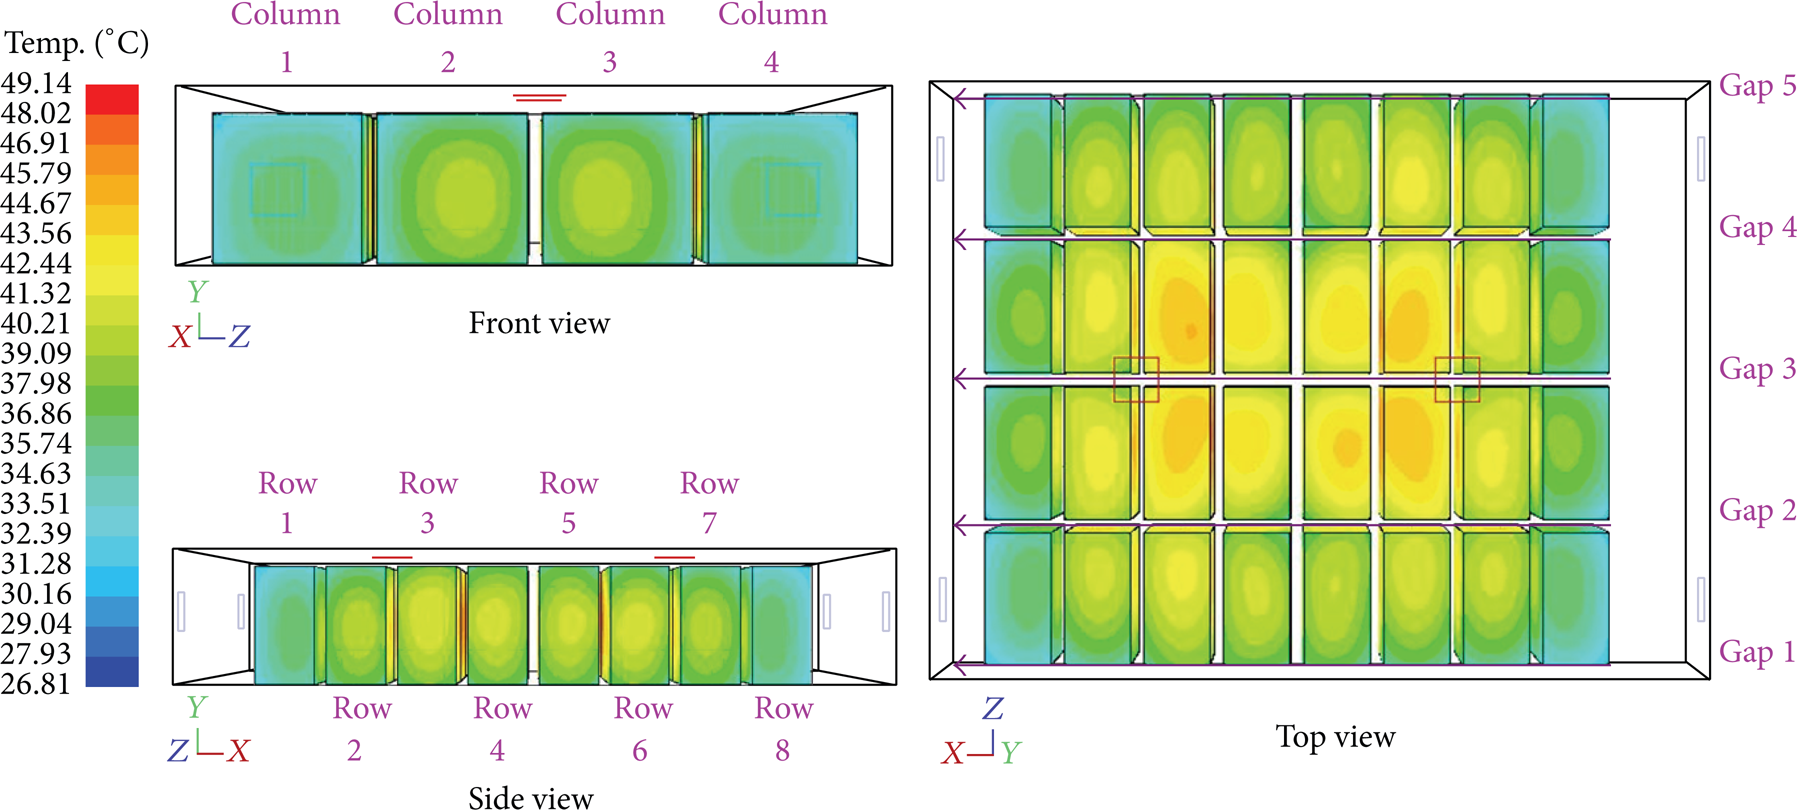
Type 2 simulation results are as shown in Figure 15. The maximum cell surface temperature is 46.27°C, and the maximum internal temperature of the cell is 49.7°C. The temperature difference is 3.43°C between the surface and the core. The front view of Figure 16 which shows that the four cells (B21, B28, B31, and B38) faced the inlet was the coldest cells (surface temperature of 35.99°C) inside the pack. The observation of velocity diagram in Type 2 (Figure 17) shows that the cooling air with higher flow rates (6.37 m/s) met B21, B28, B31, and B38 and exhausted upwards toward the outlet directly, causing the other cells to have slower cooling air, especially the four cells situated in the center position of the entire module (B24, B25, B34, and B35), which only received a flow rate below 1 m/s causing a result of an uneasy heat dissipation.

The simulation results of Type 2.

The orthographic view of temperature distribution in the pack (Type 2).
Flow velocity of cooling air in the pack (Type 2).
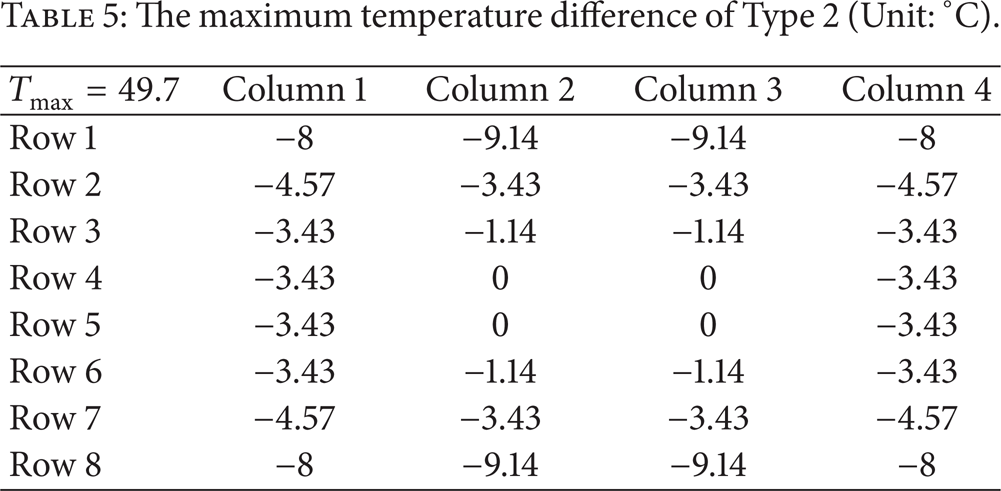
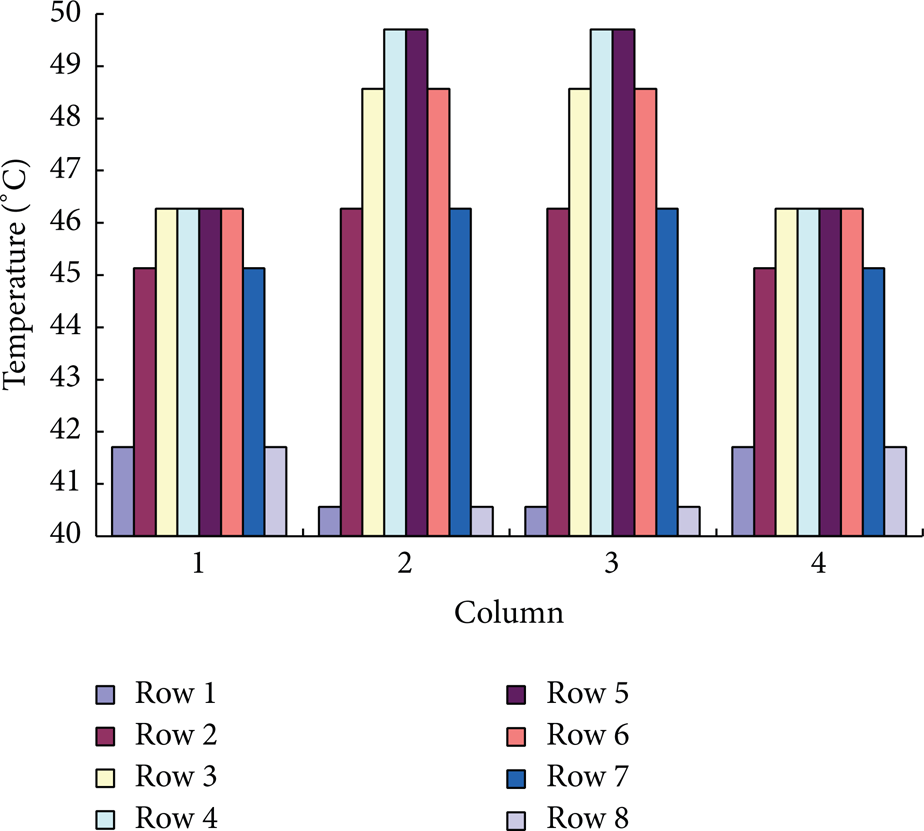
The maximum temperature (occurring at the core) of each cell in Type 2 is drawn, as shown in Figure 18. The cell temperature is rendered to be a symmetrical distribution; the detailed data can be observed in Table 4. In spite of the air inlet facing cells of Column 2 and Column 3, the cooling air entered the pack and met B21, B28, B31, and B38 and flew to the top outlet where the resistance is relatively low, causing these two columns to have higher cell temperature than Column 1 and Column 4. The maximum temperature differences inside the pack are shown in Table 5. The maximum temperature difference of −9.14°C occurred in B21, B28, B31, and B38, and Row 1 and Row 8 have maximum temperature differences much higher than other rows. The result shows that Type 2 design causes an extremely uneven temperature distribution.
The maximum temperature of each battery cell of Type 2 (Unit: °C).

The maximum temperature difference of Type 2 (Unit: °C).
The maximum temperature distribution in the pack (Type 2).
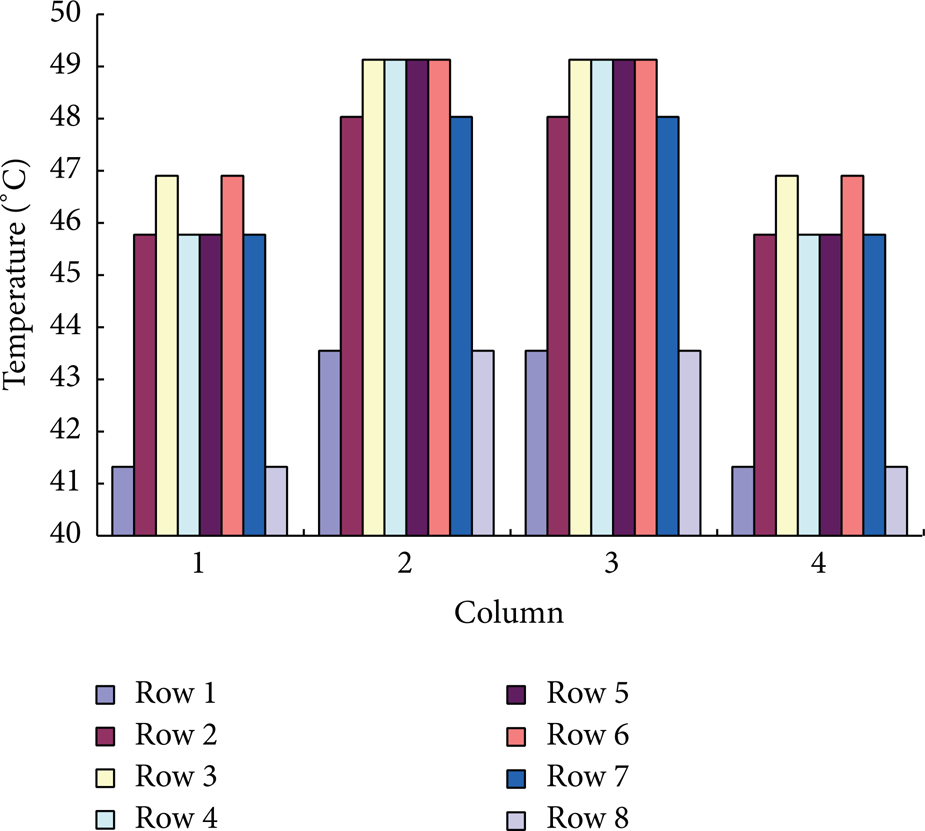
The simulation results of Type 3 are shown in Figure 19. The figure shows that the maximum temperature at the cell surface is 45.79°C. The maximum temperature at the core is 49.14°C, which occurs in eight cells of Column 2 (B23, B24, B25, and B26) and Column 3 (B33, B34, B35, and B36). The maximum temperature difference between surface and core is 3.35°C. An orthographic view of the cell temperature distribution in Type 3 is shown in Figure 20; the coldest surface temperatures of four cells facing the inlet (B11, B18, B41, and B48) are 35.74°C. The velocity chart of Type 3 (Figures 21 and 22) shows that the higher flow velocity (6.51 m/s) of the cooling air met B11, B18, B41, and B48 and flew to the two outlets above Gap 3; the blank portion in the figure shows that the cooling air flow rate is below 1 m/s, and the eight cells located at Column 2 (B23, B24, B25, and B26) and Column 3 (B33, B34, B35, and B36) from the center of the module are only assigned to a slower flow of the cooling air, forming heat concentration in the pack. The maximum temperatures of core of each cell within the pack are shown in Figure 21, the cell temperatures are symmetrically distributed, and the detailed data can be found in Table 6. Table 7 shows that the maximum temperature difference of the core is −7.82°C occurring at the four cells (B11, B18, B41, and B48) facing the inlet of cooling air.
The maximum temperature of each battery cell of Type 3 (Unit: °C).

The maximum temperature difference of Type 3 (Unit: °C).


The simulation results of Type 3.
The orthographic view of temperature distribution in the pack (Type 3).

Flow velocity of cooling air in the pack (Type 3).
The maximum temperature distribution in the pack (Type 3).
According to the simulation results of baseline design, Type 2 and Type 3, the baseline design is to adjust the position of intake fan facing the cooling channels (Gap 2 and Gap 4), allowing the cooling air flow into the pack, and effectively reduced the maximum temperature of the battery pack and minimized the temperature difference between the cell surface and the core (3.02°C). The detailed data were shown in Table 8. Comparing the velocity figures of three designs (Figures 10, 17, and 21), one can obtained that most of the cooling air flow rates are below 1 m/s in the baseline design compared to Type 2 and Type 3, but the flow has the highest air flow rates in the gap and it is surrounded by more cells, which can take away the heat effectively; therefore, the baseline design has the lowest value in maximum temperature difference among these three designs as well as the most uniform temperature distribution in the pack. In the next phase of optimization, the study will select the inlet fan placement of the baseline design with several outlet types; identify the best outlet design of the semitandem ventilation system.
The maximum temperature difference between surface and core of cell in three inlet designs (Unit: °C).

5.2. Optimum Design for the Outlet Location
The cooling mode of proposed semiseries ventilation system is similar to the series ventilation system. The four fans located at the front and rear of battery pack forced the cooling air to flow into the pack and exhaust through the outlet on the top of the pack. As from Section 5.1, the simulation results analysis shows that when the cooling air flows into the gaps between cells, it has a better cooling effect; hence the new design concept will fix the inlet position on both sides of the pack facing Gap 2 and Gap 4 and adjust the outlet position to achieve an optimized design. First of all, the location of the outlet openings will still be allocated at the middle gap (Gap 3) of the pack. The design concept of Type 4 is to adjust the outlet position of the baseline design towards the center. Type 5 is directly merging the two outlet positions to the center of the pack, as a single opening is formed. Considering the outlet area should be the same as baseline design and other designs; therefore the total area of the single outlet in Type 5 is equal to the duel-outlets of the baseline design (5000 mm2). Type 4, Type 5, and baseline design with corresponding positions are shown in Figure 23; the CFD simulation setting aspects are the same as the baseline design.

The corresponding position and dimensions of Type 4, Type 5, and baseline design.
The simulation results of Type 4 are shown in Figure 23; it shows that the maximum temperature is 46.71°C occurring in the core portion, and the surface temperature is 43.73°C (Figure 24). The temperature distribution presents a symmetrical distribution; the detailed data is shown in Table 9. Comparing the orthographic view of Type 4 temperature distribution (Figure 25), the velocity of cooling air (Figure 26) and the maximum core temperature (Figure 27), not only the cells from the head and rear rows (Row 1 and Row 8), are closer to the cooling air inlet; thus not only the temperature is lower, but also the heat is concentrated in the twelve cells (B12∼B17 and B42∼B47), resulting in the fact that the cooling air flow rates from above Column 1 and Column 4 and from Gap 1 and Gap 5 are lower than 1 m/s. As to Column 2 and Column 3, the cell temperature is relatively low, because the outlet position is allocated at the gap between the two columns; the cooling air flow to the outlet has less resistance and higher flow rate, which can easily exhaust the heat from the cells. Table 10 shows that the maximum cell temperature difference is −4.96°C; it shows that outlet design of Type 4 can effectively improve the uniformity of the temperature difference.
The maximum temperature of each battery cell of Type 4 (Unit: °C).

The maximum temperature difference of Type 4 (Unit: °C).


The simulation results of Type 4.

The orthographic view of temperature distribution in the pack (Type 4).

Flow velocity of cooling air in the pack (Type 4).

The maximum temperature distribution in the pack (Type 4).
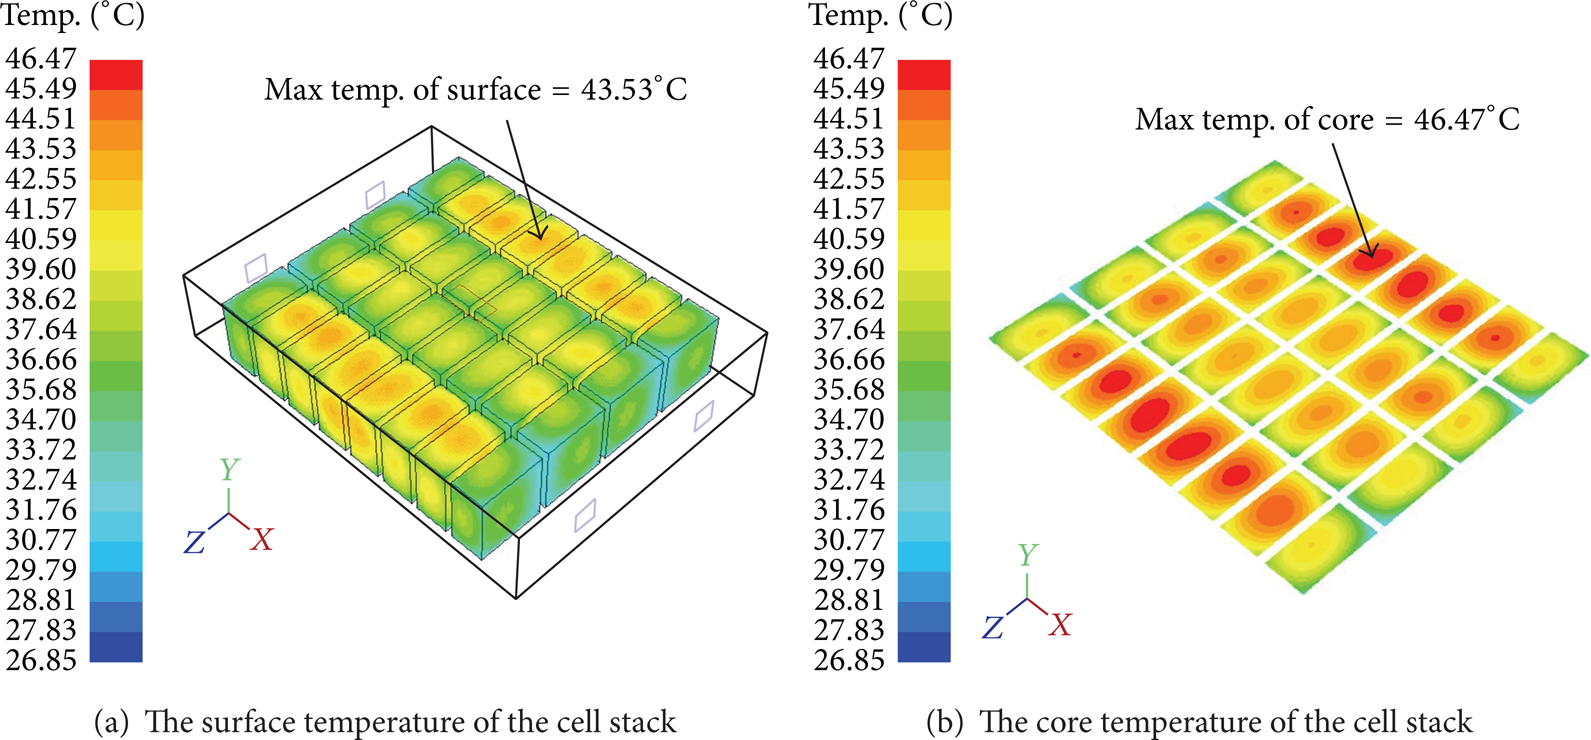
Figure 28 shows the simulation results of Type 5; the core temperature and surface temperature are 46.47°C and 43.53°C, respectively. The cells temperature presents a symmetrical distribution; the detailed data is shown in Table 11. From the orthographic view of the temperature distribution inside the pack of Type 5 (Figure 29), velocity of cooling air flow (Figure 30), and the maximum core temperature (Figure 31), one can obtain that single outlet design can effectively reduce the cooling air flow resistance, increasing flow rates, and hence exhausting more heat. The maximum temperature differences of each cell are shown in Table 12, the maximum temperature difference is −3.92°C (lower than the literature suggested value).
The maximum temperature of each battery cell of Type 5 (Unit: °C).

The maximum temperature difference of Type 5 (Unit: °C).

The simulation results of Type 5.

The orthographic view of temperature distribution in the pack (Type 5).

Flow velocity of cooling air in the pack (Type 5).

The maximum temperature distribution in the pack (Type 5).
By the above analyses, one can understand that when the inlet position is fixed and the outlet position adjusts to the middle of the pack, this reduces not only the maximum temperature of the cell but also controls the maximum temperature difference below the expected value effectively. It can also reduce the cell temperature difference between the surface and the core, from the baseline design of 3.02°C reduced to 2.94°C; the detailed data is shown in Table 13.
The maximum temperature difference between surface and core of cell in three outlet designs (Unit: °C).

5.3. The Optimum Design for Gaps among Cells
From the previous analysis, the results show that when the cooling air inlet is allocated facing Gap 2 and Gap 4, numerous cooling air with high flow rates will traverse from these two gaps to the outlet above Gap 3, exhausting the heat from the cells; whereas the cooling air with slower flow rates will flow through the outermost cooling paths (Gap 1 and Gap 5) in the pack, resulting in the temperature of the outermost two rows of the pack being higher, creating an uneven temperature distribution for the entire pack. Therefore, the final design concept is to adjust the three gaps between the cells in the middle of the pack (Gap 2, Gap 3, and Gap 4) from an initial 15 mm to 10 mm (based on [22] for recommended minimum value for cooling channel), enlarging the outermost gaps (Gap 1 and Gap 5) from 15 mm to 22.5 mm. It is expected to allow more cooling air pass through Column 1 and Column 4 and exhaust the heat of cells. Optimum Design I, II and III have the cell gaps listed above with baseline inlet position but each has baseline, Type 4, and Type 5 outlet positions, respectively. The detailed configuration is shown in Table 14 and Figure 32. The simulation assumptions and parameters settings are equivalent to the baseline design.
Details of three optimum designs.


The corresponding position and dimensions of Optimum Designs I, II, and III.
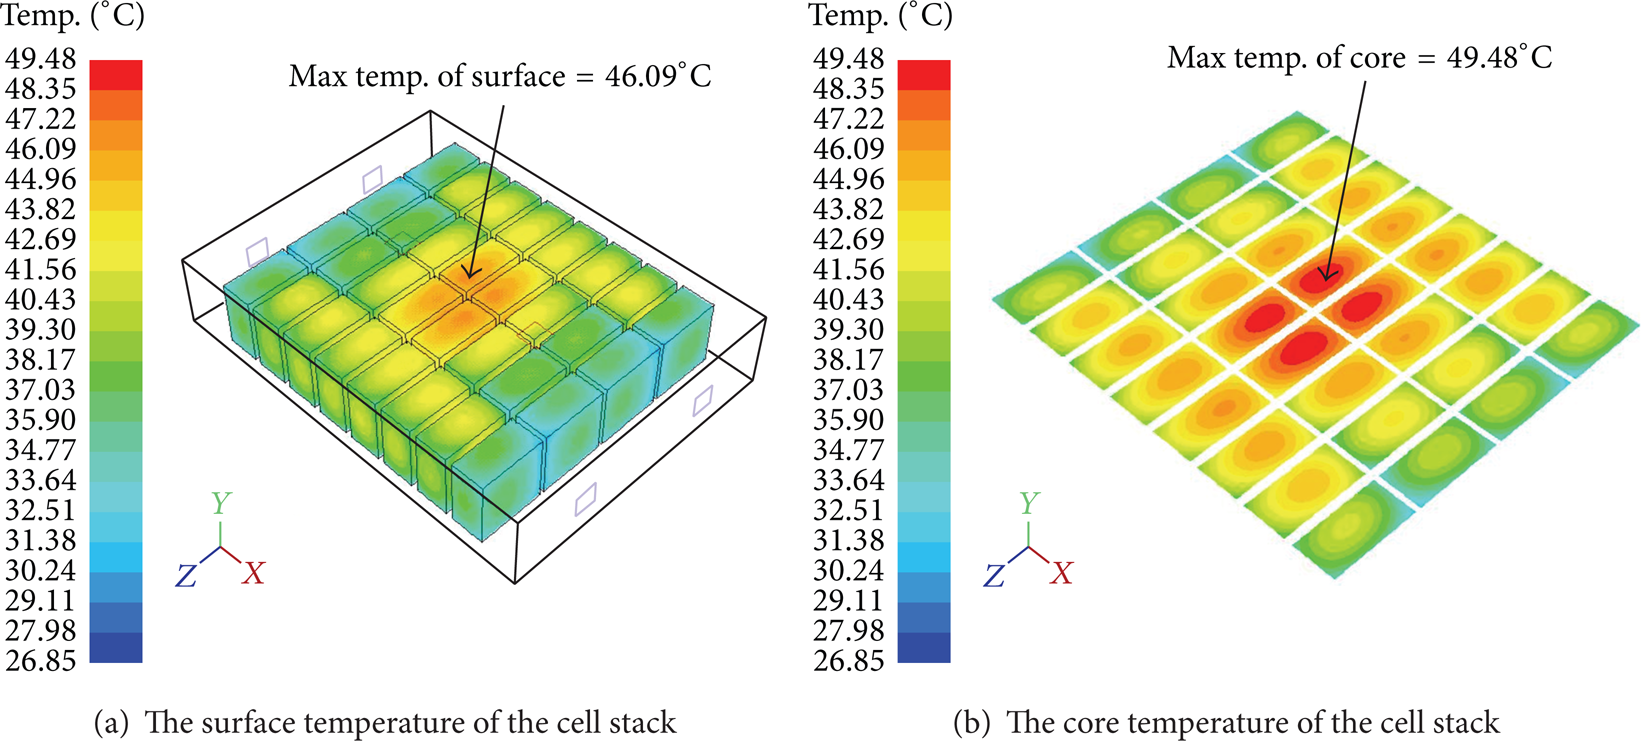
Figure 33 shows the simulation results of Optimum Design I; the maximum surface temperature is 46.09°C and the maximum core temperature is 49.48°C, both occurring in the four cells of Column 2 (B24 and B25) and Column 3 (B34 and B35). By comparing the orthographic view of the temperature distribution in Optimum Design I (Figure 34), the flow rates of the cooling air (Figure 35), and the maximum temperature distribution of each cell in the pack (Figure 36), the cell temperature presents a symmetrical distribution. The detailed data is shown in Table 15. One can obtain that increasing the size of Gap 1 and Gap 5 to increase the air flow and velocity can decrease the cell temperature of Column 1 and Column 4. But because the gap size of Gap 2, Gap 3, and Gap 4 becomes narrower, increasing the flow resistance of the cooling air, the cooling air cannot reach B24, B25, B34, and B35, and finally the heat cannot be exhausted.
The maximum temperature of each battery cell of Optimum Design I (Unit: °C).

The simulation results of Optimum Design I.

The orthographic view of temperature distribution in the pack (Optimum Design I).

Flow velocity of cooling air in the pack (Optimum Design I).

The maximum temperature distribution in the pack (Optimum Design I).
Optimum Design II uses the inlet position of the baseline design combined with outlet position of Type 4; the simulation results are shown in Figure 37. The maximum temperature at the core in the pack is concentrated on four cells of B24, B25, B34, and B35 and the maximum temperature at the surface is 43.63°C. Comparing the orthographic view of the temperature distribution (Figure 38), the flow rates of the internal cooling air (Figure 39), and the maximum temperature distribution of the battery in the pack (Figure 40), one can observe that the outlet is adjusting towards the center of the pack, causing the cooling air volume and the flow rates increase and allowing the maximum temperature to decrease. The cell temperatures present a symmetrical distribution in the pack, and the detailed data is shown in Table 16.
The maximum temperature of each battery cell of Optimum Design II (Unit: °C).


The simulation results of Optimum Design II.
The orthographic view of temperature distribution in the pack (Optimum Design II).
Flow velocity of cooling air in the pack (Optimum Design II).
The maximum temperature distribution in the pack (Optimum Design II).
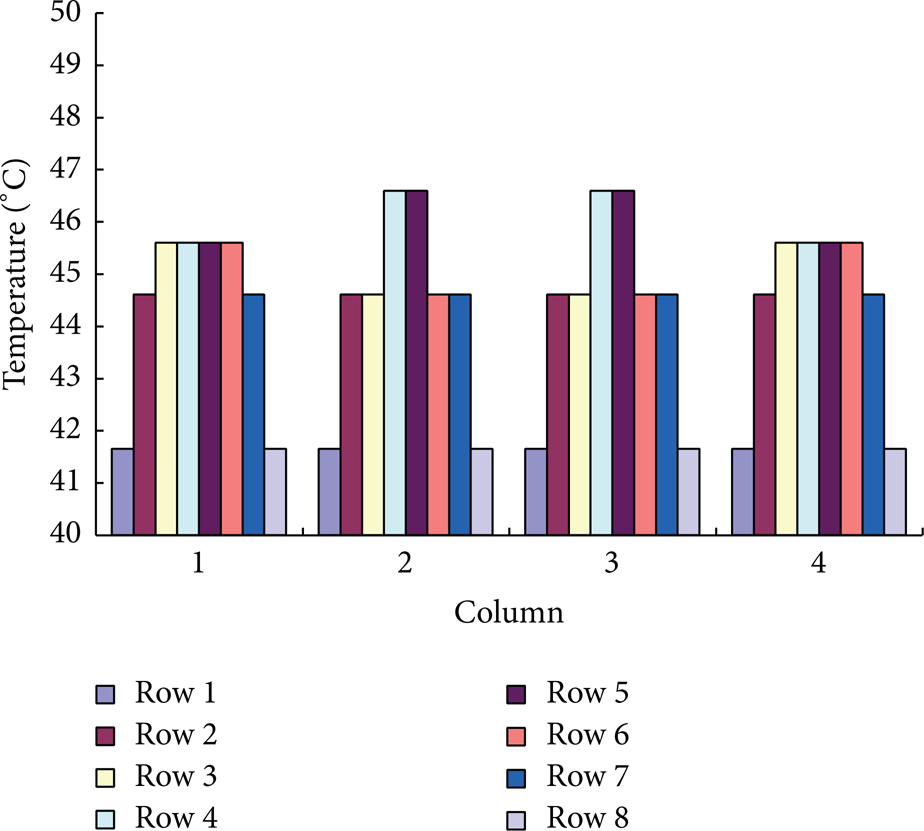
In order to reduce most of heat concentrating in the center of the pack due to decrease in size of the middle gaps (Gap 2, Gap 3, and Gap 4), the concept of Optimum Design III is to change the original dual-outlet design into a single opening with the total area remaining constant. The simulation results are shown in Figure 41, the maximum temperature of the cell surface is 42.45°C, and the maximum core temperature is 45.21°C. By observing the orthographic view of the temperature distribution (Figure 42), the flow rates of the internal cooling air (Figure 43), and the maximum temperature distribution of the battery in the pack (Figure 44), one can obtain that only the temperatures in the position of cells of two rows close to the cooling air inlet are lower. However, the temperature from the remaining cells is uniformly distributed. The detailed data is shown in Table 17.
The maximum temperature of each battery cell of Optimum Design III (Unit: °C).


The simulation results of Optimum Design III.
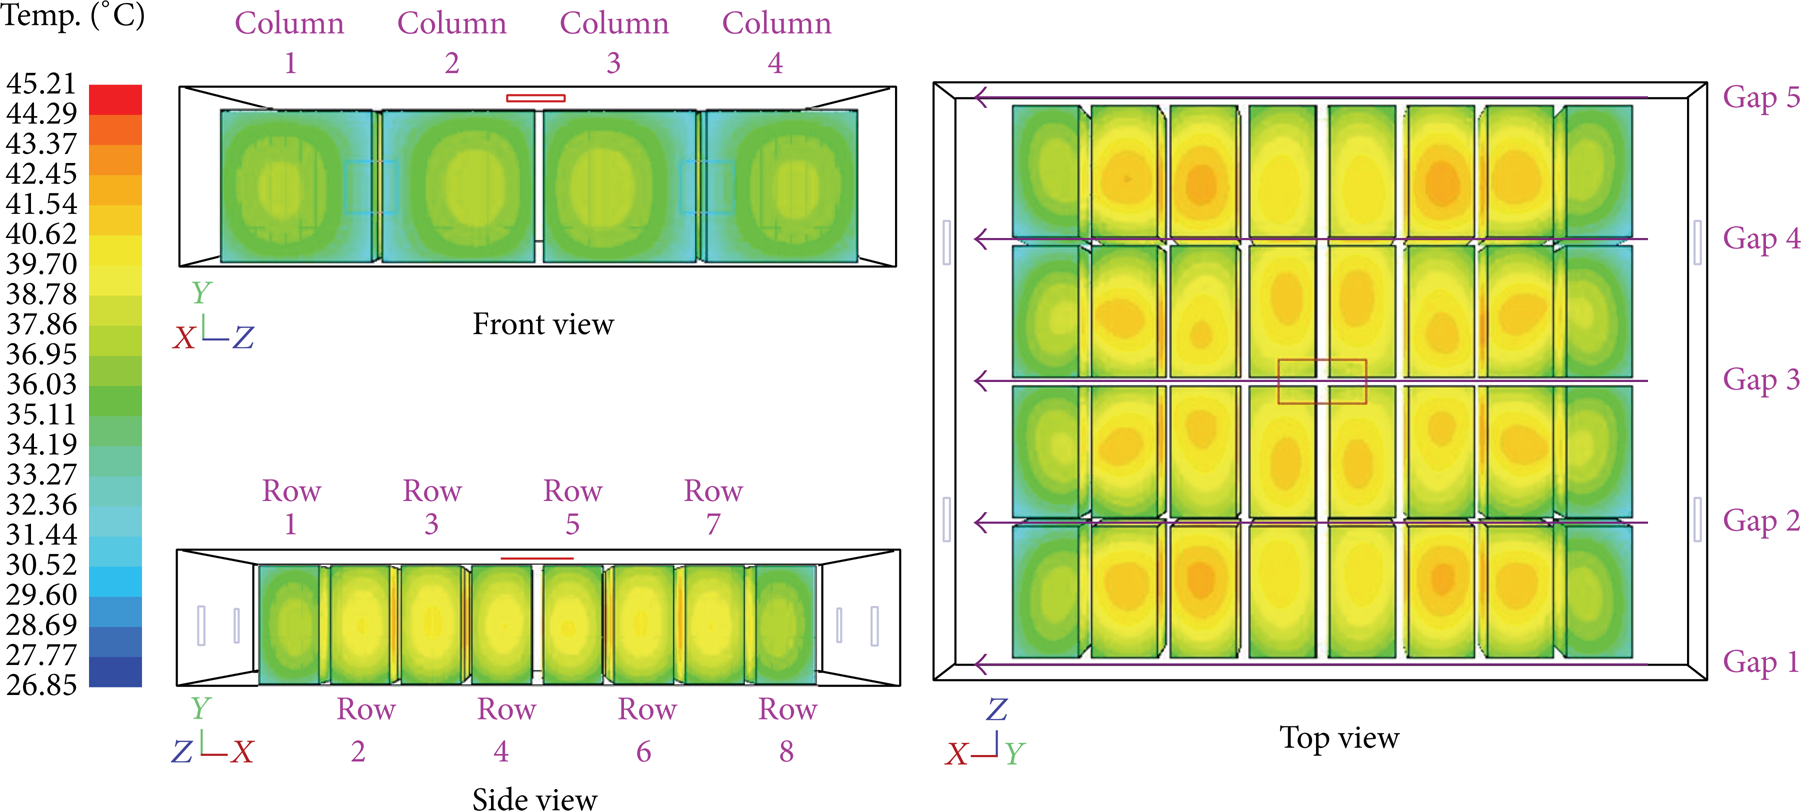
The orthographic view of temperature distribution in the pack (Optimum Design III).

Flow velocity of cooling air in the pack (Optimum Design III).

The maximum temperature distribution in the pack (Optimum Design III).
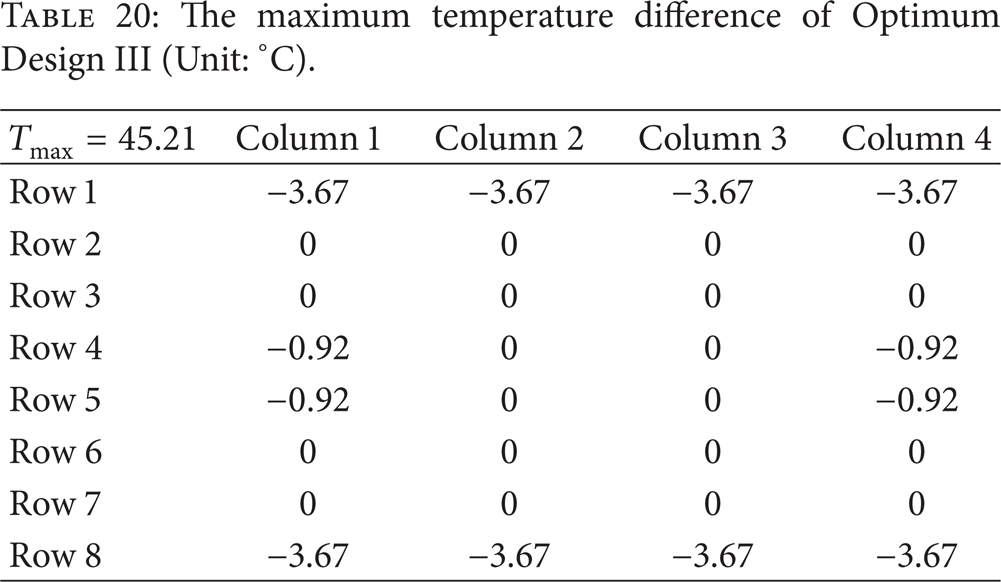
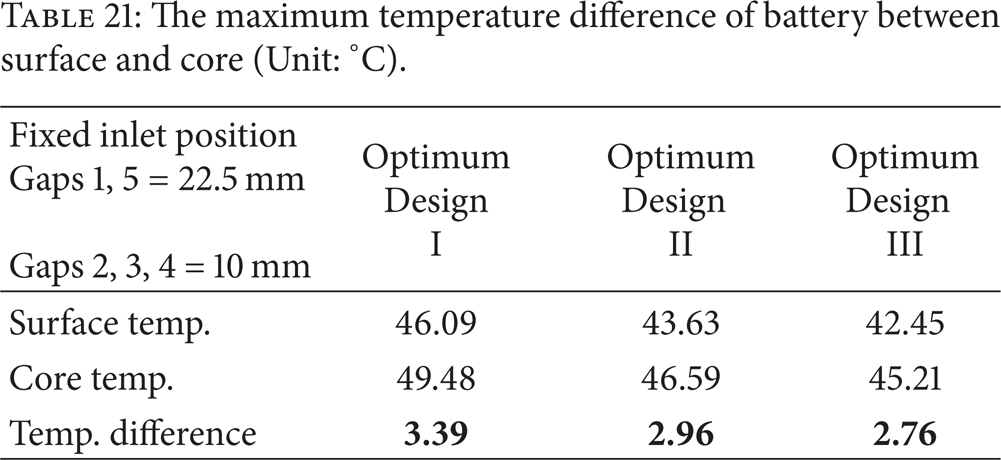
Tables 18, 19, and 20 are the maximum temperature distribution for Optimum Design I, Optimum Design II, and Optimum Design III, respectively. The results show that the Optimum Design III with increasing the size of Gap 1 and Gap 5 allows more and faster cooling air pass to improve the heat concentration problem of Column 1 and Column 4 and reduce the maximum temperature of the battery pack effectively (T max = 45.21°C). The Optimum Design III results in a much uniformly distributed temperature field. The maximum temperature difference among all cells is 3.67°C. The maximum temperature difference between surface and core is the lowest among all designs (ΔT = 2.76°C). Comparing the Optimum Design III to the baseline design, as summarized in Table 22, the maximum surface temperature, the maximum core temperature, the maximum temperature difference between surface and core, and the maximum temperature difference between cells have reduced by 3.4%, 3.8%, 8.7%, and 39%, respectively. The uniformity of the temperature distribution in the pack has improved significantly.
The maximum temperature difference of Optimum Design I (Unit: °C).

The maximum temperature difference of Optimum Design II (Unit: °C).

The maximum temperature difference of Optimum Design III (Unit: °C).
The maximum temperature difference of battery between surface and core (Unit: °C).
The simulation results of Optimum Design III compared with baseline design (Unit: °C).

6. Conclusion
The study proposes a new kind of air cooling ventilation system for battery pack of an electric vehicle different from the traditional series ventilation system, by changing the locations of cooling air inlets and outlets, shapes of outlet, and combining with uneven size of gap among cells. According to simulation results, the design of semiseries ventilation can effectively reduce the maximum temperature and the maximum temperature difference below limit in the pack, the maximum temperature of the cell has reduced by 3.8%, and the maximum temperature difference between surface and core of cell has reduced by 8.7%. The uniformity of the temperature distribution has an improvement of 39% which eventually extend the service cycles of the battery cells and enhance the reliability of battery pack. As to the conceptual design stage, with the help of the CFD simulation technology, one can quickly predict the result of the ventilation system design which shortens the development process to achieve the purpose of cost savings.
Conflict of Interests
The authors declare that there is no conflict of interests regarding the publication of this paper.
Footnotes
Acknowledgments
The authors would like to thank the National Science Council of the Republic of China, Taiwan, for financially supporting this research under Contract nos. NSC 99-2218-E-027-001 and MOST 103-2221-E-027-047.