
Abstract
This study presents experimental investigation about the effect of polymer parameters on the performance of the drag reducing polymers in single-phase water flowing in a horizontal pipe of 30.6 mm ID. Master solutions (1000 ppm) of ten high-molecular weight polymers were injected at different flow rates to achieve polymer concentrations in the range of 2–40 ppm in the test section. The drag reduction increased with polymer concentration up to 10 ppm, above which it reached a plateau value. While the drag reduction at the plateau value increases with polymer molecular weight, the maximum drag reduction was not affected by the increase in polymer charge density up to 13%. For instance, the maximum drag reduction for anionic polymers with molecular weight 6–8 million Da. and charge density between 5 and 13% was around 60%, which decreased to around 38% for the polymer with charge density of 25%. Ionic polymers provided more drag reduction than nonionic ones. The overall conclusion is that drag reduction depends on polymer ability to form intermolecular associations and/or its flexibility, which can be enhanced by increasing molecular weight, decreasing charge density, and selecting smaller side groups in the main polymer backbone.
1. Introduction
Drag reduction is the increase in pumpability of a fluid caused by the small amount of additives. Practically, adding a small concentration of the drag reducing polymers (DRPs) to the carrier fluid reduces the friction of the fluid and increases the capacity of pipeline without changing the pipelines flow conditions [1]. This phenomenon of the DRPs has been applied in the transportation of crude oils [2, 3] and in hydraulic fracturing of oil and gas wells [4, 5]. Parameters that influence the performance of drag reducing polymers can be grouped into polymer parameters and flow parameters. The polymer parameters include polymer molecular weight, charge density, chain flexibility, polymer chemical structure, morphology, and concentration. The flow parameters include geometry, wall roughness, size of the pipeline or channel, type of solvent and salt content, and pH and temperature.
Ever since Tom in 1948 [6] accidentally discovered the fascinating ability of polymers to reduce pressure drop when he was conducting experiments to study degradation of polymers in pump, several investigations have been conducted to shed more light on this breakthrough. These studies include possible factors affecting the effectiveness of drag reducing polymers, mechanisms, and measurements of drag reductions as well as major problems and limitations of drag reducing polymers in both single [1, 7–10] and multiphase flows [11–13].
The influences of nonpolymer parameters on the performances of drag reducing polymers can be found in the works of [1, 6, 14–19]. The current study is interested in the polymer parameters such as chemical structure, molecular weight, and polymer concentration. The chemical structure of the polymer affects two main properties essential for the performance of the polymer drag reduction. These are the polymer flexibility (or rigidity) and its mechanical resistance to hydrodynamic forces. The effect of polymer chain flexibility has also been investigated [19–21]. The common finding is that flexible polymer chains perform better than rigid ones as drag reducing agents. In addition, it has been found that the performance of rigid polymers or semiflexible polymers can be enhanced by grafting flexible polymer chains like polyacrylamide (PAM) onto rigid backbones [20]. However, copolymers with longer and fewer polyacrylamide branches provide higher enhancement and longer shear stability than those with shorter and more PAM branches [22].
The molecular weight of the drag reducing polymers should be higher than 100,000 Da. to be effective [23]. There is unanimous consensus that drag reduction increases with increases in the polymer molecular weight, a finding that was made by [6]. This finding has been validated by other studies using oil-soluble polyisobutylene solutions in gas-oil turbulent flow in different pipe diameters [24–26]. The concentrations required to induce significant drag reduction are in the order of part per million [23, 27]. Drag reduction rapidly increases with the increase in polymer concentration reaching a plateau value [20]. However, other studies revealed that further increase in concentration will slightly reduce the drag reduction below the maximum value [23].
It has been found that polyelectrolytes have a greater solvated volume than nonionic polymers due to the presence of electrostatic repulsion between the charged segments in the polymer chain [28]. This increase in hydrodynamic volume was found to generally result in better drag reduction [29]. Moreover, the chemical structure of some copolymers can allow inter- and intramolecular associations, which have positive impact on drag reduction [29]. The positive effect of the different groups in the polymer backbone with respect to molecular associations may result in more rigid polymer. Hence their polymer structures should be a compromise of the two effects.
This study presents experimental evaluation of some polymer parameters such as chemical structure, molecular weight, and charge density on the performance of the drag reducing polymers in single phase. The approach in this study differs from other studies in the literature in the sense that it simultaneously investigates the influence of major polymer parameters on the performance of the polymer as a drag reducer. The different chemical structures studied will allow shedding more understanding on the major polymer parameter that contributes to more efficient drag reduction.
2. Experimental
2.1. Material
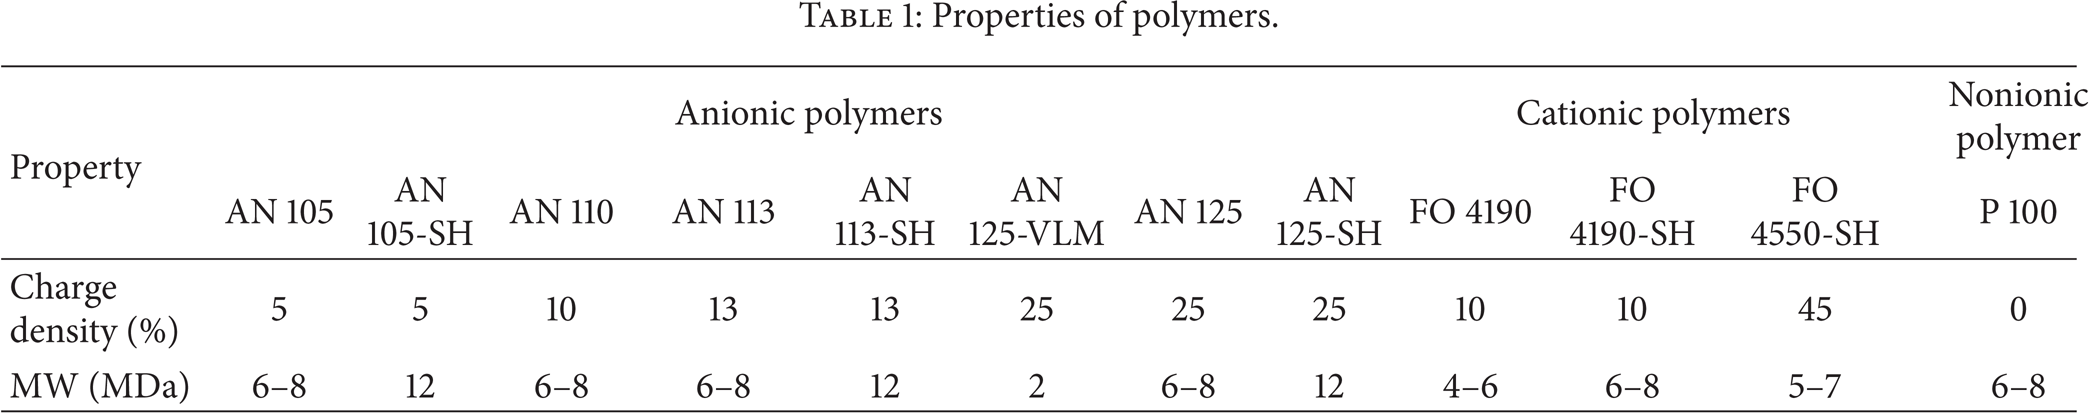
All polymers used in this study are water soluble which are produced by SNF Floerger, France. The nonionic polyacrylamide (P 100) is a homopolymer made up of acrylamide (Figure 1(a)). The anionic polyacrylamides (AN) are copolymers of acrylamide (Figure 1(a)) and 2-acrylamido-2-methylpropane sulfonic acid (AMPS) (Figure 1(b)) with different AMPS contents (i.e., charge density) and molecular weight. The cationic polyacrylamides (FO) are copolymer of acrylamide (Figure 1(a)) and N,N,N-trimethyl aminoethyl chloride acrylate (Figure 1(c)) with different charge densities and different molecular weights. Table 1 lists the charge densities and molecular weights for all polymers used in this study. Charge density of a polymer is the percentage of repeating units that have a charge. It should be noted that the charge densities of the polymers used in this study were determined and provided by the manufacturer (i.e., SNF Floerger).
Properties of polymers.

Chemical structure of the monomers composing the nonionic, anionic, and cationic polyacrylamides.
2.2. Polymer Preparation
A master solution with a concentration of 1000 ppm from each polymer was prepared using a paddle mixer. This was done by setting the mixer to a fixed speed and inserting the paddle into a measured mass of tap water. A known mass of polymer powder as measured using analytical balance was thereafter gently added to the shoulder of the vortex formed by the water as the stirring continued. The continuous stirring was allowed for 3 hours for the mixture to be completely homogenized, after which the master solution was left overnight to ensure complete dissolution.
2.3. Determination of Intrinsic Viscosity and Overlap Concentration (C*)
The intrinsic viscosities were determined from the viscosities of the polymer solutions (η) and that of the solvent (η s ), which is water at 30°C using Cannon-Fenske apparatus. This instrument actually measures kinematic viscosity from which dynamic viscosity is obtained by applying the following relation:

where η is the dynamic viscosity (cP), ϑ is the kinematic viscosity (cSt), and ρ is the density (g/cm3).
Therefore, the intrinsic viscosity number is calculated using the following two equations:
Huggins equation:

where η R is the reduced viscosity defined in terms of specific viscosity (ηsp) as
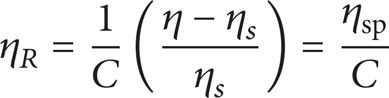
and C is the polymer concentration.
Craemer equation:
where η I is the reduced viscosity defined in terms of relative viscosity (η r ) as

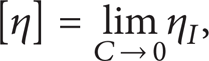
Hence, intrinsic viscosity is obtained by plotting the reduced and inherent viscosities against the polymer concentration and then extrapolating the linear curves to concentration of zero.
Overlap concentration, C*, measures the transition between the dilute and semidilute regions. It was determined by diluting a stock solution of 1000 ppm to different concentrations. Thereafter, zero shear viscosity of these dilute solutions was measured at 30°C using the Cannon-Fenske apparatus. The plot of the viscosity against their respective concentrations can be used to obtain the overlap concentration which is the intersection of two different slopes at low and high concentration.
2.4. Experimental Procedure for the Drag Reduction Measurement
The experiments were conducted in a flow loop (Figure 2) with test section made of acrylic horizontal pipe with 30.6 mm ID and a length of 12 m. Tap water was flowed from storage tank into the test section with constant velocity of 2 m/s except when the effect of flow rate was investigated. The master solution of a certain polymer was then injected into the water flow at different flow rates at a distance of 1.5 m from entrance of test section so that polymer concentrations of 2, 5, 10, 20, 30, and 40 ppm can be achieved in the main water flow line. The concentration of master (premixed) polymer solution which was 1000 ppm (0.1% w/w) was chosen to ensure that it is within the range of dilute solution to achieve homogeneous drag reduction in which the polymer solution can dissolve and distribute uniformly after a short distance from the injection point. It has been established that heterogeneous drag reduction, in which the injected polymer solution forms a thread that preserves its identity far beyond the location of the test section, can be achieved by the injection of a concentrated polymer solution (a 0.5–1.0% w/w solution) into the bulk fluid [7]. In addition, uniform distribution of polymer molecules was ensured by taking the pressure drop measurements at 10 m upstream of the test section. EESIFLO 5000 series ultrasonic flow meter was used to measure the water flow rate while Masterflex L/P digital console pump drive was used to measure the polymer solution flow rates. Honeywell ST 3000 pressure transmitter connected to pressure taps at 1 m gap located at 10 m from entrance section was used to measure the pressure drops.

Schematic of single-phase flow loop.
The pressure taps were connected to the flow section through small holes in the tube walls. The locations of these taps were designed to ensure fully developed flow in the test section across which pressure drop measurements were conducted. The loop was equipped with a computer data acquisition system to automatically record the measured pressure drops.
The percentage drag reduction (%DR) was calculated using the following equation:

where ΔPwithoutDRP and ΔPwithDRP are the pressure drop without and with DRP injection, respectively.
3. Results and Discussion
3.1. Intrinsic Viscosity and Overlap Concentration
Figures 3 and 4 illustrate how these intrinsic viscosities and the overlap concentrations were obtained for AN 105-SH. Table 2 shows the intrinsic viscosities and overlap concentrations of the polymers used in this study. It is clear that the overlap concentrations of all the polymers are below the concentrations of master solutions used in this study (i.e., below 1000 ppm). This was done to take advantage of the fact that, after dilution of the master solutions inside the test section to the desired polymer concentrations, the presence of residual entanglements of the polymer chains may have a positive effect on drag reduction [10].
Overlap concentrations (C*) and intrinsic viscosities [η] of polymers in tap water using the inherent viscosities at 30°C.

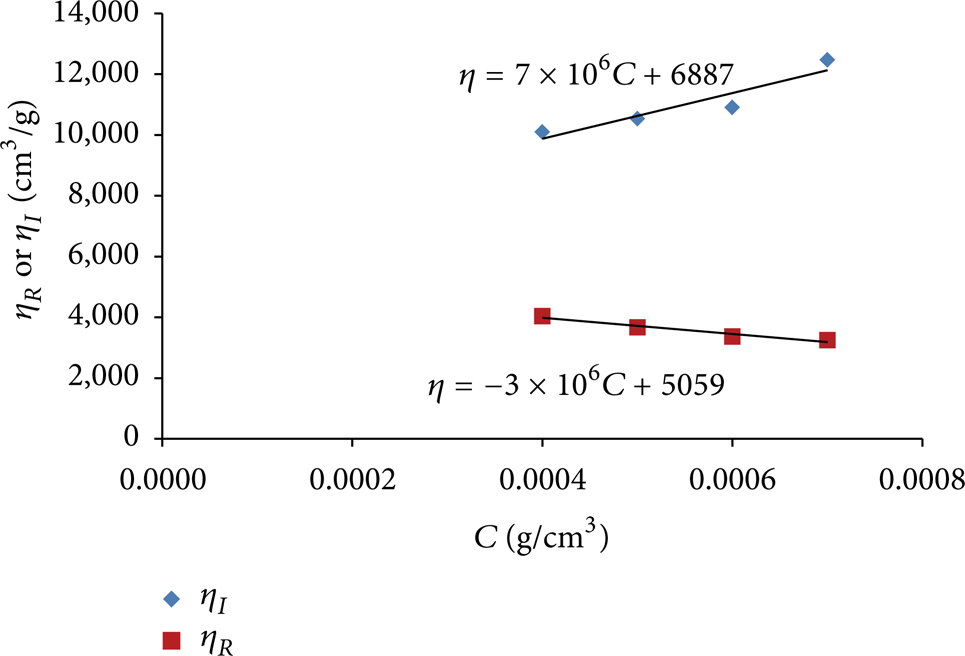
Determination of intrinsic viscosity of AN 105-SH in water at 30°C.

Determination of overlap concentration of AN 105-SH in water at 30°C.
The intrinsic viscosity, which is an indication of the volume of the polymer coil, increases with charge density and molecular weight. The intrinsic viscosity increases from 5058 to 7320 cm3/g when the charge density of the AN polymers with a molecular weight of 12 million Daltons increases from 5 to 25% (i.e., the polymers AN 105-SH, AN 110-SH, AN 113-SH, and AN 125-SH). This is expected since the presence of ionic groups onto a polymer results in polymer chain expansion in aqueous solution due to intramolecular electrostatic repulsions [30]. Similarly, the increase of the molecular weight of the AN 125 from 2 to 12 million Daltons results in the increase of intrinsic viscosity from 6038 to 7320 cm3/g (Table 2).
Figure 3 shows that the intrinsic viscosity of the AN 105-SH at 30°C results in two different values depending on whether it is determined from reduced or inherent viscosity. This was the case for all polymers used in this study. Hence, the values listed in Table 2 are the intrinsic viscosities obtained using the inherent viscosity since the objective is to compare between the polymers.
3.2. Drag Reduction
3.2.1. Flow Rates/Reynolds Number in the Flow Section
Figure 5 presents the drag reduction as a function of water flow rate, which is directly proportional to Reynolds number, in the main section using AN 105-SH at different concentrations in the main flow section. The Reynolds numbers were determined using the parameters of water flow (average velocity, viscosity, density, and pipe diameter) before the injection of polymer solutions. This is to ensure that the water flow is in turbulent region since drag reduction can only occur when the flow is turbulent. All flow rates fall in the turbulent flow regime with the minimum Reynolds number of 15,250 at the flow rate of 1.32 m3/h. It can be observed that there is a gradual increase in the drag reduction as the flow rate is increased. This is expected because increase in the flow rate means an increase in the velocity or Reynolds number, which was found to increase the drag reduction [6]. It was also found that drag reduction at moderate Reynolds number is enhanced as a result of the increase in the effective viscosity while, at very high Reynolds number, drag reduction occurs as a result of variation of effective viscosity as a function of the distance to the wall because of turbulent activity [31]. The flow rate of 5.3 m3/h, which corresponds to Reynolds number of about 61,460 (fully turbulent), was selected to investigate the effect of polymer properties on drag reduction. Karami et al. (2012) [1] also investigated the effect of increasing Reynolds numbers on drag reductions of three different polymers and found a similar trend to the one observed in this study.

Drag reductions dependence on Reynolds number at different polymer concentrations for the AN 105-SH.
3.2.2. Polymer Molecular Weight
Figures 6, 7, and 8 present the effects of molecular weights with charge densities of the anionic polymers on drag reduction. The drag reduction increases sharply with polymer concentration reaching a plateau value at concentration above 10 ppm [23]. Generally, the increase in molecular weight for the same charge density resulted in the increases in drag reduction, which is consistent with a number of similar studies [6, 24, 25, 32]. It can also be observed that the difference between the drag reductions obtained at the plateau region for different polymer molecular weights increases with increase in the charge density. For example, the difference between the polymers AN 105 and AN 105-SH is around 3%, whereas the polymers AN 125 and AN 125-SH resulted in drag reduction difference of around 15% at the plateau region.

Effect of increasing molecular weight on drag reduction of the anionic polymer (AN 105) containing 5% charge density at different polymer concentrations. Measurements conducted at a water flow rate of 5.3 m3/h.

Effect of increasing molecular weight on drag reduction of anionic polymer (AN 113) containing 13% charge density at different polymer concentrations. Measurements conducted at a water flow rate of 5.3 m3/h.

Effect of increasing molecular weight on drag reduction of the anionic polymer (AN 125) containing 25% charge density at different polymer concentrations. Measurements conducted at a water flow rate of 5.3 m3/h.
The cationic polymer FO 4190 exhibited the same effect of molecular weight on drag reduction as shown in Figure 9. The maximum drag reduction of the cationic polymer is similar to the comparable anionic polymer (i.e., AN 113). However, the initial increase in drag reduction is sharper at low polymer concentrations for the cationic polymer.

Effect of increasing molecular weight on drag reduction of the cationic polymer (FO 4190) containing 10% charge density at different polymer concentrations. Measurements conducted at a water flow rate of 5.3 m3/h.
The increase in the drag reduction with the increasing molecular weight as observed in this study can be attributed to the longer and linear polymer chains provided by increasing molecular weight. Since drag reduction in turbulent flow depends on the level of entanglement and interaction of the polymer chains with turbulent flow, increasing the molecular weight provides more chance for this association to occur. In addition, higher molecular weight polymer is less susceptible to mechanical degradation, which reduces the drag reducing performance of the polymer, than lower molecular weight polymer.
3.2.3. Polymer Charge Density
Figure 10 shows the effect of increasing charge density of the anionic polymer with a molecular weight of 6–8 million Daltons from 5 to 25%. The drag reduction is almost the same for the polymers with charge densities up to 13%, above which drag reduction decreases by around 20% at the plateau region when a polymer with the charge density of 25% was used. The same trend can be observed in Figure 11 when polymers with a molecular weight of 12 million Daltons were used. However, the increase in molecular weight masked the negative effect of the increase in the charge density to 25% resulting in a difference in drag reduction at the plateau region of around 10%.

Effect of increasing the charge density of the anionic polymer on drag reduction of low molecular weight polymer (6–8 million Daltons) at different polymer concentrations. Measurements conducted at a water flow rate of 5.3 m3/h.

Effect of increasing the charge density of the anionic polymer on drag reduction of high-molecular polymer (12 million Daltons) at different polymer concentrations. Measurements conducted at a water flow rate of 5.3 m3/h.
The drag reduction of the cationic polymer was also negatively affected by the increase in charge density as shown in Figure 12. The increase in charge density from 10 to 45% of the polymer with a molecular weight of 6–8 million Daltons resulted in a difference of around 10% in drag reduction.

Effect of increasing charge density of cationic polymer on drag reduction of low molecular polymer (6–8 million Daltons) at different polymer concentrations. Measurements conducted at a water flow rate of 5.3 m3/h.
It appears, from the observed trend of the drag reduction with the increase in charge density, that the positive effect ionic content of the polymer is only significant up to a critical value above which the performance of the polymer in drag reduction is negatively affected. With charge density lower than the critical value, it is likely that the polymer chains still retain certain degree of flexibility and ability to form temporary and desirable intermolecular interactions due to more extended conformation of the polymer chains, thereby leading to an increase in drag reduction. On the other hand, the presence of higher charge density may result in more rigid conformation of the polymer chains, which decreases their performance in reducing drag.
3.2.4. Polymer Chemical Structure
Cationic and anionic polymers of the same quantity of charge density are compared with nonionic polymer solution as shown in Figure 13. The nonionic polyacrylamide (P 100) showed poor drag reduction performance (maximum drag reduction of 30%). On the other hand, the inclusion of 10% charged groups in the main backbone of the polyacrylamide improved the drag reduction, which reached around 60% at the plateau region. The better performance of the charged polymers compared to neutral polymers was also observed by McCormick and coinvestigators [29]. They attributed this superiority of the charged polymers to their larger hydrodynamic size in solution compared to the neutral polymers which is indicated by the intrinsic viscosity.

Comparison of drag reduction of nonionic, cationic, and anionic polymers of the same charge density (10%) and molecular weight. Measurements conducted at a water flow rate of 5.3 m3/h.
The intrinsic viscosities, which are measure of the polymers’ contribution to the viscosities of the polymer solutions, are related to drag reduction effectiveness as presented in Figure 14. It is expected that drag reduction should increase with the increase in intrinsic viscosity but these results are not in total agreement with this trend. The lack of linear relationship between drag reduction and intrinsic viscosity does not support the fact that the larger hydrodynamic volume of the polymer would result in higher drag reduction. This study supports the fact that the polymer structure has to have certain design that allows higher polymer elasticity and/or intra- and intermolecular associations which is provided with copolymers. However, the percentage of the charged groups has to be optimized to prevent the polymer from becoming rigid due to the expansion of the polymer due to the electrostatic repulsion.
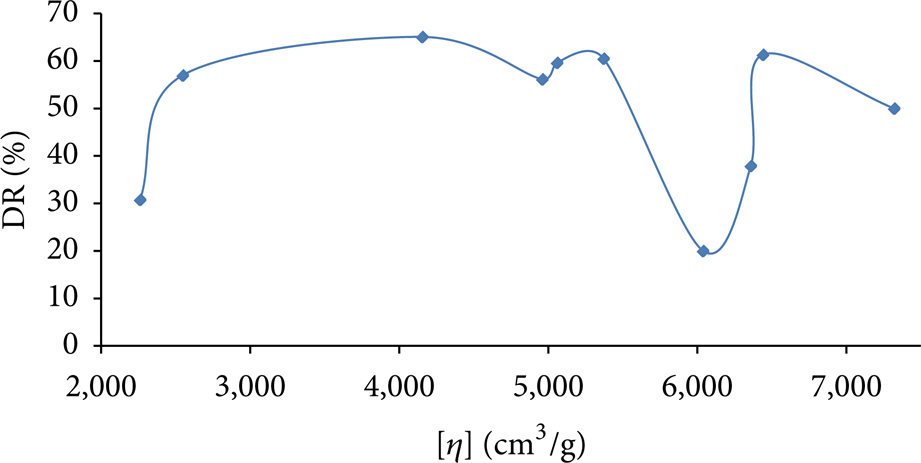
Drag reductions of polymer solutions with different intrinsic viscosities at polymer concentration of 20 ppm. Measurements conducted at a water flow rate of 5.3 m3/h.
4. Conclusions
In this study, the effect of polymer parameters such as molecular weight, charge density, and chemical structure on drag reduction was investigated using a single-phase water flow in a 30.6 mm ID horizontal pipe. Drag reduction increases sharply with polymer concentration in the flow section reaching a plateau value above 10 ppm. Also, drag reduction at the plateau region increases with the increase in polymer molecular weight. The inclusion of the charged groups in the backbone of the polymer has a positive effect on the performance of the polymer as a drag reducer. However, the charge density has to be optimized since its increase above a certain amount would result in more rigid polymer structure, hence lowering its drag reduction ability. Moreover, it has been found that drag reduction is not a function of the polymer intrinsic viscosity, which is the indication of the hydrodynamic volume of the polymer in solution. This study supports the need of both elasticity and ability of the polymer to form intra- and intermolecular entanglements to perform as a good drag reducer.
Conflict of Interests
The authors declare that there is no conflict of interests regarding the publication of this paper.
Footnotes
Acknowledgments
The authors would like to thank The Research Council (TRC) and Sultan Qaboos University, Oman, for sponsoring this research.