
Abstract
Owing to the acceleration of IoT- (Internet of Things-) based wireless sensor networks, cloud-computing services using Big Data are rapidly growing. In order to manage and analyze Big Data efficiently, Hadoop frameworks have been used in a variety of fields. Hadoop processes Big Data as record values by using MapReduce programming in a distributed environment. Through MapReduce, data are stored in a Hadoop file system, and that form is not structured but unstructured. For this, it is not easy to grasp the cause, although inaccurate and unreliable data occur in the process of Hadoop-based MapReduce. As a result, Big Data may lead to a fatal flaw in the system, possibly paralyzing services. There are existing tools that monitor Hadoop systems' status. However, the status information is not related to inner structure of Hadoop system so it is not easy to analyze Hadoop systems. In this paper, we propose an intrusive analyzer that detects interesting events to occur in distributed processing systems with Hadoop in wireless sensor networks. This tool guarantees a transparent monitor as using the JDI (Java debug interface).
1. Introduction
Wireless sensor networks [1–6] construct network groups with subminiature sensor nodes or more sensor nodes (e.g., high-performance sensor nodes). These nodes have a self-wireless communicator such as an RF communicator and mutually make up collaborative communications. Generated network groups collect information about specific areas that are difficult for humans to observe directly or under around-the-clock surveillance. Then, the collected information is transported to sink nodes. The nodes provide users it through the Internet. Recently, most things used in their fields include a networking function owing to the integration of many technologies. That is, wireless sensor networks have emerged as an important fact of cloud computing owing to the appearance of the IoT (Internet of Things) [7–10]. The IoT treats data generated by things and provides various services with the new information using them. In addition, its service has connectivity with the IoT server platform without the involvement of humans, and it produces and consumes the data of things. To manage massive amounts of data called Big Data that are generated in various fields, a distributed file system, which is the key to cloud-storage technology, is necessary. Hadoop [11, 12] and SWIFT [13] are two public software packages for this purpose, while some commercial software packages include SoFS [14], EMC [15], and HDS [16]. We focus on the Hadoop file system.
Hadoop supports distributed application programs that operate on cluster computers to expedite Big Data [17, 18], and these data are processed as a diffuse form using MapReduce [19, 20]. Through MapReduce, data are stored in a Hadoop file system. This form is not structured as in a relational database, but it is unstructured. For this, it is not easy to grasp the cause, although inaccurate and unreliable data occur in the process of Hadoop-based MapReduce. In this study, we propose an intrusive analyzer that detects interesting events that occur during a MapReduce process in Hadoop distributed file systems. The tool based on JDI [21, 22] can provide meaningful information for users while monitoring a series of processes that store data generated in sensor networks using the MapReduce program in the Hadoop.
In this paper, we first describe the JDI (Java Debug Interface) and Hadoop framework and then explain related works about Hadoop monitoring systems in Section 2. Section 3 discusses the JDI-based intrusive analyzer. In Section 4, we describe a Hadoop cluster system constructed for experimentation and the experimental details. Section 5 summarizes the paper and provides a brief outlook for further work.
2. Background
In this section, we describe the JDI of key technology in observation of the Hadoop framework and briefly explain the Hadoop framework and related works about Hadoop monitoring systems.
2.1. JDI (Java Debug Interface)
As the JDI is part of the JPDA (Java Platform Debugger Architecture) [23], it is a Java API that supports the writing of debugging programs. The JPDA is a debugging platform provided in Java, and its structure is shown in Figure 1. The JPDA consists of three components: the JVMTI (Java VM Tool Interface), the JDWP (Java Debug Wire Protocol), and the JDI. The JVMTI is located at the back-end of the debuggee, and the JDI is located at the front-end of the debugger UI. The JDWP is a packet-based asynchronous communication protocol between the JDI and the JVMTI, and its packet contains a command packet and response packet.

Structure of the Java Debug Interface.
The JVMPI is not a monitoring technology in an event-driven way, but it is that of byte-code instrumentation. Here, byte-code instrumentation changes the original programs in order to monitor or trace them. Thus, the JVMTI can control and monitor Java application programs executed on the JVM. The JDI provides APIs that are able to monitor the execution states of Java application programs on-the-fly and provides a platform-independent debugging environment as a high-level debugging facility. For example, the JDI can connect with Java programs locally or remotely using a connector API. When the connection is completed, the JDI accesses the VM using the VirtualMachineManager API and then requests events with the Request API. In this state, the JDI collects information regarding the requested events while Java application programs are executed. Hence, the JDI provides an environment for monitoring threads and variables that occur during program execution.
2.2. Hadoop
Hadoop is a Java-based open-source framework that can dispose of Big Data in the HDFS (Hadoop distribution file system) and MapReduce. The file structure in a file system such as FAT, NTFS, and EXT consists of metadata (file name, owner, permission, directory, etc.) and data (contents). Its block size is generally 4 KB or 8 KB. However, Hadoop's block size is basically 64 MB, and it can be extended up to 128 MB, 256 MB, and 1 GB. As the size increases, the chunk size of the data increases so that files can be saved gradually. By doing this, the performance for reading and writing data improves. Hadoop-based files do not depend on the particular storage subsystems, and they copy their data blocks in distributed systems. In addition, the Hadoop file system is designed to not use high equipment such as RAID storage. It guarantees the scalability of the system and a cost-reduction effect.
For processing Big Data, the Hadoop file system can adopt MapReduce. MapReduce resolves various complex subjects of a Big Data nature by using parallel processing. However, the commands for processing are simple and abstract so it is easy for programmers to use a MapReduce event if they are not used to parallel programming. Further, MapReduce supports high throughput via distributed computing. A MapReduce process is composed of Map and Reduce phases. Each phase has a pair of Key-Value as the input and output, and the type is selected by the programmer. In the Map phase, the input is the original data, and its records are processed one by one, whereupon pairs of temporary Key-Value are created. Before sending the pairs to the Reduce phase, they are sorted with Key, and new groups are generated for them. The Reduce function reravels all Value with the same Key in pairs of temporary Key-Value, and it then treats the Values and outputs a processing result. Through MapReduce, data are stored in Hadoop file systems, and their type is not structured as in a relational database, but it is unstructured. For this, it is not easy to grasp the cause, although inaccurate and unreliable data occur in the process of Hadoop-based MapReduce. Figure 2 shows a MapReduce process. Jobtracker of namenode has three functions: governing execution of jobs, task scheduling decision, and responding to heartbeat message from tasktrackers. Tasktracker of datanode has two functions: governs execution of tasks and periodically reports the progress of tasks via heartbeat message.
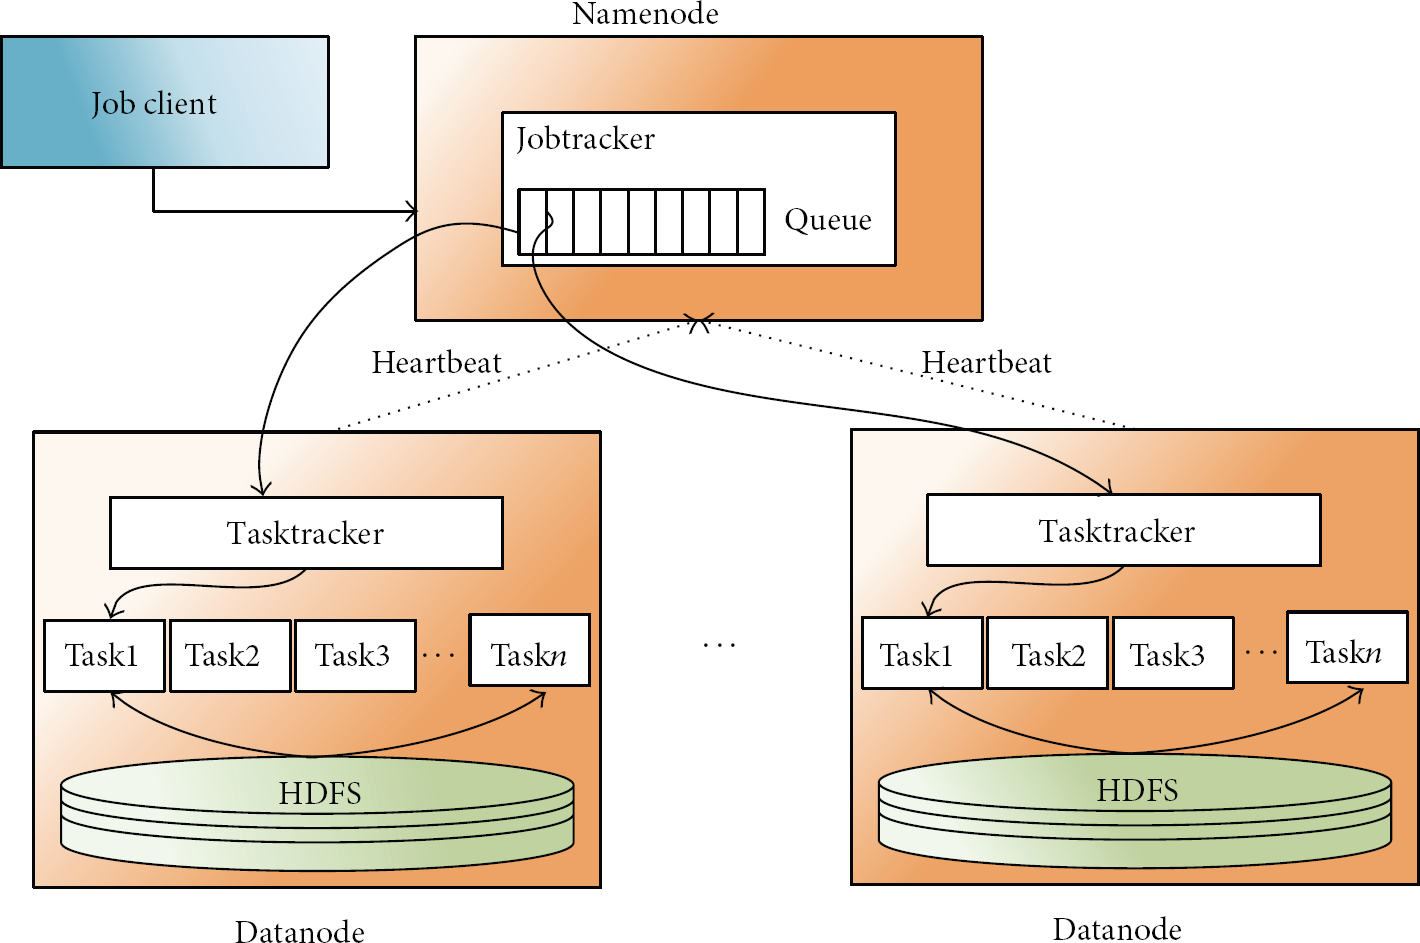
Works of MapReduce in the Hadoop framework.
2.3. Related Works
Ganglia [24] is a scalable system for monitoring high-performance computing system such as clusters and grids and a BSD-licensed open-source project. This tool provides cluster-system information (memory, disk, network, and execution process) and Hadoop-system information (HDFS capacity, #HDFS underreplicated block, #heartbeats, and heap memory) in real-time. It uses carefully engineered data structures and algorithms to achieve low per-node overheads and high concurrency.
Chukwa [25] is a data collection system for monitoring large-scale distributed system environments. It consists of agent, collector, data processing, data analysis, and data display. Agent uses self-developed adaptor and collects log data of Hadoop systems. Collector periodically receives the log data sent from agent and stores it into HDFS. Data processing is a pair of MapReduce jobs. The first job is that log data are archived without processing and interpreting. The second job is that structured data are generated through parsing the log data and are loaded into a data store. HICC (Hadoop Infrastructure Care Center) analyzes the log data and then displays analyzed results (global status, HDFS status, and cluster status) on web. Then this tool can manage status of Hadoop file systems and server computers.
Mochi [26] analyzes tasktracker and datanode logs obtained from SALSA while MapReduce is executed. This tool provides execution flows of data input and output used for MapReduce and dynamic behaviors of Hadoop systems. Also, results aggregated in the process are displayed. For this, Mochi can monitor Hadoop systems without any modification, so this tool is interworked to Hadoop systems freely. The status information which generates in such existing tools is not related to inner structure of Hadoop system so it is not easy to analyze Hadoop systems.
3. A JDI-Based Intrusive Analyzer
In this paper, we propose a JDI-based intrusive analyzer that detects interesting events that occur during a MapReduce process in Hadoop distributed file systems. The tool can provide meaningful information for users while monitoring a series of processes that store data generated in sensor networks using the MapReduce program in the Hadoop systems. The intrusive analyzer consists of four parts: VM generator, event monitor, event filter, and event analyzer. VM generator launches a target program to JVM in order to monitor the program. It generates a VM object with a target program's property as output. Event monitor sets monitoring events by users to JVM and registered events are identified in run-time by it. Event monitor's outputs are events to occur in the target program. Event filter not only monitors events such as threads, variables, and classes, but also selects and records specific/interesting events of them all. Recorded information is utilized by event analyzer to analyze a MapReduce process running in a Hadoop system.
Figure 3 shows the structure of the suggested intrusive analyzer. In this figure, the JDI-based intrusive analyzer requests specific events from the JVM as soon as the Hadoop framework is started by Commands and Hadoop Environment Variables. When the framework is functioning normally, the agent monitors the various Hadoop daemons including jobtracker, tasktracker, namenode, and datanode. Upon the execution of these daemons, events configured by the agent pass through the JDI. Of these events, the interesting events (threads, variables, and queues) are observed. That is, the Hadoop framework is monitored by the analyzer. The JDI-based analyzer runs in each node.

Structure of an intrusive analyzer based on JDI.
Figure 4 shows the overall structure of a Hadoop framework based on a wireless sensor network. In this figure, each sensor network group (sensor network 1, sensor network 2, and sensor network 3) has different sensors and purposes as well as generating a variety of sensing data. For example, sensor network 1 collects sensing data regarding environmental information (humidity, temperature, carbon dioxide, carbon monoxide, ozone, etc.). Sensor network 2 collects sensing data regarding historical information (water level, rainfall, etc.). Sensor network 3 collects sensing data regarding video information (proximity distance, image, vision, etc.). The collected sensing data will be very large in size; hence, it is called Big Data. These data are first stored in the local file system of the namenode. Stored data are again stored in the distributed file systems based on the Hadoop framework through MapReduce. The Hadoop framework is comprised of namenodes and datanodes. Each node has either a server agent or a client agent in order to monitor the Hadoop framework during MapReduce. These agents are implemented with the JDI where an agent is an intrusive analyzer. In addition, the namenode has a manager that controls the client agents included in the datanodes of the subsystems and offers the user the analyzed results.

Overall design of the Hadoop framework.
4. Experimentation
This section is comprised of two parts: experimental environment and experimental results. In experimental environment, we introduce three types of Hadoop systems and explain how our Hadoop system is constructed. And for analyzing a Hadoop system which we construct, two types of experimental sets are mentioned. One is self-made data sets and the other is published data sets.
4.1. Environment
There are three ways to construct a Hadoop cluster: the single construction way, the virtual distribution way, and the complete distribution way. The single construction way is a nondistribution mode in which Hadoop is executed by a Java process in one local system; it is mostly helpful for debugging Hadoop-based applications. The virtual distribution way sets several virtual Java processes and executes namenodes and datanodes. The complete distribution way constructs one cluster composed of multiple nodes that communicate with TCP/IP. As shown in Figure 5, we employ a Hadoop framework based on the complete distribution way. This framework uses three computers and one switching hub and consists of two datanodes and one namenode. The same OS (Ubuntu 12.04 LTS) and Hadoop 1.2.1 are installed in each node. The specifications of each node are listed in Figure 5.

Experimental environment: Hadoop framework based on a complete distribution.
4.2. Results
The Hadoop system of Figure 5 is actually constructed in our laboratory like a picture of Figure 5. We have analyzed internal states (threads, variables, etc.) of the constructed system itself. The reason to analyze internal states is to graph a relation of MapReduce processing to a Hadoop system. We empirically prove the relation using two types of experimental sets. One is self-made data sets and the other is published data sets. Self-made data sets consist of seven cases and their size is 16 MB, 32 MB, 64 MB, 128 MB, 256 MB, 512 MB, and 1024 MB, respectively. It is an assumption that self-made data are sensing data to occur in the wireless sensor networks. Published data sets have six cases and their data names are Texas weather data, Twitter token data, and Wikipedia dump data (including category, title, index, and page). As the results of self-made data sets, Table 1, Figures 6 and 7 are presented as experimental results. We carry out the experiments about Jobtracker of the namenode in the Hadoop framework (Figure 2). When these data are processed by MapReduce, the Hadoop framework is worked to dispersively store the data in datanodes. Table 1 shows the experimental results for the number of threads, the number of total accesses for the variables, and the consumed time for the JHS (JDI Hadoop system) and PHS (pure Hadoop system).
Number of Threads, Number of Total Accesses, and the Time Consumed in the JHS and PHS (Self-made Data Sets).


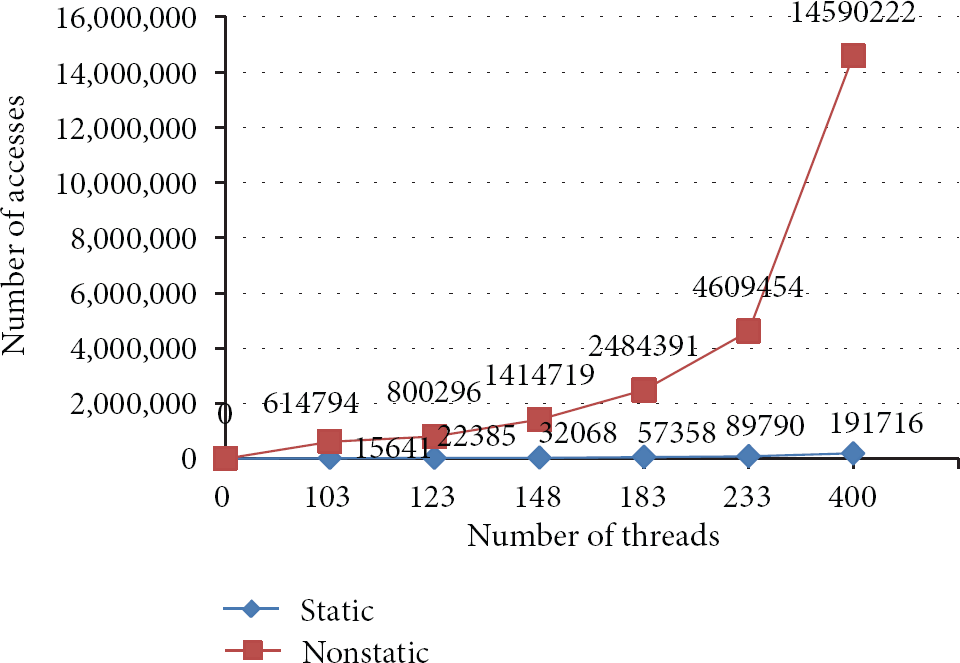
Relationship between the number of threads and the number of accesses.

Time consumed in the PHS and JHS.
In a result of Table 1, we have found that the number of threads and number of total accesses increase as the input data size increases. However, there is no increase in the number of variables. That is, the number of variables is 237 and 491 for static and nonstatic variables, respectively, although the input data size increases. In static column, the occurrence ratio of read access increases steadily and that of write access decreases steadily. In nonstatic column, the occurrence ratio of read access increases entirely but decreases in file size 32 MB, and that of write access decreases entirely but increases in file size 32 MB. With this result, we caught two factors. (1) The maximum occurrence ratio of write access is figured out (e.g., when the number of threads is 60, static write access is 6.06%, and when the number of threads is 82, nonstatic write access is 30.78%). (2) Accesses of nonstatic variables affect monitoring performance of Hadoop systems. To further understand the results, we plot the data of Table 1 on two graphs (Figures 6 and 7). Figure 6 shows a relation between the number of threads and the number of accesses while executing MapReduce in a Hadoop system. Owing to the growth of the number of threads according to the input values, the number of total accesses also increases. In particular, the number of accesses for nonstatic variables increases exponentially and the number of read accesses is bigger than that of write accesses. We infer that temporary variables in Jobtracker are mainly used in order to decide jobs assigning to tasktrackers. Also, as static variables are similar to shared variables among threads, a wide variation for the number of their accesses is not great. However, in the future, these variables will be important point for adjusting and debugging Hadoop systems. Figure 7 shows the time consumed in the JHS and PHS. On average, the JHS is slower than the PHS by approximately 2.3 times. However, we have found that this overhead does not reach a serious level because the processing time of the JHS is worse by approximately 1.2 times in the case of 1 GB. Thus, it is sufficient to use a JDI technique for monitoring Hadoop systems.
Table 2 and Figures 8 and 9 show experimental results about published data sets. Overall, the result pattern of these sets is similar to that of self-made data sets. The difference in experimental results between self-made data sets and published data sets, however, is the number of threads and the number of accesses according to data size. In spite of the difference, the ratio of read and write accesses for static and nonstatic variables and that of consumed time in JHS and PHS are approximately similar to those of Table 1. To be more concrete, the JHS is slower than the PHS by approximately 2.1 times on average. The reason there is a sudden change in Figures 8 and 9 is that data size is suddenly great (3011 MB to 6144 MB).
Number of Threads, Number of Total Accesses, and the Time Consumed in the PHS and JHS (Published Data Sets).


Relationship between the number of threads and the number of accesses (published data sets).
Time consumed in the PHS and JHS (published data sets).
5. Conclusion
We have constructed a Hadoop system based on the complete distribution way and have designed the JDI-based intrusive analyzer. For experimental verification of the designed tool, we utilize the Big Data produced in sensor networks. This data does not occur in the real world but is instead virtual data. During MapReduce of the data, our analyzer monitors threads and accesses to work in a Hadoop system. As a result, we have found a relation between the number of threads and the number of accesses according to size of the Big Data. However, the JDI-based Hadoop framework with the intrusive analyzer has a greater execution time than the pure Hadoop framework. In the future, we will seek a solution to reduce the time overhead for the suggested Hadoop framework.
Footnotes
Conflict of Interests
The authors declare that there is no conflict of interests regarding the publication of this paper.
Acknowledgments
This research was supported by the Korea Evaluation Institute of Industrial Technology (KEIT) under “the Development of Verification System for Mid-Sized IMA Project” (10043591) funded by the Ministry of Trade, Industry & Energy and was also supported by the Basic Science Research Program through the National Research Foundation of Korea (NRF) funded by the Ministry of Education (NRF-2013R1A1A2011389).