
Abstract
This research aims to study the effect of evaporator temperature, pitch distance, and working fluid on the internal flow pattern and the heat transfer characteristics of the helical oscillating heat pipe. A Pyrex tube with an inner diameter of 2.4 mm was used to study the flow pattern in the evaporator section. The pitch distance varied at 1, 1.5, and 2 cm. Water and R-123 were used as working fluid with a filling ratio of 80% by total volume. In the evaporator section, the water temperature varied at 60, 75, and 90°C to supply heat to the heat pipe. In the condenser section, air with a temperature of 25°C was used as heat sink. From the results, it was found that 4 internal flow patterns, bubble flow, slug flow, annular flow, and stratified wavy flow, were observed in the evaporator section for both working fluids. The heat transfer rate decreased when the pitch distance was increased from 1 to 2 cm. The maximum heat flux was 2,132.6 and 1,773.4 W/m2 for the working fluid of R-123 and water, respectively. Both occurred at a pitch distance of 1 cm and an evaporator temperature of 90°C.
1. Introduction
The pulsating or oscillating heat pipe (OHP) is a type of high-performance heat pipe. Akachi et al. registered a patent for this type of heat pipe [1]. The projected new type of heat pipe was made of a capillary tube and was applied to reject heat from electronic devices. Gi et al. applied a closed-loop oscillating heat pipe to reject heat from the central processing unit (CPU). The OHP was made from a capillary tube with a smaller diameter than the critical diameter [2]. This capillary tube was bent for several turns between the evaporator section and condenser section. The OHP heat transferring begins with the working fluid evaporation of the liquid slugs in the evaporator section when they are heated from the environment. The vapors expand from the evaporator section to the condenser section and then they are cooled down and condensed to liquid slugs again [3, 4]. Consequently, the heat was transferred as the latent heat of the working fluid. The heat transfer performance of the OHP can be indicated by heat transfer rate at various conditions. The heat transfer characteristics of the OHP significantly depend on the internal flow pattern because each flow pattern shows different heat transfer capability. This is related to many variables such as tube inner diameter, tube length, inclination angle, evaporator temperature, and working fluid. The internal flow pattern behavior of the closed loop oscillating heat pipe (CLOHP) has been studied by several researchers [4]. Charoensawan and Terdtoon, for example, studied the horizontal CLOHP performance at normal operating conditions with the varied inner diameters, evaporator lengths, and number of turns. They found that the horizontal CLOHP performance depended on the evaporator temperature, which is related to the number of turns. The best performance of the horizontal CLOHP occurred at the maximum number of 26 turns [5]. Additionally, Bhuwakietkumjohn et al. studied the top heat mode CLOHP with check valve (THMCLOHP/CV) performance. They found that the THMCLOHP/CV performance increased when the evaporator section length was decreased. The best performance occurred when the number of check valves was 2 sets; and the maximum heat flux occurred when the working fluid was R-123 at the inner diameter of 2 mm [6]. Xu et al. visualized high speed flow in the CLOHPs with the bottom heat mode to observe the behavior of the oscillating and flow pattern [7]. Further, Yi et al. studied the heat transfer characteristics and flow patterns in the evaporator section of the loop heat pipes with small diameters; glass tubes were used in the evaporator section. They found that the total effect of the evaporator section was that a thin liquid film would be disturbed by the tube oscillation and that the minor flow would make the critical heat transfer rate and heat flux increase. Four flow patterns were observed in this study: single-phase liquid flow, bubbly flow, slug flow, and unsteady stratified flow. The slug flow was observed as the major flow pattern in the small tube (d = 4 mm) [8]. The tube oscillating directly influenced the flow pattern. Annular flow was not observed in the vertical tubes. Bhuwakietkumjohn et al. studied the effect of the variables that effected the flow pattern in the CLOHP/CV. Ethanol and ethanol mixed with nanoparticle-size silver were used as working fluids with a filling ratio of 50% by total volume. The ratio of the number of check valves to the number of turns was 0.2. The 2.4 mm inner diameter glass tubes were used for CLOHP/CVs. They found that the working fluid of ethanol mixed with nanoparticle-size silver showed a higher heat transfer rate than ethanol, and the evaporator section temperature influenced the flow patterns. When the evaporator section temperature was increased from 85°C to 105°C and 125°C, the major flow patterns were changed from annular with slug flow to slug with bubbly flow and dispersed bubble with bubbly flow, respectively [3]. Huo et al. studied the flow boiling and flow regimes in small tubes when R134a was used as working fluid. They found that the heat transfer coefficient would decrease with vapor quality when the quality was less than about 40–50%. Six flow patterns were observed in this study: dispersed bubble flow, bubbly flow, slug flow, churn flow, annular flow, and mist flow [9]. Thongdaeng et al. investigated the flow patterns and heat transfer of a THMCLOHP/CV. The heat pipe was made of a high-quality glass capillary tube with an inner diameter of 2.4 mm. The number of meandering turns was 10, and the number of check valves was 2 sets. The combined lengths of evaporator, adiabatic, and condenser sections were equal to 50 mm. R141b was used as the working fluid at a filling ratio of 50%. The heat pipe was tested at the inclination angles of 20°, 40°, 60°, 80°, and 90° and the evaporator temperature of 85°C, 105°C, and 125°C. They found that the heat flux increased when the evaporator temperature and inclination angle increased causing the average length of the vapor slug to decrease and the average velocity of the vapor slug to increase. The maximum heat flux occurred at an evaporator temperature of 125°C and an inclination angle of minus 90°.
From the literature discussed above, it can be concluded that most previous works studied the flow patterns in the general OHP. Only the paper of Yi et al. studied the heat transfer characteristics and the flow patterns in the small tube diameter of looped heat pipes. However, the flow behaviors and complicated phenomena of flow patterns were not covered or specified. As a result, this research focused on the flow behaviors and complicated phenomena of flow patterns and heat transfer characteristics of the helical oscillating heat pipe (HOHP) in order to study the effect of internal flow behavior. This is the fundamental information for further applying the HOHP efficiently.
2. The Experimental Apparatus and Analysis
2.1. Oscillating Heat Pipe
Figure 1 shows a schematic of the oscillating heat pipe. The oscillating heat pipe is a type of heat pipe with a high heat transfer rate that is used for transferring heat from the heat source to the heat sink. It is made from a capillary tube that has a smaller tube diameter than the critical tube diameter [10]. Because the OHP operation depends on alternating the formation of the vapor bubbles and liquid slugs of the working fluid in the vacuum pressure, the critical diameter defined by the axial vapor pressure must be greater than the transverse vapor pressure, as shown in (1) [10]:

where σ is liquid surface tension (N/m), ρ l is liquid density (kg/m3), and g is gravity of the earth (m/s2).
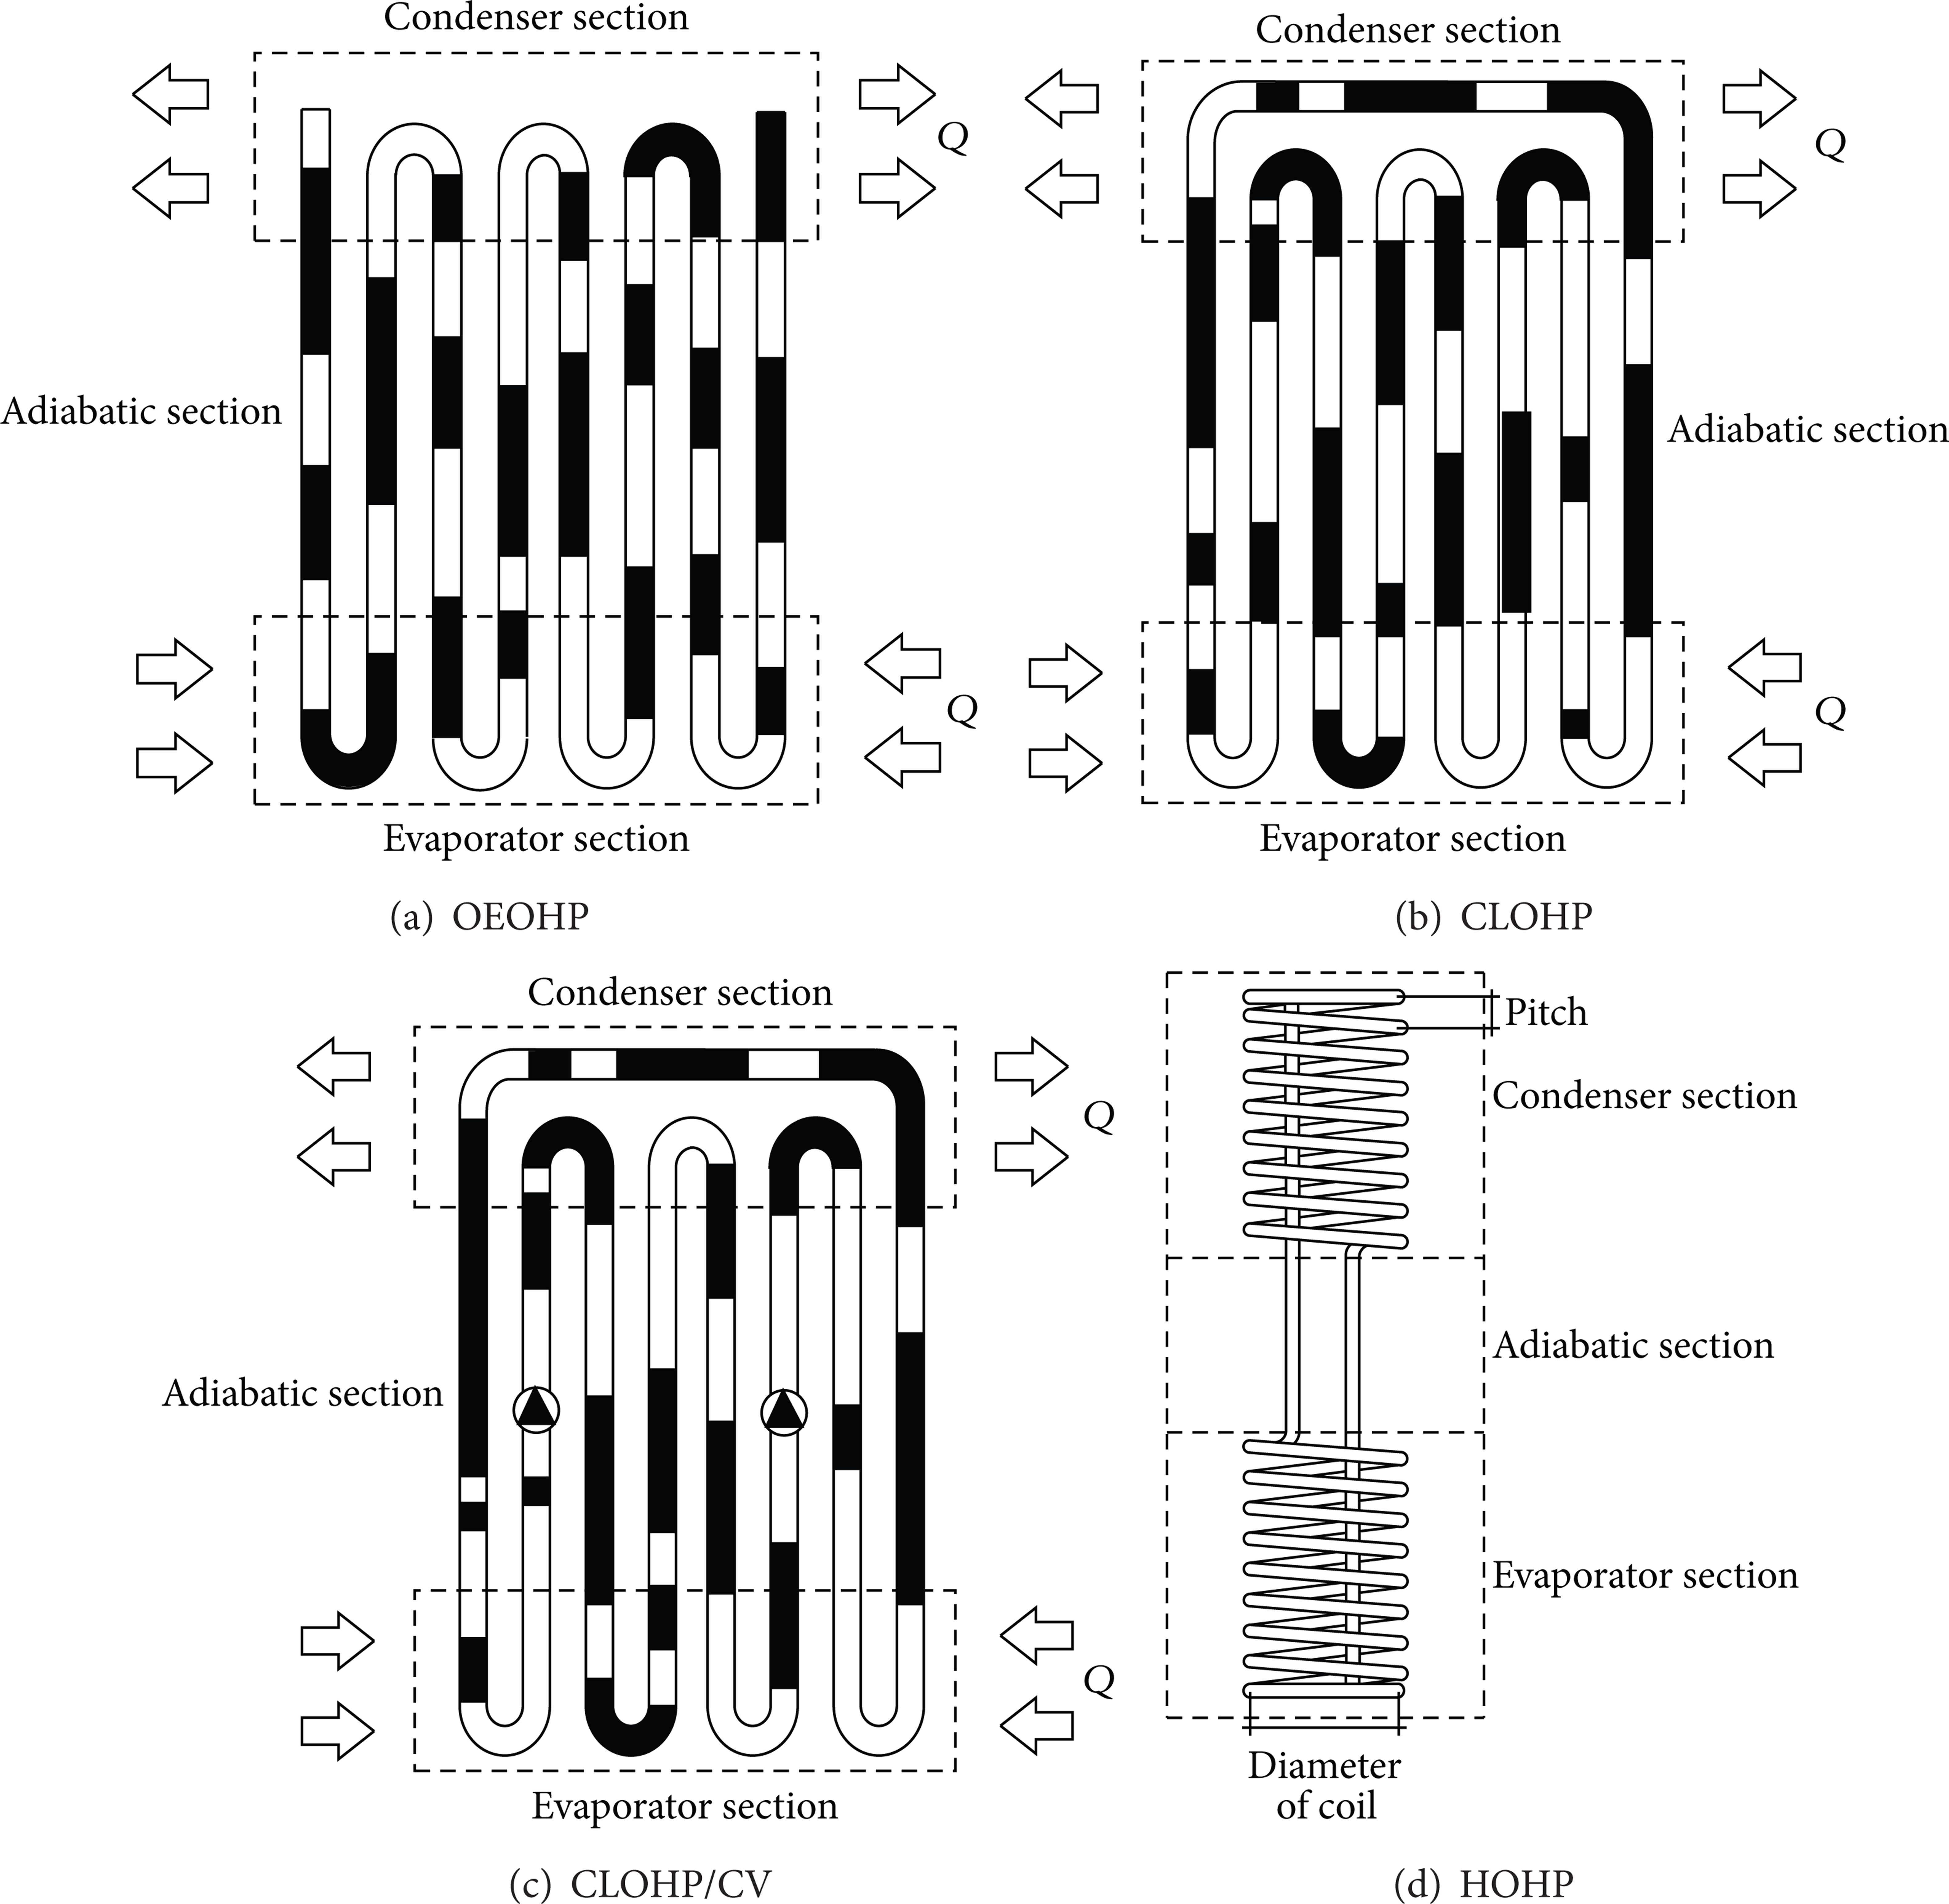
Schematic of oscillating heat pipe.
2.2. The HOHP Setup
The HOHP used in this study was made from a Pyrex tube and copper tube with inner diameters of 2.4 mm. They were bent into helical form. The HOHP consisted of an evaporator section, an adiabatic section, and a condenser section. The evaporator and condenser lengths were 51 cm and the adiabatic length was 15 cm. The Pyrex tube was connected to the copper tube by a vacuum rubber tube in order to avoid the leakage of the working fluid, as shown in Figure 2.

The HOHP used in this study.
The HOHP test set is shown in Figure 3. The HOHP was installed to the test set. It was heated by hot water in the evaporator section and was cooled by air in the condenser section.

The HOHP test set.
2.3. The HOHP Apparatus
A schematic diagram of the equipment and instrument setup is shown in Figure 4. The parameters in this study consisted of the HOHP with an inner diameter of 2.4 mm, the working fluids were water and R-123, the evaporator temperatures were 60, 75, and 90°C, the evaporator and condenser lengths were 51 cm, the adiabatic length was 15 cm, the pitch distance was 1, 1.5, and 2 cm, and the inclination angle was 90° from the horizontal plane. The considered parameters were internal flow patterns and heat transfer rates. The coil diameter, condenser temperature, and air velocity in the condenser section were fixed at 5 cm, 25°C, and 1 m/s, respectively. The filling ratio was 80% by total volume and the evaporator section was at the bottom.
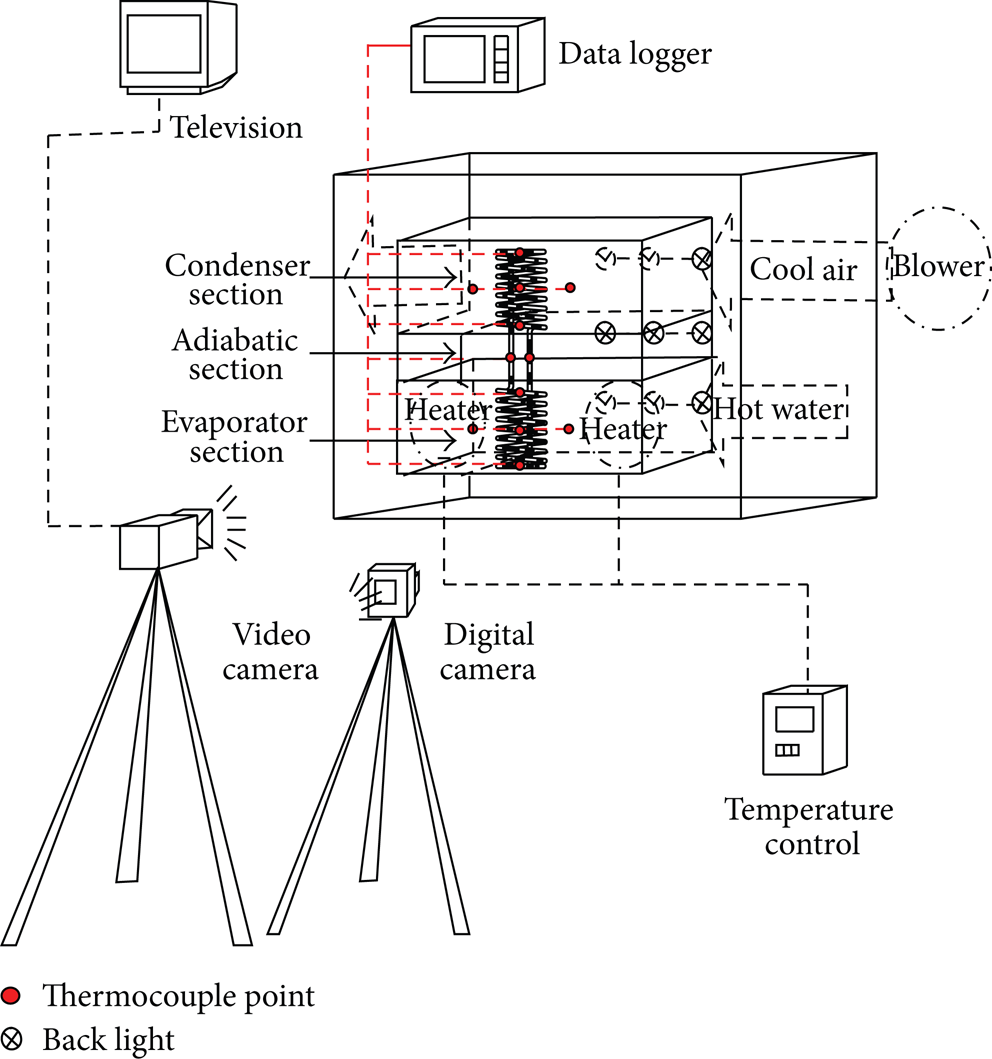
The schematic diagram of the equipment and instrument setup.
In the experiments, the evaporator section of the HOHP was installed to test the set, as shown in Figure 4. The Pyrex tube of the evaporator section soaked in the hot water within the acrylic box. The water was heated with a heater and its temperature was controlled by temperature control. In the condenser section, the copper tube was cooled by air and its flow rate was controlled by a dimmer. Two groups of data were gathered as follows. Temperature data were measured by 12 type K-thermocouples with ±1.5°C accuracy and then were recorded using a data logger (Yokogawa DX 200) with ±1°C accuracy. Velocity data were measured by Testo 445 with ±0.2 m/s accuracy. The temperature measure points were as follows: a point in evaporator section, 3 points in the condenser section, 2 points in the adiabatic section, 3 points at the air inlet of the condenser section, and 3 points at the air outlet of the condenser section. These temperatures were used to determine the heat transfer rate of the HOHP with (2).
2.4. Uncertainty Analysis [11]
(i) Calculating standard uncertainty for a type A evaluation: when a set of several repeated readings were taken (for a type A estimate of uncertainty),

where n s was the number of measurements in the set.
(ii) Calculating standard uncertainty for a type B evaluation: use

where a is the semirange (or half-width) between the upper and lower limit.
(iii) Combined standard uncertainty calculated by Type A and Type B evaluations can be combined, shown by u c as follows:

Expand uncertainty, shown by the symbol U:
A particular value of coverage factor gives a particular confidence level for the expanded uncertainty. Most commonly overall uncertainty using the coverage factor k = 2, to give a level of confidence of approximately 95%. Bell [12] (k = 2 is correct if the combined standard uncertainty is normally distributed). Some other coverage factors (for a normal distribution) are
k = 1 for a confidence level of approximately 68%,
k = 2.5 for a confidence level of 99%,
k = 3 for a confidence level of 99.7%.
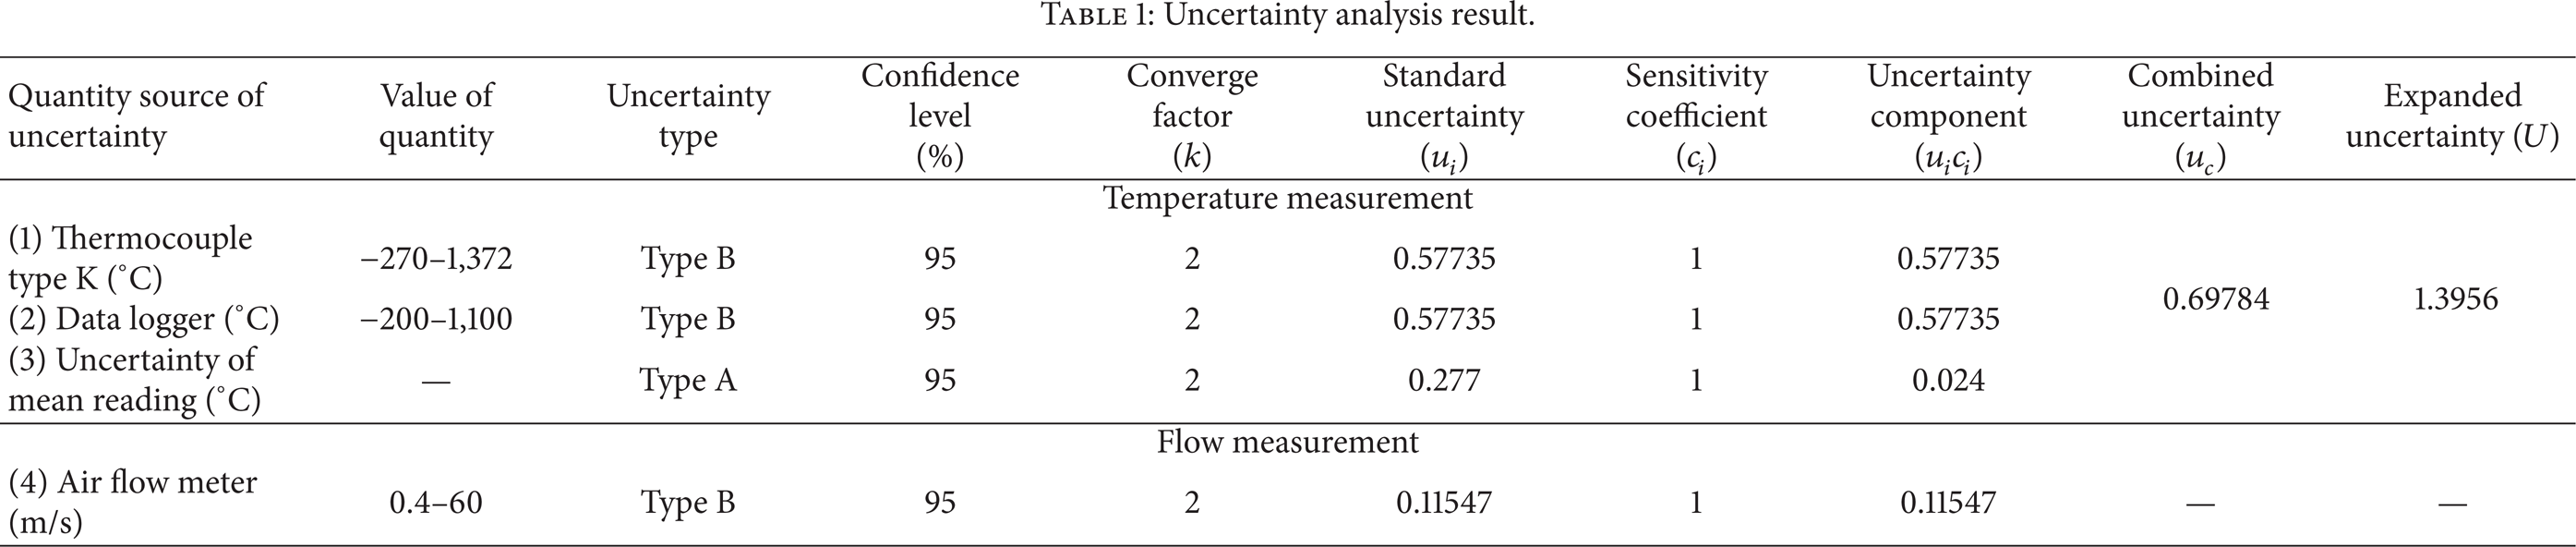
The uncertainty analysis for this study is shown in Table 1.
Uncertainty analysis result.
2.5. Heat Transfer Analysis
The heat transfer characteristics of the HOHP were begun when the evaporator section was heated. The working fluid was boiled as the vapor bubbles and then moved to the lower temperature region in the condenser section. Then heat was rejected from the vapor bubbles and they were condensed. Equation (6) can be used to determine the heat transfer rate in the condenser section by measuring the inlet and outlet air temperatures in the condenser section [13]:

where Q is the heat transfer rate (W),
The mass flow rate of the air can be determined by

where ρ is the air density (kg/m3), v is the air velocity (m/s), A is the cross-section area of air flow (m2).
And the heat flux can be determined by [4]
where q is the heat flux (W/m2), Q is the heat transfer rate (W), D o is the outside diameter of the tube (m), A c is the total outside area of the tube (m2), L c is the condenser section length (m), N is the number of heat pipes in the condenser section.
The visualization data of the HOHP were recorded by a video camera for flow pattern, continuously recorded, and a digital still camera was used for recording at specified times. The black light was attached to the back screen to control the brightness and to clearly record the flow pattern pictures. These data were used to determine the internal flow patterns and their percentages. The percentage of each flow pattern was determined by the ratio of total vapor length in each flow pattern on the total vapor length in all flow pattern multiplied by 100. The percentage of flow pattern was averaged from 10 frames of recorded video for each condition.
3. Results and Discussion
From the experiment on the effect of internal flow patterns, evaporator temperature, pitch distance, and working fluid on the heat transfer rate of the HOHP, it was found that.
3.1. Results and Discussion When the Working Fluid Was Water
Regarding the effect of the evaporator temperature and the pitch distance on the internal flow pattern at the evaporator temperature of 60, 75, and 90°C and the pitch distance of 1, 1.5, and 2 cm when the working fluid was water, there were 4 major flow patterns, as shown in Figure 5. Those were bubble flow (BF) in Figure 5(a), slug or plug flow (SF) in Figure 5(b), annular flow (AF) in Figure 5(c), and stratified wavy flow (WF) in Figure 5(d). The bubble flow was formed as the small vapor bubbles at the bottom coil of evaporator section when the heat was applied to a long liquid slug. It had the minimum fraction in all conditions of pitch distances and evaporator temperatures when the working fluid was water. The slug or plug flow was formed as the short vapor slug like the bullet shape when the vapor bubbles extended and gathered. The annular flow was formed as the long vapor slug when the short vapor slugs stretched and gathered. The slug and annular flows occurred in the coils at the evaporator section. The stratified wavy flow was formed as the long vapor slug with the liquid waves at the upper liquid-vapor interface when the vapor velocity was high. It was the main flow pattern, as shown in Table 2. The maximum fraction of the stratified wavy flow was 85.28% which occurred at the pitch distance of 2 cm and the evaporator temperature of 60°C. The second major flow pattern was annular flow. Its fraction was 44.06% at the pitch distance of 1 cm and evaporator temperature of 90°C. The third major flow pattern was slug flow. Its fraction was 7.69% at the pitch distance of 1 cm and evaporator temperature of 75°C, and the minimum fraction flow pattern was bubble flow. Its fraction was 0.81% at the pitch distance of 2 cm and the evaporator temperature of 60°C. The maximum heat flux was 1,491.4 W/m2. It occurred at the pitch distance of 1 cm and evaporator temperature of 90°C. The minimum heat flux was 427.2 W/m2. It occurred at the pitch distance of 2 cm and evaporator temperature of 60°C. The flow behaviors of the HOHP are shown in Figure 6. They began when the water was heated and boiled to the vapor bubbles. These vapor bubbles flew upward when new vapor bubbles occurred at the bottom of the evaporator section; as a result the bubble flow occurred. Then, the vapor was extended in length on both ends so the slug flow occurred. Then the vapor slug had still extended until the annular flow occurred. And then when the vapor slug velocity increased, the waves on the liquid-vapor interface were formed. This was the stratified wavy flow. The pressures in heat pipes were about the vapor pressures of water at the test temperatures and were shown in Table 2.
The effect of evaporator temperature and pitch distance on the internal flow pattern when water was used as the working fluid.
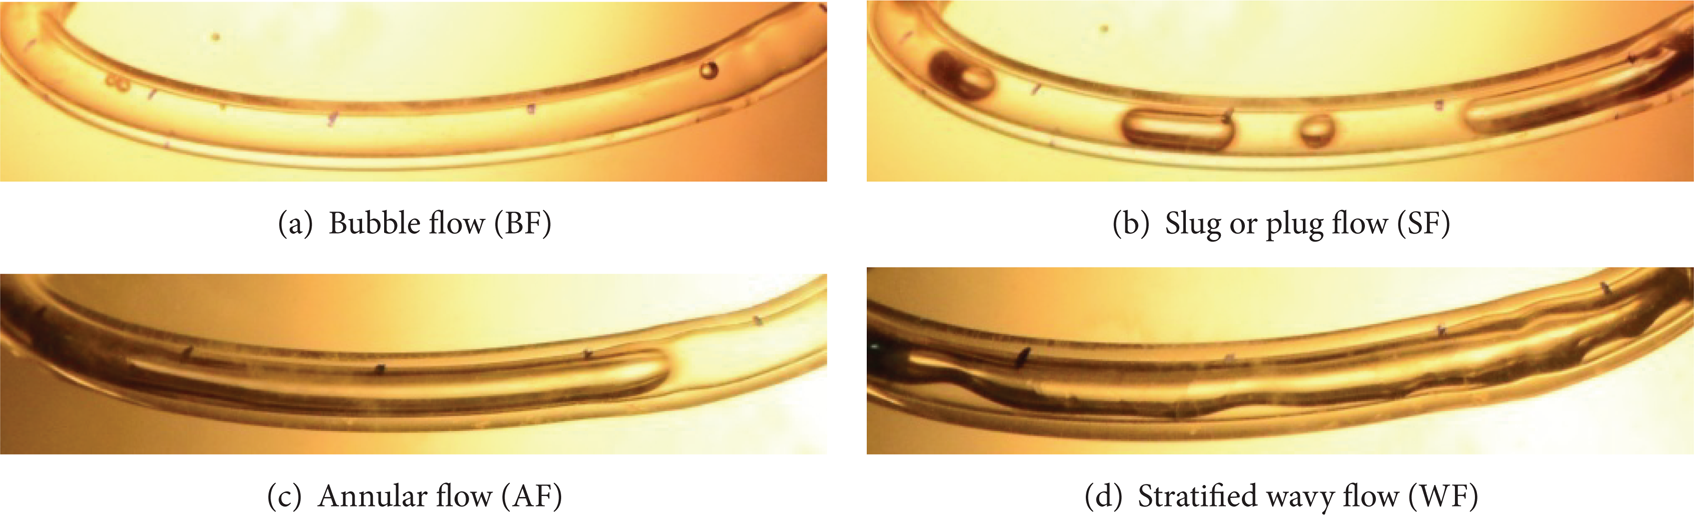
Four major flow patterns in the HOHP with the working fluid of water.

Flow behavior in the HOHP with the working fluid of water.
3.2. Results and Discussion When the Working Fluid Was R-123
Regarding the effect of the evaporator temperature and the pitch distance on the internal flow pattern when the working fluid was R-123, the flow patterns were different from the flow patterns when the working fluid was water. The flow patterns were as follows.
At the evaporator temperature of 60°C and the pitch distance of 1, 1.5, and 2 cm, there were 4 major flow patterns, as shown in Figure 7 and Table 3. The maximum fraction flow pattern was bubble flow. This occurred at the pitch distance of 1 cm and the evaporator temperature of 90°C. The second was slug flow. The third was annular flow, and the minimum was stratified wavy flow.
At the evaporator temperature of 75°C, 4 major flow patterns were found except at the pitch distance of 1 cm; the stratified wavy flow was not found.
At the evaporator temperature of 90°C and the pitch distance of 1, 1.5, and 2 cm, there were 3 major flow patterns. Those were bubble flow, slug flow, and annular flow. The stratified wavy flow was not found in any pitch distance. The maximum fraction flow pattern was bubble flow. The second was slug flow at the pitch distance of 1 cm and evaporator temperature of 90°C. The third was annular flow at the pitch distance of 2 cm and evaporator temperature of 60°C. The minimum was stratified wavy flow at the pitch distance of 1 cm and evaporator temperature of 60°C. The maximum heat flux was 1,608.2 W/m2. This occurred at the pitch distance of 1 cm and evaporator temperature of 90°C. The minimum heat flux was 482.5 W/m2. This occurred at the pitch distance of 2 cm and evaporator temperature of 60°C. The flow behavior of the HOHP with the working fluid of R-123 is shown in Figure 8. It began when the R-123 was heated and boiled to vapor bubbles. These vapor bubbles flew upward when new vapor bubbles occurred at the bottom of the evaporator section; as a result the bubble flow occurred. Then the vapor bubbles were combined and formed the slug so the slug flow occurred. Then the vapor slug was extended and combined to another slug until the annular flow occurred. Then, when the vapor slug velocity increased, the waves on the liquid-vapor interface were formed. This was the stratified wavy flow. These flow behaviors were the driving force that drove the liquid slug to move from the evaporator section to the condenser section and circulated continuously [3, 14–16].
The effect of evaporator temperature and pitch distance on the internal flow pattern when R-123 was used as the working fluid.
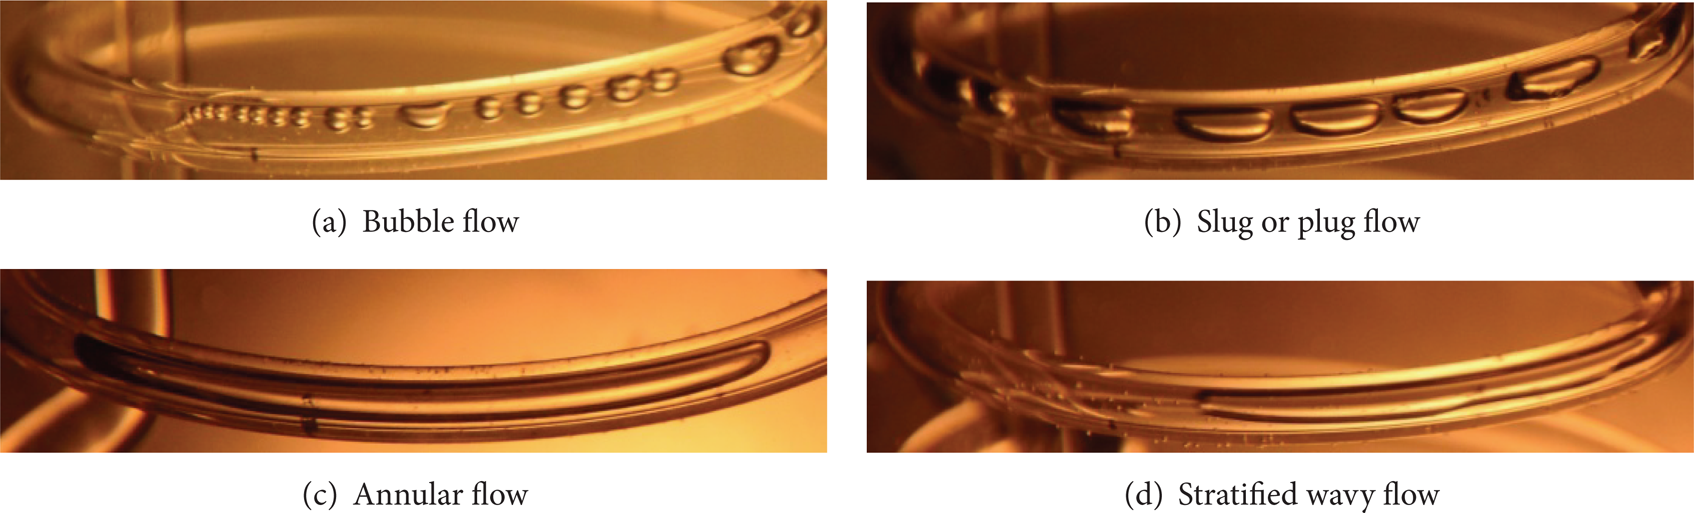
Four major flow patterns in the HOHP with the working fluid of R-123.

Flow behavior in the HOHP with the working fluid of R-123.
The pressures in heat pipes were about the vapor pressures of R-123 at the test temperatures and were shown in Table 3.
3.3. The Effect of Pitch Distance on the Flow Patterns and Heat Flux
3.3.1. Working Fluid of Water
From the result, it was found that when the pitch distance increased, the stratified wavy flow pattern percentage was increased. Because when the pitch distance increased the slope of tube increased, too. So the vapor and liquid slug moved along the tube difficultly. The more driving force must be used to override the more gravity force. The vapor flowed upward with the high velocity and crossed the returned liquid. Then the waves on the liquid-vapor interface were formed. The maximum percentage of stratified wavy flow was 85.28% at the temperature of 60°C and the pitch distance of 2 cm.
For the effect of pitch distance on heat flux, it was found that when the pitch distance increased, the heat flux decreased, because when the pitch distance increased the slope of tube increased, too. So the vapor and liquid slug moved along the tube to the condenser section difficultly. At the temperature of 90°C, the heat flux was 1,773.4 W/m2, 1,442.5 W/m2, and 1,321.4 W/m2 when the pitch distance increased at 1, 1.5, and 2 cm, respectively.
3.3.2. Working Fluid of R-123
From the result, it was found that when the pitch distance increased, the stratified wavy flow pattern percentage was increased while the other flow pattern percentages decreased, because when the pitch distance increased the slope of tube increased, too. So the vapor and liquid slug moved along the tube difficultly. The more driving force must be used to override the more gravity force. The vapor flowed upward with the high velocity and crossed the returned liquid. Then the waves on the liquid-vapor interface were formed. The main flow pattern in these cases was bubble flow. The maximum percentage of bubble flow was 48.28% at the temperature of 90°C and the pitch distance of 1 cm.
For the effect of pitch distance on heat flux, it was found that when the pitch distance increased, the heat flux decreased, because when the pitch distance increased the slope of tube increased, too. So the vapor and liquid slug moved along the tube to the condenser section difficultly. At the temperature of 90°C, the heat flux was 2,132.6 W/m2, 1,755.1 W/m2, and 1,605.2 W/m2 when the pitch distance increased at 1, 1.5, and 2 cm, respectively.
4. Conclusions
From the research on the effect of evaporator temperature, pitch distance, and working fluid on the internal flow patterns and the heat transfer rate of the HOHP, it was found that when water and R-123 were used as working fluid, there were 4 internal flow patterns. Those were bubble flow, slug flow, annular flow, and stratified wavy flow. The flow patterns from each working fluid were different. When R-123 was used as the working fluid, the maximum fraction flow pattern was bubble flow, while the minimum fraction flow pattern was stratified wavy flow in the evaporator section. When water was used as the working fluid, the maximum fraction flow pattern was stratified wavy flow, while the minimum fraction flow pattern was bubble flow in the evaporator section. The flow behaviors of the two working fluids were also different. For the water, when it was heated, the bubble flow occurred and then was extended on both ends until the slug flow occurred. Then the vapor slug was still extended until the annular flow occurred and when the vapor slugs were combined, the pressure would increase. This was the driving force on the liquid-vapor surface, and then the stratified wavy flow occurred. For the R-123, when it was heated, the bubble flow occurred. Then the vapor bubbles were combined and formed the slug so the slug flow occurred. Additionally, the vapor slug was extended and combined with another slug until the annular flow occurred, and when the vapor slugs were combined, the pressure would increase. This was the driving force on the liquid-vapor surface, and then the stratified wavy flow occurred. These flow behaviors were the driving force that drove the liquid slug to move from the evaporator section to the condenser section and circulated continuously. Regarding the heat transfer rate, the maximum heat flux was 2,132.6 W/m2, which occurred when R-123 was used as the working fluid at the pitch distance of 1 cm and the evaporator temperature of 90°C. The maximum heat flux when water was used as the working fluid was 1,773.4 W/m2 at the pitch distance of 1 cm and the evaporator temperature of 90°C.
Conflict of Interests
The authors declare that there is no conflict of interests regarding the publication of this paper.
Footnotes
Acknowledgments
This research work was done at the Heat Pipe and Thermal Tool Design Research Unit (HTDR), Faculty of Engineering, Mahasarakham University, Mahasarakham, Thailand. The authors would like to express their appreciation to Rajamangala University of Technology Lanna for providing financial support for this study.