
Abstract
Based on the design theory of liquid-solid two-phase flow centrifugal pump, a new type TLB600-700 desulphurization pump was designed with huge distortions blades design method and impeller inlet super long extension blades design method. Three-dimensional model of internal flow field in TLB600-700 desulphurization pump was built by software PROE5.0, and the three-dimensional unsteady numerical simulation of the internal flow field was calculated, which revealed that the rotor-stator interaction between rotating impeller and volute is the reason why unstable flow generated. Statics analysis was carried out on the impeller in the stationary flow state with the method of fluid-structure interaction, and results indicated that the impeller strength and stiffness meet the design requirements. External characteristic test results of TLB600-700 desulphurization pump showed that all parameters of desulphurization pump designed by innovative method meet design requirements; especially the pump efficiency was increased by 4.15% higher than Chinese national standard.
1. Introduction
Electric power industry has large coal consumption, which makes it the main department for sulfur dioxide discharge reduction. As a result, coal-fired power plant desulfurization becomes the key to control air pollution naturally. The limestone-gypsum wet flue gas desulfurization method is the most widely used desulfurization technology all over the world currently, and the desulphurization pump is the core device of limestone-gypsum wet flue gas desulfurization unit for thermal power plants, its performance directly affects the control and slowdown of environmental disaster [1, 2]. As a consequence, the research of internal flow field and structure stress characteristics of desulphurization pump could ensure that is the product is operating in a stable, reliable, and efficient way, which will be of great significance for energy conservation and emissions reduction of coal-fired power plant and environmental protection [3–5].
At present, efficiency indicators of most large desulphurization pumps cannot meet the design requirements, because the unit system is strict with the pump efficiency. Long-term operation of the pump takes up the main system power consumption, and the unqualified efficiency indicators will increase the power plant operation cost, which will affect the economic benefits. According to statistics, customer's requirements for large desulphurization pump efficiency are above 85%. As a result, improving the efficiency of large desulphurization pump could promote energy conservation and emissions reduction of electric power industry in our country. What is more, it has important practical significance for improving the industry economic benefit and social benefit.
2. Design Methods
During the traditional impeller design process, the problems of energy loss caused by balance hole leak and pump efficiency decrease caused by back blades appear inevitably, which will seriously affect the transmission performance of a centrifugal pump [6–8]. The Bézier curve applied to two dimensional graphics applications was introduced to the huge distortions blades design process to solve these problems. Each vertex of the Bézier curve has two control points used to control the radian of curve on both sides of the vertex, which can help to control the distortion degree of the blades properly. The huge distortions blades design method utilizes the control of Bezier Curve in order to realize the blades huge distortions shape, which will make the blades streamline more suitable for the moving streamline of transmission medium. In this way on one hand the frictional loss of conveying process could be reduced; on the other hand, the transmission effect could be improved, which can improve the hydraulic performance of centrifugal pump greatly.
The gist of impeller inlet super long extension blades design method is to make the blades of impeller inlet extension to the pump inlet, the extended blades play the role of divide flow and drainage, which amount to adds a vortex loss eliminator to the pump inlet. In this way not only the vortex loss and noise at pump inlet could be reduced, but also the centrifugal pump efficiency could be increased.
3. Three-Dimensional Model and Grid Generation
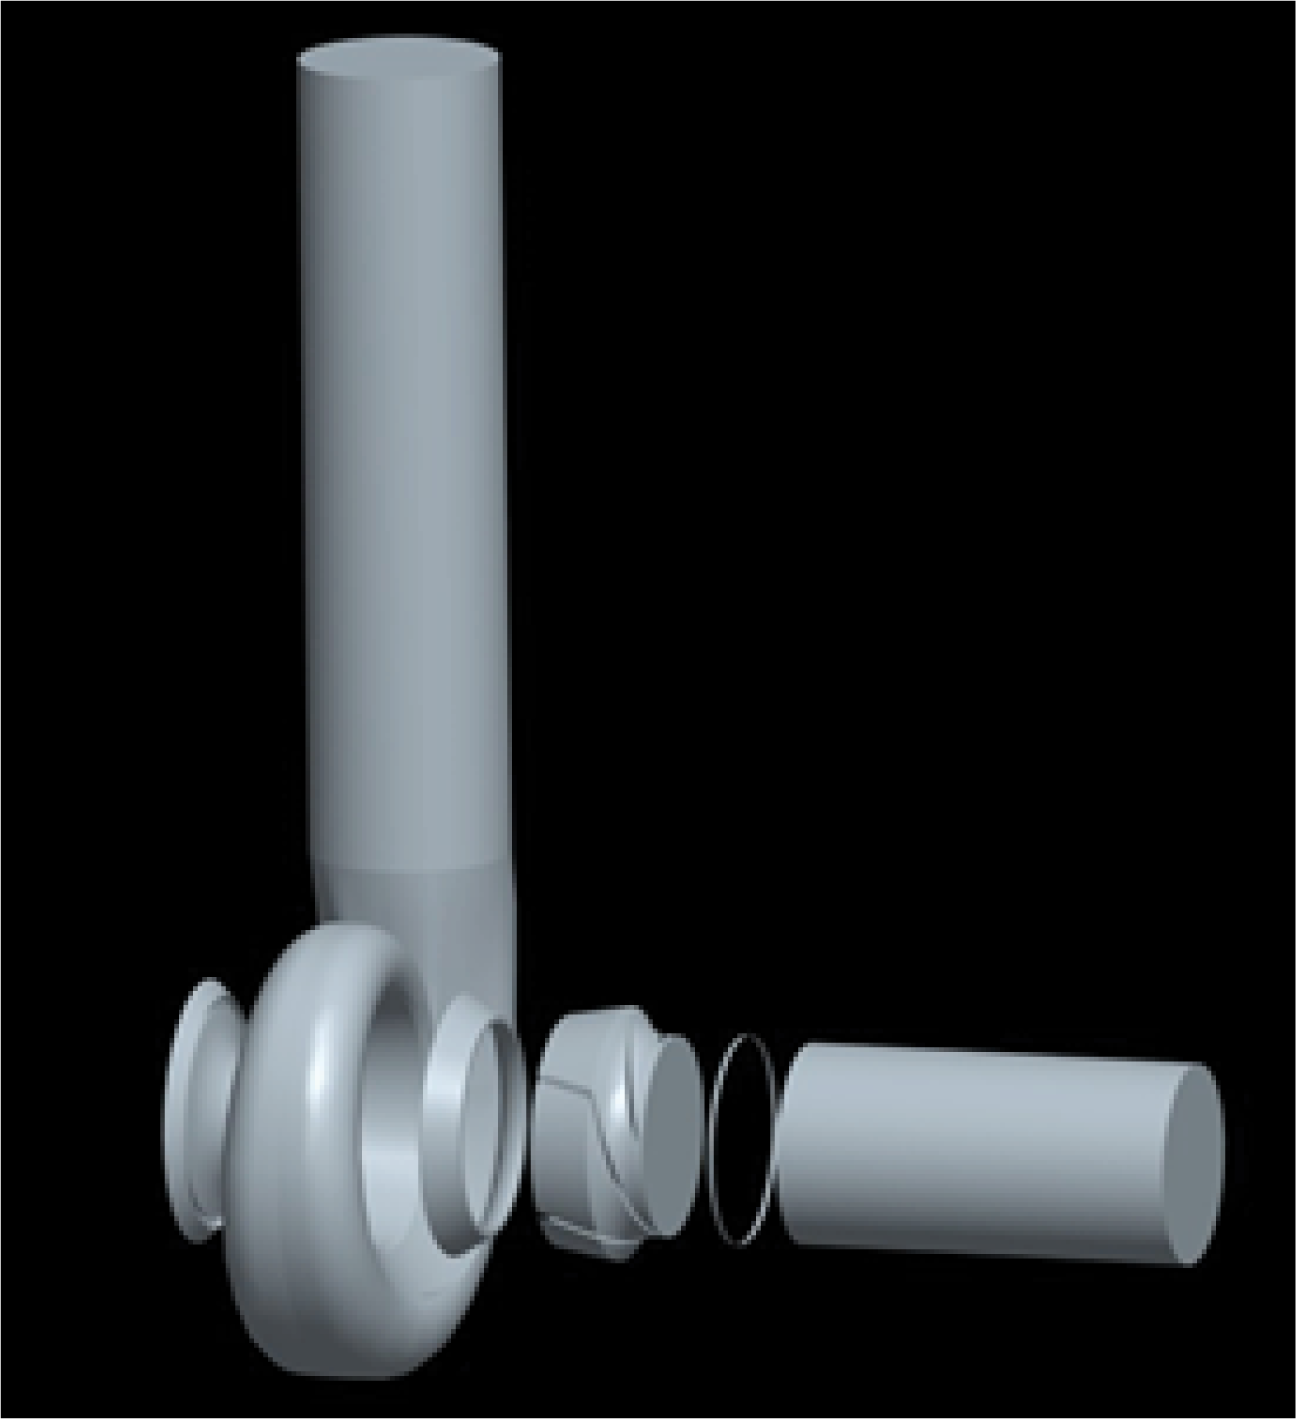
Fundamental performance parameters of TLB600-700 desulphurization pump are shown as follows: designed flow Q = 4800 m3/h, head H = 25 m, speed n = 745 rpm, Efficiency η = 83%, input power P = 450 kW, and blades number z = 5. The internal three-dimensional flow field of model pump was built based on the hydraulic model of TLB600-700 desulphurization pump. In order to make the numerical simulation more close to the real situation, import and export of the pipelines were extended appropriately [9, 10]. Hydraulic model of TLB600-700 desulphurization pump is shown in Figure 1. Three-dimensional model of TLB600-700 desulphurization pump internal flow field is shown in Figure 2.

Hydraulic model of TLB600-700 desulphurization pump.
Internal flow field model of TLB600-700 desulphurization pump.
In order to analyze the influence of grid number and quality on simulation deviation, grid independence analysis was taken by comparing five group different grid numbers of the same model at design flow rate. We set the same computational model, boundary conditions, and wall roughness during the computational process, and analysis results are shown in Table 1. The change of head and efficiency obtained after numerical simulation is stable with the increase of grid number when the grid number is bigger than 3198257, which indicates that the correlation of the grid is very small at this time. In consideration of computation time and the accuracy of the flow field information, we determined 3353031 as grid number for follow-up studies. We used unstructured tetrahedral grids, and the tiny structure parts were automatically encrypted, the grid of model pump internal flow field is shown in Figure 3.
Grid irrelevance research.


Gird generation.
4. Unsteady Numerical Simulation
The unsteady numerical simulation was calculated by taking the constant steady state simulation results as the initial condition. The time required for impeller turn 3 degrees was set as a computational time step, which means that a time step is 6.7114 × 10⁻⁴ s; that is to say, the impeller rotating in a circle needs 120 time steps. SST k-ω model was selected as turbulence model, while pressure and speed were coupled with simple algorithm [11–13]. In order to get more stable results, the impeller rotated altogether 8 laps, but we took the last 2 circles as analysis results only. In other words, the total time was set as 0.64432 s. We got the position of monitoring points as shown in Figure 4.

Position of monitoring points.
Pressure fluctuation time domain diagram and frequency domain diagram of monitoring points from A1 to A8 in a cycle are shown in Figure 5. The purpose of setting monitoring points A is to monitor the pressure fluctuation caused by the rotor-stator interaction between rotating impeller and volute, the pressure pulsation of these monitoring points can reflect the characteristics of the pump fluid unsteady turbulent flow in a certain extent. In Figure 5 pressure coefficient C p = (p − Δp)/0.5ρu2, while Δp is average pressure, ρ is medium density, and u is circumferential velocity for impeller outlet [14]. Pressure fluctuation frequency domain diagram is obtained by fast Fourier transform (FFT) of time step and pressure value of each point, in the diagram AMP, means pressure pulsation amplitude.
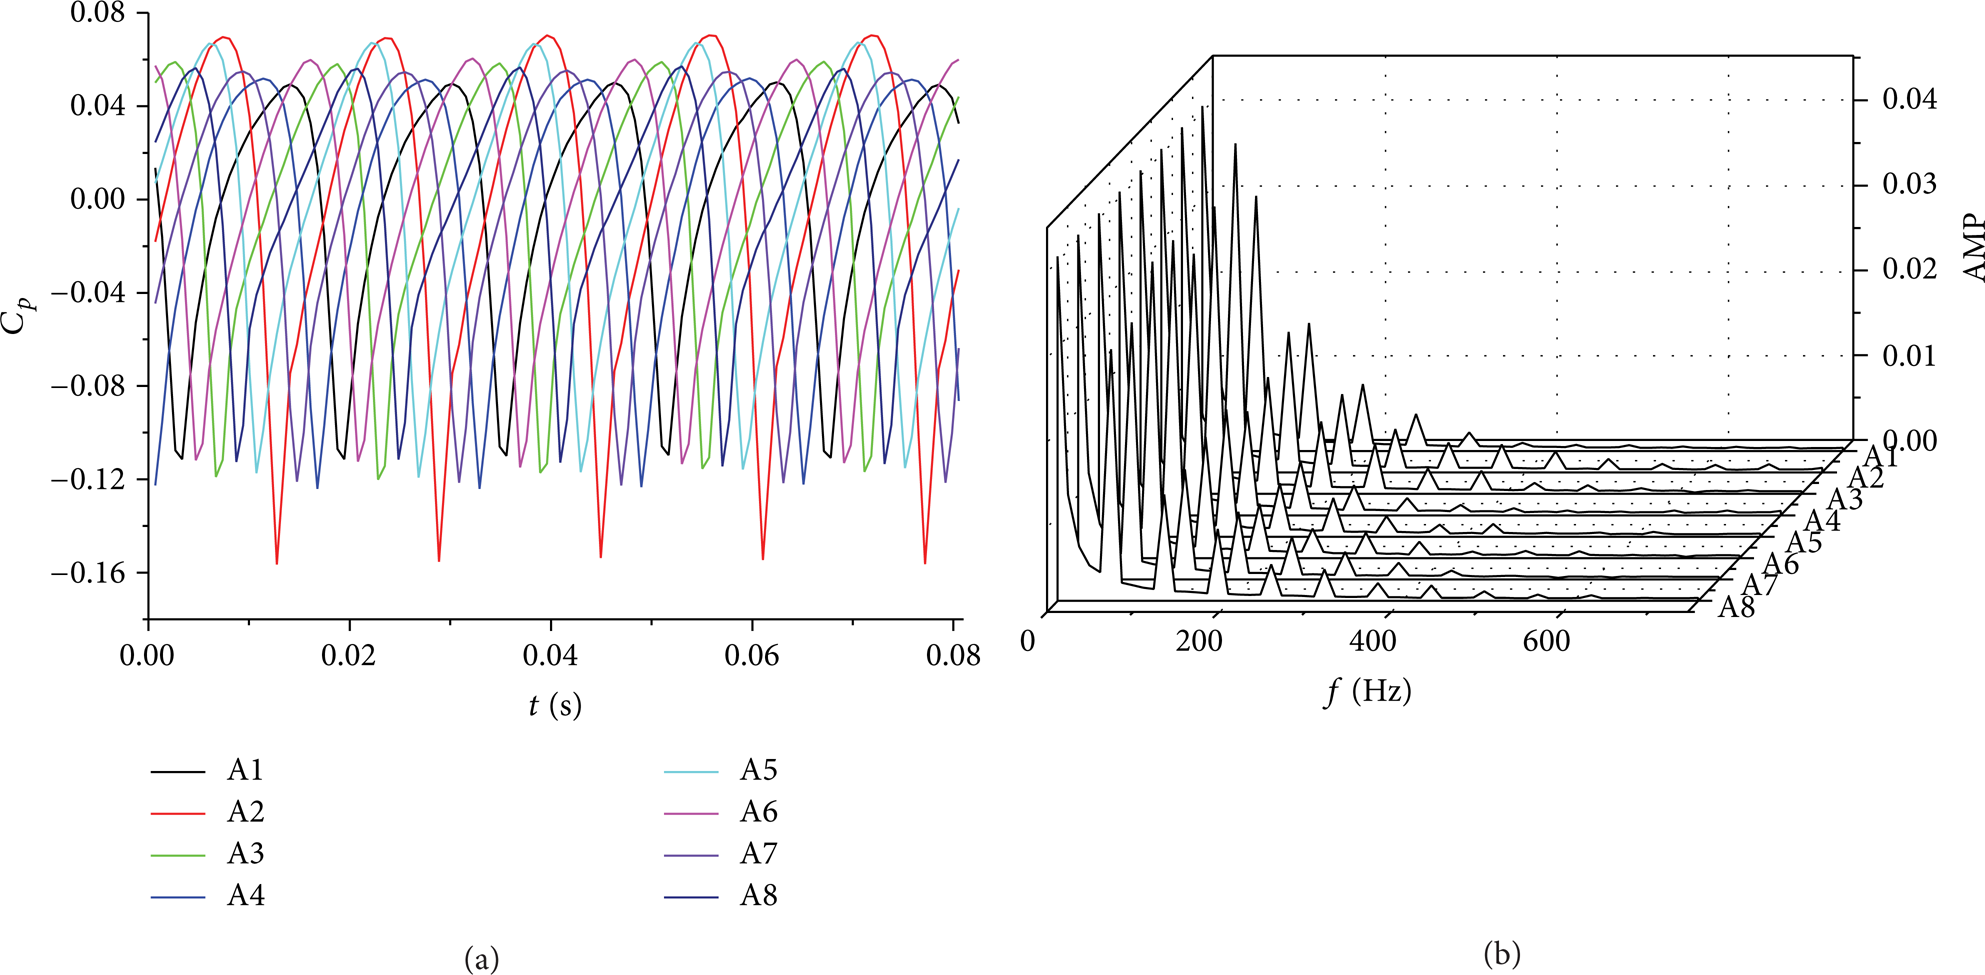
Time and frequency domain diagram of monitoring points A.
In Figure 5 we can see that pressure pulsation of monitoring points A shows a periodic change; what is more, they have similar variation rule and pressure pulsation range. Monitoring point A2 has the most obviously pressure pulsation, which means that flow at this point is more disordered, and its unsteady flow dynamic characteristic is more apparent. The AMP of monitoring point A1 is the sharpest; after analysis we know that A1 is the first point the impeller crossed after the impeller crossed the cut-water, which makes it the worst affected by the pressure fluctuation caused by the rotor-stator interaction between rotating impeller and volute.
Pressure fluctuation time domain diagram and frequency domain diagram of monitoring points from B1 to B6 in a cycle are shown in Figure 6. The purpose of setting monitoring points B is to monitor the pressure fluctuation of volute wall, as the overlarge pressure fluctuation of volute wall may cause the vibration of volute. In Figure 4 we can see that the monitoring point B2 has the shortest distance with cut-water, which causes it to have the most obviously pressure fluctuation. It can be concluded that the rotor-stator interaction between rotating impeller and volute may affect the pressure of monitoring point B2, which leads to the generation of turbulence. What is more, the pressure fluctuation of monitoring point B2 will make the pump produces vibration and noise that affect the stable operation of the pump seriously. The AMP of monitoring point B1 is second only to monitoring point B2 in Figure 6; after analysis we know that the impact of this point is so strong that vibration would appear easily. When the vibration frequency is consistent with pressure fluctuation main frequency, resonance will occur at this point.

Time and frequency domain diagram of monitoring points B.
Pressure fluctuation time domain diagram and frequency domain diagram of monitoring points from C1 to C6 in a cycle are shown in Figure 7. The purpose of setting monitoring points C besides the clapboard is to monitor the pulse change between the start and end sections of clapboard. The balance on each side of the clapboard caused by turbulent pressure pulsation could be revealed as well, which can provide some references for research on vibration distribution of the whole desulphurization pump machine. It is not hard to see that the pressure fluctuation frequency of monitoring points C is given priority with blade passing frequency in Figure 7. The pressure fluctuation of monitoring point C3 is the sharpest because the fluid in volute is pressed into inner side of the clapboard by the front clapboard, in such way the fluid in volute has to mix with fluid flow from impeller passage, and the flow at point C3 is confused. After comprehensive analysis between Figures 6 and 7, it can be concluded that the pressure fluctuation number of monitoring points is equal to the blades number.

Time and frequency domain diagram of monitoring points C.
5. Fluid-Structure Interaction Analysis
Fluid-structure interaction analysis of TLB600-700 desulphurization pump involves two aspects of flow field and structure field; the flow field is shown in Figure 2, and structure field refers to the stainless steel casting impeller. Three-dimensional model and grid of impeller are shown in Figure 8; the total number of grids is about 0.13 million. The constant calculation of fluid calculation regions is defined with pressure inlet and mass flow outlet as boundary conditions. The calculation results are imported to ANSYS Workbench; in such way the fluid-structure interaction analysis could be obtained by loading the corresponding pressure into the impeller entity part [15, 16].

Three-dimensional model and grid of impeller.
After fluid-structure interaction analysis we can get equivalent stress nephogram and deformation nephogram of impeller at design flow rate as shown in Figures 9 and 10. As we can see from Figure 9, the stress distribution on impeller is uniform and stress approximates symmetrical distribution on the blades. Although there is stress concentration phenomenon on the impeller outlet boundary, the area is so small that it can be basically ignored. The maximum equivalent stress of the impeller is 39.338 MPa, which is less than material allowable stress 550 MPa which can show that the strength of impeller meets the design requirements.
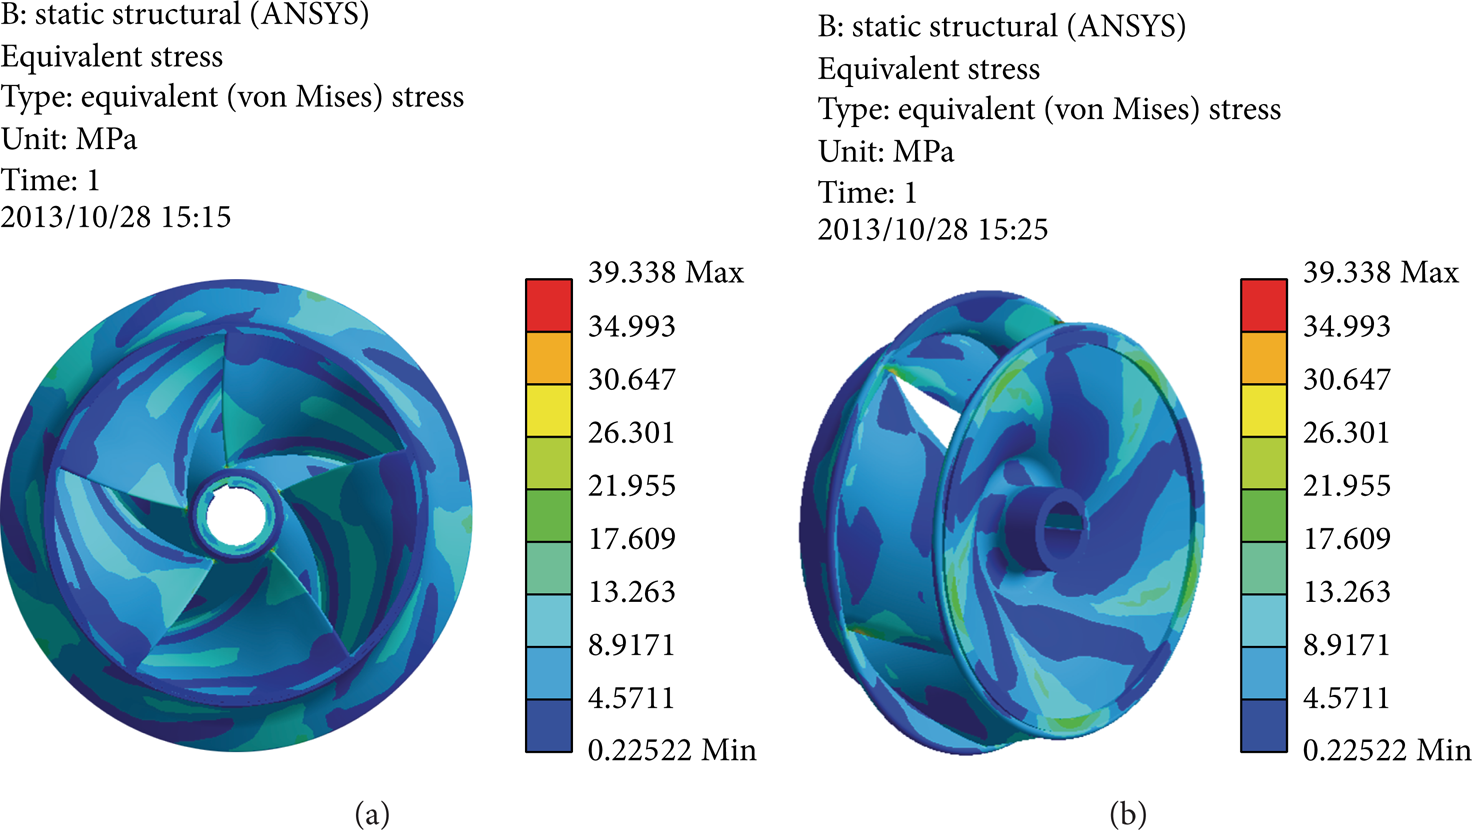
Equivalent stress nephogram of impeller at design flow rate.
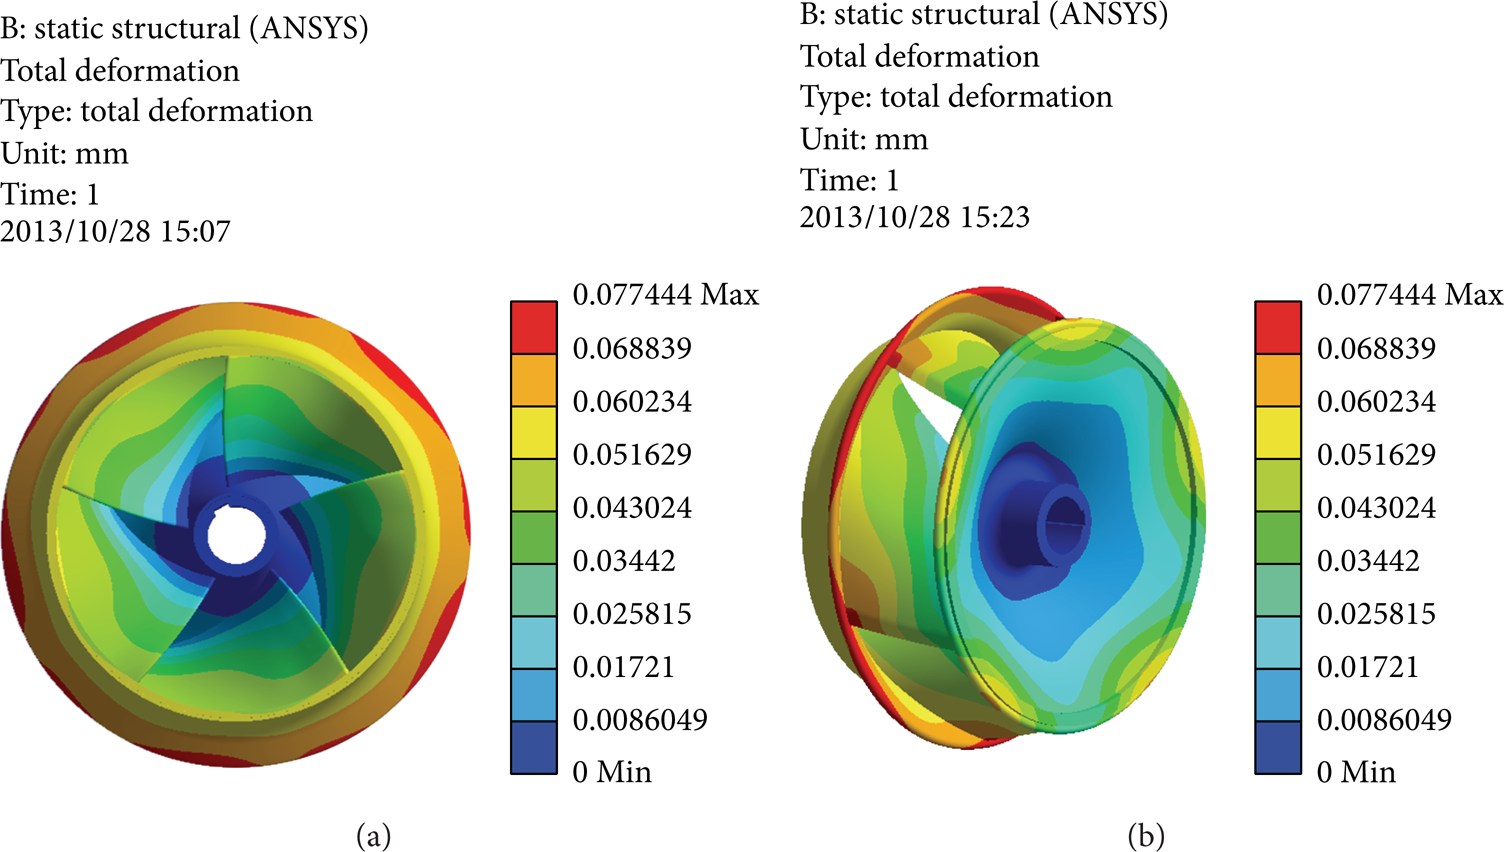
Deformation nephogram of impeller at design flow rate.
The deflection situation of impeller and location of the maximum deformation can be obtained in Figure 10; from inlet to outlet the deformation shows a trend of increase along the direction of impeller diameter and the deformation of each blade symmetrical distributed homogeneously. The maximum deformation of the impeller appears on the biggest diameter of front shroud, we may safely draw the conclusion that impeller stiffness meets the design requirements as the maximum deformation is 0.0774 mm.
6. Performance Test
The performance test of desulphurization pump was taken by adopting the method of flowingg backward in order to prevent cavitations of the pump. Pressure sensors were set in the inlet and outlet of the pump; the flow was measured by turbine flowmeter, and shaft power test used electrical measuring method. Data collection and processing equipment is shown in Figure 11.

Data collection and processing equipment of SYT type pump test bed.
Test of TLB600-700 desulphurization pump was taken according to Chinese national standards GB/T3216-2005 “Rotary power pump hydraulic performance acceptance tests levels 1 and 2” and the results showed that comprehensive technical level was approved to be qualified. Test results of the pump are shown in Table 2 and the pump testing site is shown in Figure 12, while performance curves comparison between test and simulation is shown in Figure 13.
Test results.


The pump testing site.
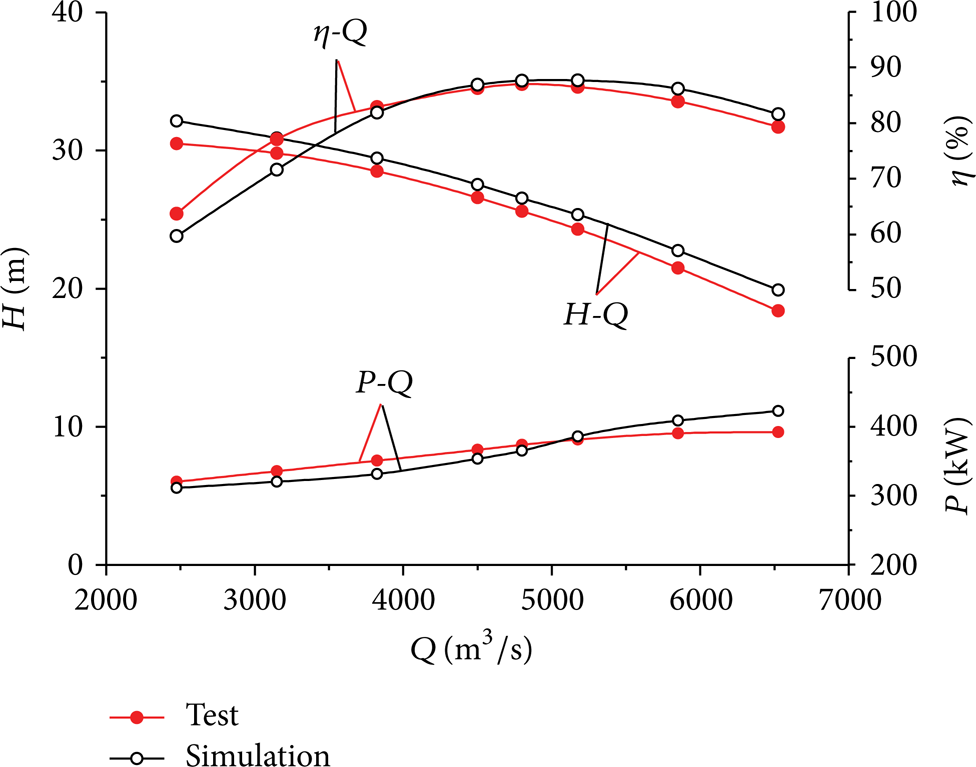
Performance curves comparison between test and simulation.
As we can see from Figure 13, trend of simulation performance curve is consistent with test performance curve, and the deviation at design flow rate is less than 3%. Under off-design conditions, results of simulation and test show little deflection. It is the unsteady flow under off-design conditions that affect the accuracy of the numerical simulation. In a word, trends of the performance curves are basically identical, which concludes that numerical simulation reflects the flow condition in the internal flow field of the pump accurately. Apparently, comprehensive technical level of the pump is approved to be qualified in Table 2; the pump efficiency is increased by 4.15% higher than Chinese national standard especially.
7. Conclusions
TLB600-700 desulphurization pump was designed with huge distortions blades design method and impeller inlet super long extension blades design method. Test results show that all performance parameters of the pump designed by innovative approach meet design requirements, especially the pump efficiency is increased by 4.15% higher than Chinese national standard.
The desulphurization pump volute unsteady pressure fluctuation characteristics are analyzed in time domain and frequency domain; it can be concluded that the pressure fluctuation number of monitoring points is equal to the blades number, which reveals that the rotor-stator interaction between rotating impeller and volute is the reason why unstable flow generated.
Fluid-structure interaction analysis of TLB600-700 desulphurization pump shows that the maximum equivalent stress of the impeller is 39.338 MPa and the maximum deformation is 0.0774 mm, which indicate that both strength and stiffness of the impeller meet design requirements.
Performance curves comparison between test and simulation shows that the deviation at design flow rate is less than 3%, which proves that the feasibility of CFD technology applies in research on internal three-dimensional unsteady turbulent flow of desulphurization pump.
Conflict of Interests
The authors declare that there is no conflict of interests regarding the publication of this paper.
Footnotes
Acknowledgments
This research is supported by Jiangsu Province Ordinary University Graduate Student Scientific Research Innovation Project (CXZZ12_0678), Science and Technology Support Program of Jiangsu Province (BE2011141), and National Science and Technology Support Program (2011BAF14B02).