
Abstract
As the specifications of personal, industrial, and medical devices become increasingly sophisticated, the demand for high power devices is also growing rapidly. Because high power supply devices are needed in order to operate high power devices with high specifications, stability and reliability are important factors to consider when it comes to high power supply devices. Therefore, there have been calls for further research on high quality power supply and monitoring system for high power supply. This paper proposes a sensor network-based smart SMPS (switch mode power supply) system. The proposed system makes power supply stable and efficient by providing output current control and sensor network-based monitoring. The functions of the proposed system were verified through both LED control simulation and monitoring simulation. The feasibility of the proposed system was also examined through various experiments and the results were discussed.
1. Introduction
The recent high specification trend among personal, industrial, and medical devices has shed light on the importance of high power supply devices. The increasing usage of high power devices has also created a growth in demand for AC-DC converters. The AC-DC converter is a switch mode power supply (SMPS) which receives alternating current power source and outputs as a continuous current in consistent amounts to operate electrical devices using DC power supply.
Since power supply devices are indispensable to computer and electronic components, stability and reliability are critical factors. The recent increase of power consumption and load emphasizes power quality. Among the possible types of damage that can be caused by power quality degradation, some of the most frequent causes that undermine industrial productivity or damage sensitive devices include interruption, sag, and swell [1]. The system configuration embedded with root mean square (RMS) calculation and analytic algorithm is required to solve such problems [2]. The damage caused by power quality degradation is also on the rise, which calls for further studies on the power quality monitoring and diagnostic system [3].
While the existing power quality monitoring and diagnostic system with its expensive equipment had an advantage in terms of analytical precision, it could not be widely used due to limited time and space which limited measurement, lack of human capital, and the resulting high costs among other drawbacks. To solve these problems, remote monitoring technology to observe power conditions in other areas was developed and many studies on cable and wireless communication technology for power monitoring were conducted [4–8].
The major cable communication methods for power monitoring include RS-485 communication which is capable of long-distance communication of up to several kilometers and IEEE1394, USB, and Ethernet communication which are used to process high capacity communication. While cable communication has an advantage in terms of quick transmission and control of large data, it also carries a disadvantage of having to reconfigure or install an additional communication line every time a new power source is needed.
The leading wireless communication methods used in power monitoring include Zigbee, Bluetooth, UWB, and Wireless-LAN. While wireless communication is flexible and expandable compared to cable communication, it has limitations of having to use only authorized frequency bandwidths as well as restraints in communication speed and range. As mobility and expandability are the key factors in communication, cable is more suitable than wireless in the communication method of power supply. Taking frequency range, communication distance, and network configuration into consideration, it is more efficient to configure the sensor network by applying IEEE802.15.4 which is sensor communication method [9].
Sensor network is in full use in smart gird applied fields such as point-of-sales (POS), remote monitoring of machines and facilities and smart meter in automatic measurement of water and electricity consumption, which is expected to expand further to various areas [10, 11]. Its service area is expanding to wider areas in connection with mobile communication such as existing 3rd generation partnership project (3GPP), telecoms and internet converged services and protocols for advanced networks (TISPAN), wideband code division multiple access (WCDMA), high speed downlink packet access (HSDPA), global system for mobile communications (GSM), wireless local area network (W-LAN), and low power communication technologies such as wireless internet, Wi-Fi, Zigbee, and Bluetooth [12–14].
This paper proposes a sensor network-based smart SMPS. The proposed system makes power supply stable and efficient by providing the function of output current control and sensor network-based monitoring. The performance of the system is verified through LED control simulation and monitoring simulation. In addition, various experiments of the proposed system are conducted and the results are given and discussed.
2. Proposed Sensor Network-Based Smart SMPS
The proposed sensor network-based smart SMPS system consists of LED control part and monitoring part as shown in Figure 1. The LED control part takes charge of output current control for efficient power supply and is composed of LED and SMPS to control it. The monitoring part is in charge of SMPS monitoring for stable power supply and is made up of the server and applications to drive it.

Block diagram of the proposed sensor network-based smart SMPS.
2.1. LED Control Part
The LED control part in charge of output current control consists of 650 W LLC HB SMPS [15], Zigbee module, 12-channel LED driver module, and LED module as shown in Figure 2. LED control part provides LED driver module and Zigbee module with DC 48 (V) obtained via SMPS from the supplied 220 (V). Composed of 1 channel per module, LED driver module provides LED module with stable currents and protective functions (Open circuit, Short circuit, and over current). The Zigbee module transmits acquired SMPS information to the server in the monitoring part.
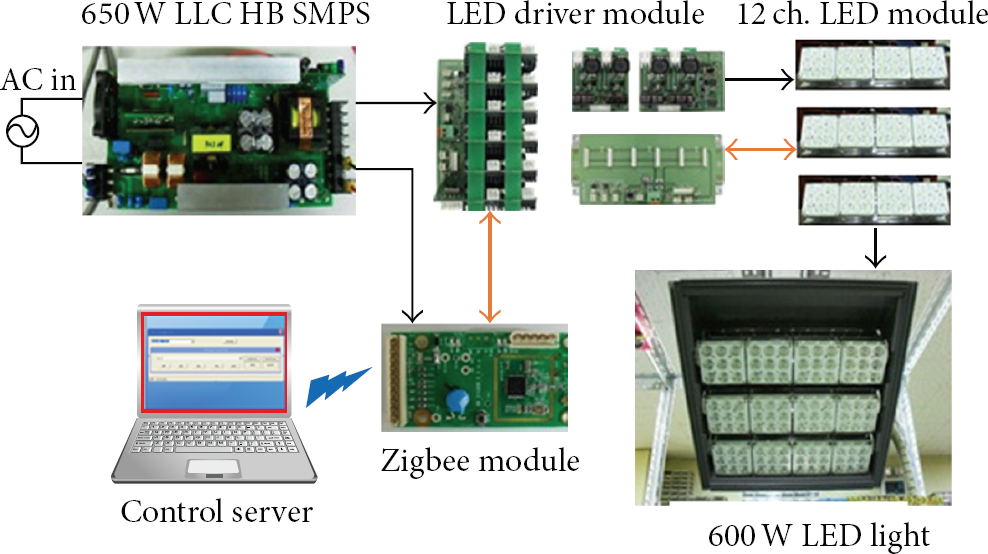
Block diagram for the LED control part.
Figure 3 illustrates the circuit diagram of 1.5 (A)/48 (V) LED driver IC which controls LED module. The operation of LED driver IC starts as 6~48 (V) voltages supplies to the VIN. The bias block generates reference voltage and reference currents in the inner circuit via VIN pin and turns on Q1 via gate driver. Once Q1 is turned on, the current flows via LED and L1, raising the turnover input voltage of the comparator as the current flow equivalent to the Rs resistance voltage difference flows through R2. R2 is the resistance with hysteresis which turns on/off Q1 according to the level of sense block, and D1 acts as a free-wheeling diode when Q1 is turned off. Finally, the output current is controlled by the LED current level which is determined by the hysteresis and Rs resistance value set internally in the LED driver IC.
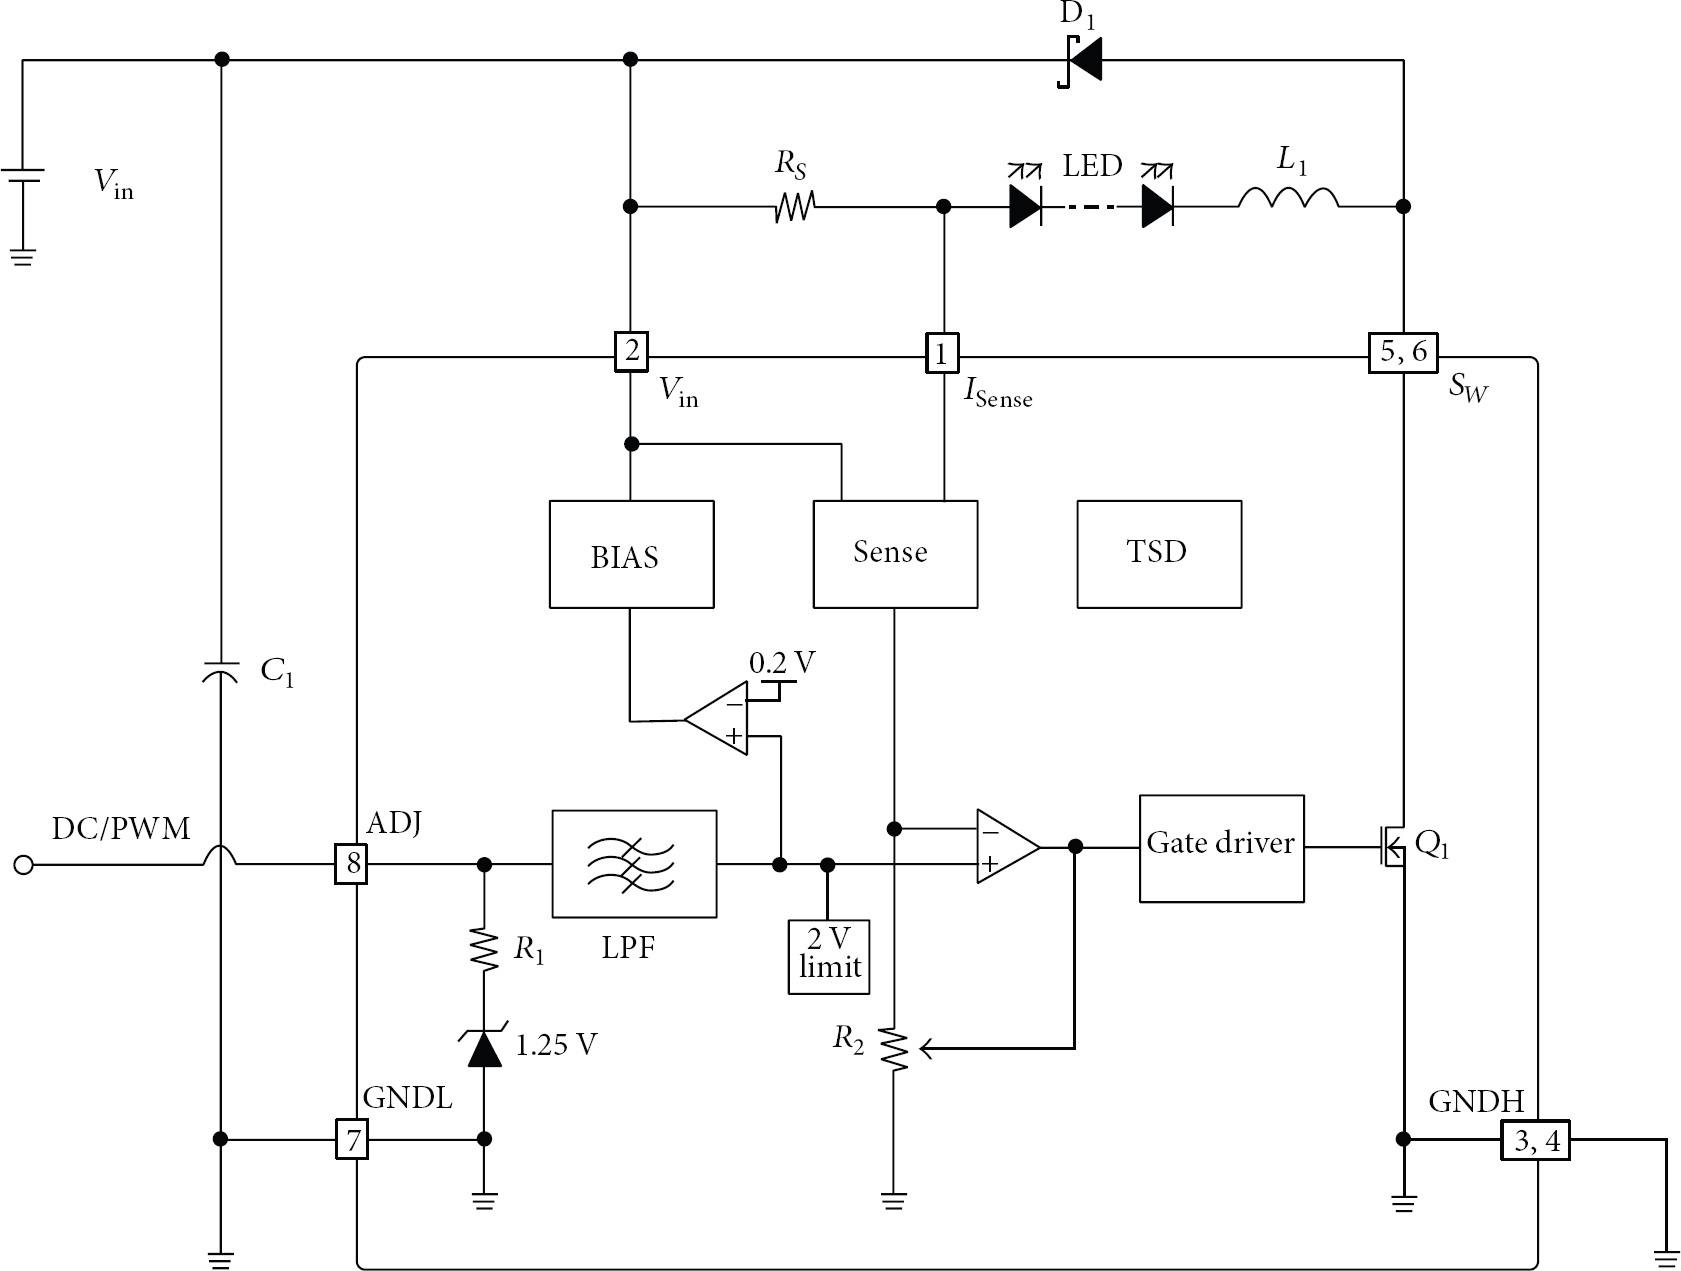
Circuit diagram of LED driver IC.
The functional diagram of multichannel LED driver module is illustrated in Figure 4. The power of the multichannel driver is supplied by SMPS. LED driver module supplies 48 (V) power to each driving channel by using 48 (V)/12 (V) dual channel SMPS. Embedded with 12 (V) to 5 (V) regulator, it takes charge of supplying power to Zigbee or wireless controlled transceiver which adopted other applications. Thermal sense block provides temperature data taken from the temperature sensing element of LED array module. The current sense and voltage sense block are the circuits which monitor the total current flow (based on each of the SMPS voltage and LED load conditions). Thus, the multichannel LED driver module monitors SMPS condition by using thermal sense, current sense, and voltage sense block data and checks LED operation in the system level through volts/currents monitoring in 12 channels of LED.
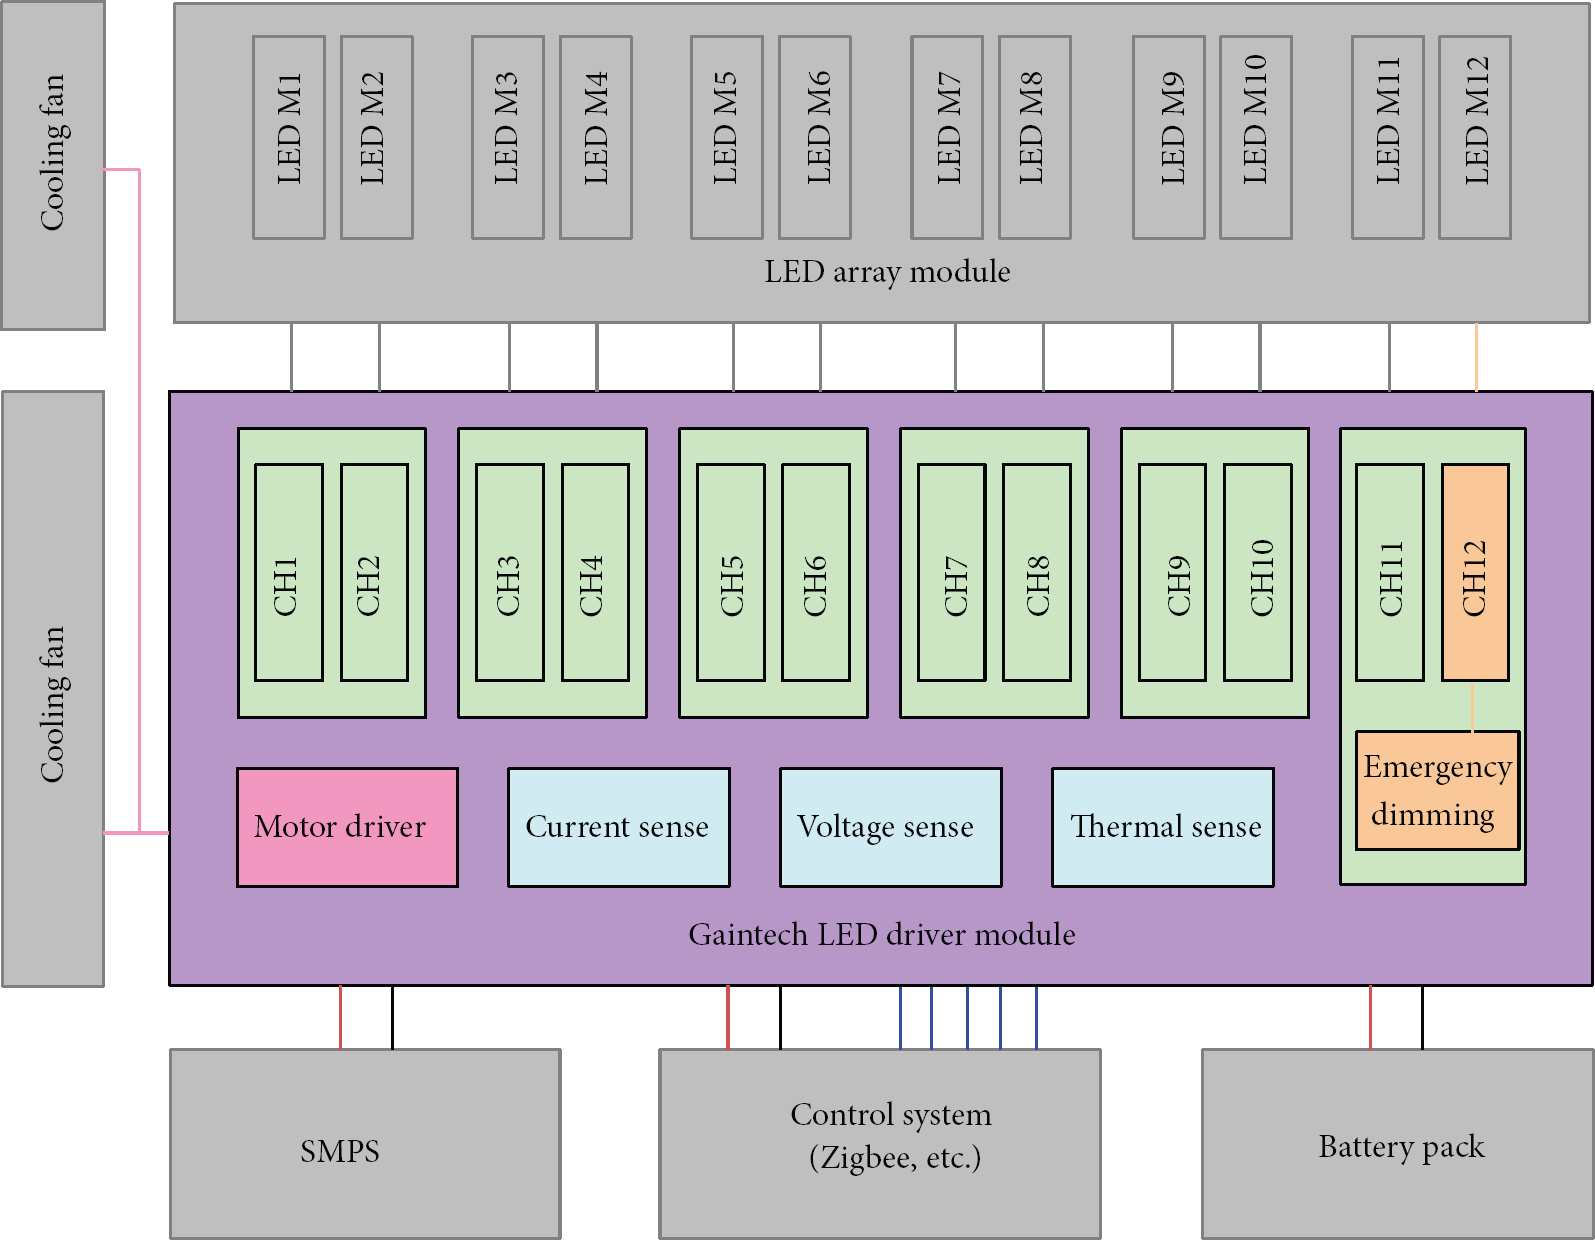
Functional diagram of multichannel LED driver module.
2.2. Monitoring Part
The monitoring part in charge of monitoring (Figure 5) consists of the control server, database server, and monitoring application. The control server in the monitoring part controls SMPS and transmits the measured SMPS state data to the database server. The database server manages the SMPS state data and provides the monitoring application with the SMPS state data. As a final step, the monitoring application provides the user with SMPS state data by visualizing SMPS state data.

Block diagram of the monitoring part.
The transfer data of SMPS can be categorized into two: configuration and measurement data of SMPS and control data to control output current. The configuration data composed of minimum/maximum value of volt/current/temperature is used as a reference to give feedback to the user from the monitoring application; the measurement data composed of measured in real time and AD-converted volt/current/temperature values is processed to provide the function of visualization and monitoring in the monitoring software. The control data of SMPS is used to dim the LED illumination by controlling output current.
Figure 6 illustrates the data flow of the monitoring part. The control server transmits the synchronization data shown in Figure 6 to register the SMPS to all the SMPSs. The SMPS which received the synchronization data transmits the acknowledgement data to the server to send a response message. On receiving the acknowledgement data, the control server registers the confirmation data in which configuration value is included at the database server and transmits the control data which requests to send real-time data to SMPS. The SMPS which received the control data keeps sending measured data to server until it gets the command to suspend transmission. The control server which received the measured data identifies the state of SMPS based on the data and transmits the classified state data (of normal state data or error state data) to the database server. After receiving the configuration data and state data from the database server, the monitoring application finally provides monitoring.

Flowchart of the monitoring part.
The Zigbee communication data (Figure 7) consists of three parts: the synchronization data for the server to recognize SMPS, the control data for the server to control SMPS, and the real-time measured data for SMPS to transmit real-time measured data to the server. The header frame of overall data is used for identification of smart SMPS system data and ID frame and ID frame for the server and each SMPS. The configuration frame in the acknowledgement data frame is used to register the fault range of the volt, current, and temperature of SMPS in the server, the control frame of the control data being used in the send/stop command of the measured data from the SMPS and the output current control of SMPS. The volt, current, temperature frame in the real-time measured data saves the AD-converted data of volt, current, and temperature. The checksum frame is used to verify the reliability of data as a reference of error detection in the communication data.

Data frame per communication type (Zigbee, TCP/IP) in the monitoring part.
The TCP/IP communication data (Figure 7) subdivides into the configuration data, normal state data, and fault state measuring data. In the case of Zigbee communication, the SMPS configuration data is registered when the control server receives acknowledgement data to register on the database server and to store configuration value (fault range of volt, current, and temperature). The control server stores the real-time measured data transmitted from the SMPS in the normal state data and manages the fault state separately from the normal state if the transmitted real-time measurement value falls under the fault range.
3. Simulation
3.1. LED Control Simulation
To verify the output current control of the proposed system, the dimming control simulation of LED driver IC was conducted. The simulation environment (Figure 8) was comprised of a power supplier (IT6721/ITEC) to supply power to the LED driver evaluation board, a digital millimeter (34401A/Agilent) to measure current, a digital oscilloscope (DSO6104A/Agilent) to measure the current flow between LED driver and LED array BOARD, a power supplier (23631A/Agilent) to control linear/PWM dimming of LED driver, and a function generator (33220A/Agilent).
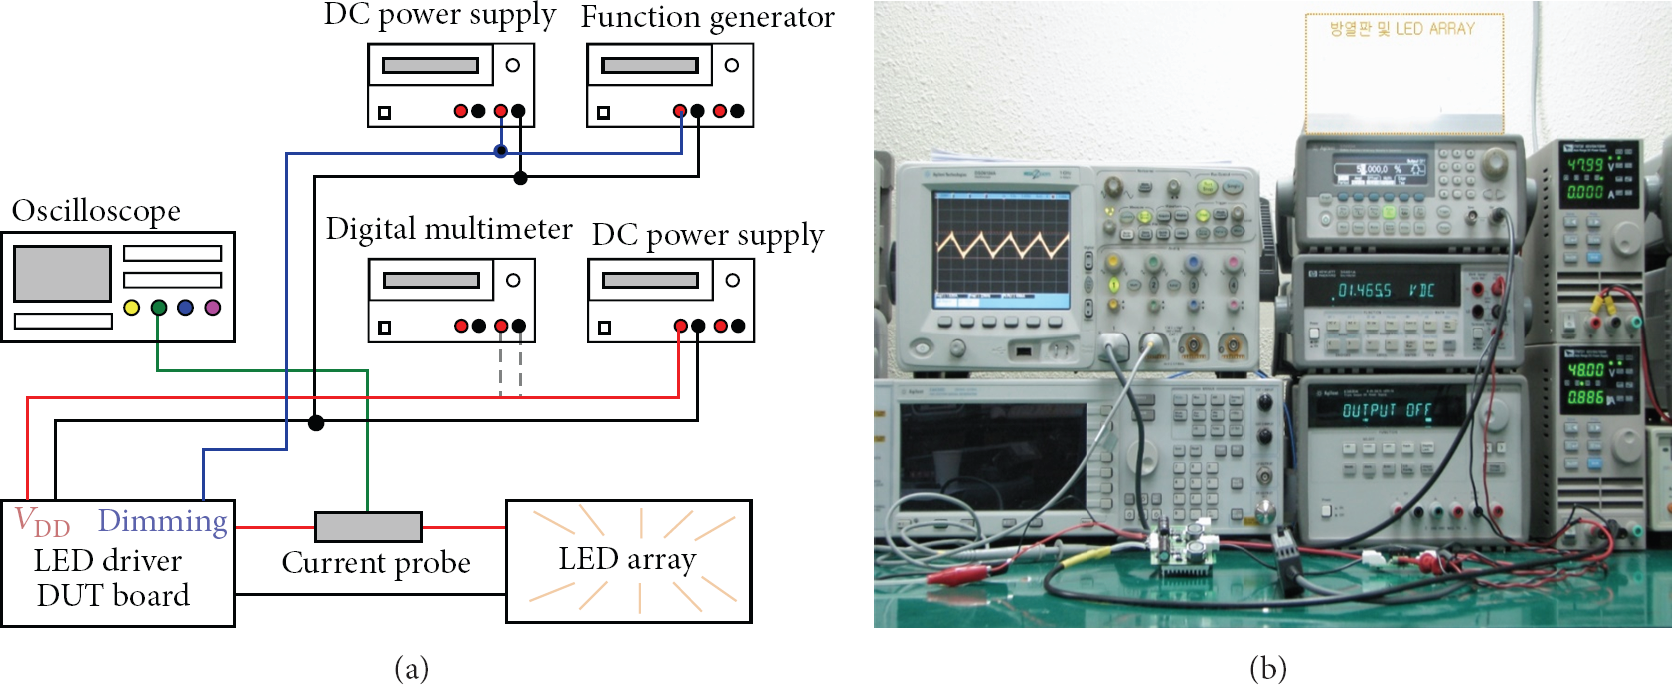
Block diagram of LED control simulation environment.
The dimming control simulation result of LED driver IC is shown in Figure 9. The result of Figure 9(a) shows switching operation in which LED current was off in the 20% section and on in the 80% section (average current 1.5 (A)). Figure 9(b) shows the current was on in the 20% section and off in the 80% section as a result of PWM 20% dimming. Figure 9(c) shows that the average current was 1.2 (A) (1.5 (A) × 0.8) in linear dimming 80%. Figure 9(d) shows that it is well operated at the average current of 300 m (A) (1.5 (A) × 0.2) in linear dimming 20%.

Dimming control simulation result of LED driver IC.
3.2. Monitoring Simulation
In order to verify the monitoring of the proposed system, the monitoring simulation was conducted. The major functions of monitoring are comprised of confirming power supply state of the SMPS and providing feedback to the user in case of fault status. To simulate these functions, sensor network environment was composed of 10 SMPSs, through which the state of the volt, current, temperature, and cooling fan was monitored.
Figure 10 depicts the sample screen of monitoring which provides the operator with the overall power supply status (10 SMPSs). It provides a high visibility monitoring environment by applying the algorithm [16] for wide-area power monitoring system to SMPS. Using the color spectrum on the top that represents the voltage stability, the screen shows overall SMPS voltage stability in different shades.

A snapshot of wide-area SMPS monitoring.
Being a monitoring screen of local SMPS, Figure 11 provides the real-time status of volt, current, temperature, and SMPS cooling fan to observe the trend data of SMPS.
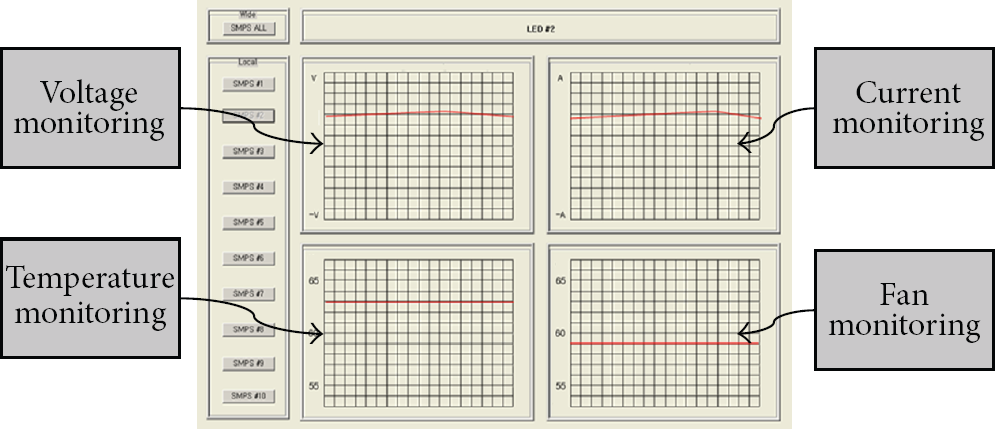
A snapshot of local area SMPS monitoring.
Figure 12 shows the SMPS monitoring screen of the smart phone environment. It displays the text and graph when the real-time measured SMPS state (volt, current, and temperature) is normal (Figure 12(a)). If the data falls under the predefined error zone, text background color is switched to red to emphasize danger (Figure 12(b)) and provides feedback to the user via smart phone vibration.

A smart phone application for SMPS monitoring.
4. Experiment and Discussion
The testbed is constructed to evaluate performance of the proposed system as shown in Figure 13. Using the constructed testbed, the first experiment was conducted to verify the driving of 500 (W) LED illumination (MLX T6 [17] by Cree) and operation of each module (SMPS, LED driver, and Zigbee). The results of the measured values are as follows: 0.97 for SMPS power factor, 550 (W) for SMPS voltage, 500 (W) for output power of LED driver, and 82% system electric efficiency. As the SMPS power factor (0.97) surpassed the level of 0.9, The Korean Industrial Standard Mark [18], the status of normal operation of SMPS was verified.

Testbed construction procedure and experiment environment.
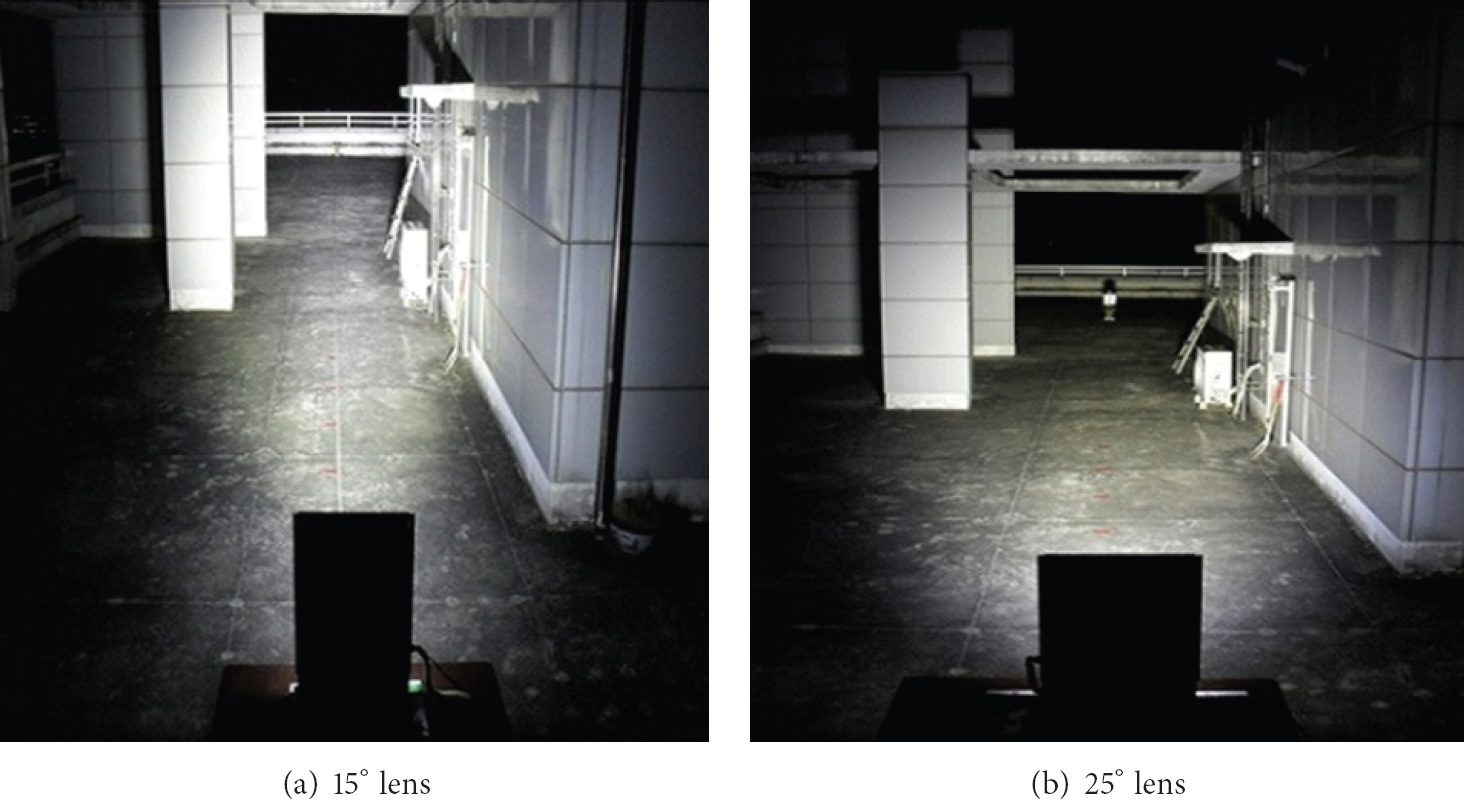
In order to evaluate the performance of LED lens according to the beam angles, the second experiment at the various beam angles was performed outdoors (Figure 14). It was measured at the beam angle of 15° and 25°, and the intensity of illumination was measured by 1 meter interval according to the change of LED lights holder angle.
Environment of intensity of illumination (gage distance 36 m/angle 0°).
The illumination measurement results by the lenses are illustrated in Figure 15. In case of 15° lens (Figure 15(a)), the results appeared as 6550 lux (10 m), 1720 lux (20 m), 750 lux (30 m), 468 lux (40 m), and 203 lux (50 m). In case of 25° lens (Figure 15(b)), they appeared as 2680 lux (10 m), 735 lux (20 m), 301 lux (30 m), 141 lux (40 m), and 96 lux (50 m). Although the performance of 15° lens appeared to be higher when compared from the measuring angle, the characteristics such as overheating and luminance efficiency must be considered in actual selection of LED lenses.

Result of illumination measurement.
The high power LED illumination bears the distinctive limitations of overheating and decline of luminance efficiency as the incoming current increases. In order to review those problems, the third experiment was conducted as shown in Table 1. The experiments were performed three times in various environments where the beam angles of the lens, cooling devices, and heat conditions vary.
Review process of overheating and luminance efficiency.

The result of overheating and luminance efficiency review is presented in Figure 16. The analysis of saturation temperature and mean access time gradient of each measured part revealed that the heat transfer varied according to parts. It also confirmed that the temperature of LED PCB junction changed as the overall saturation temperature was lowered due to the performance improvement of heat transfer channel. When the dimming was 90% and 100%, the LED chip and LED PCB showed the deviation of 6°C and 2°C, respectively, and the temperature deviation were reduced. The final finding is that the overall luminance efficiency of LED illumination can be obtained by shortening of heat transfer channel to lower the internal saturation temperature and by improving the performance of the final heat sink to the fullest.
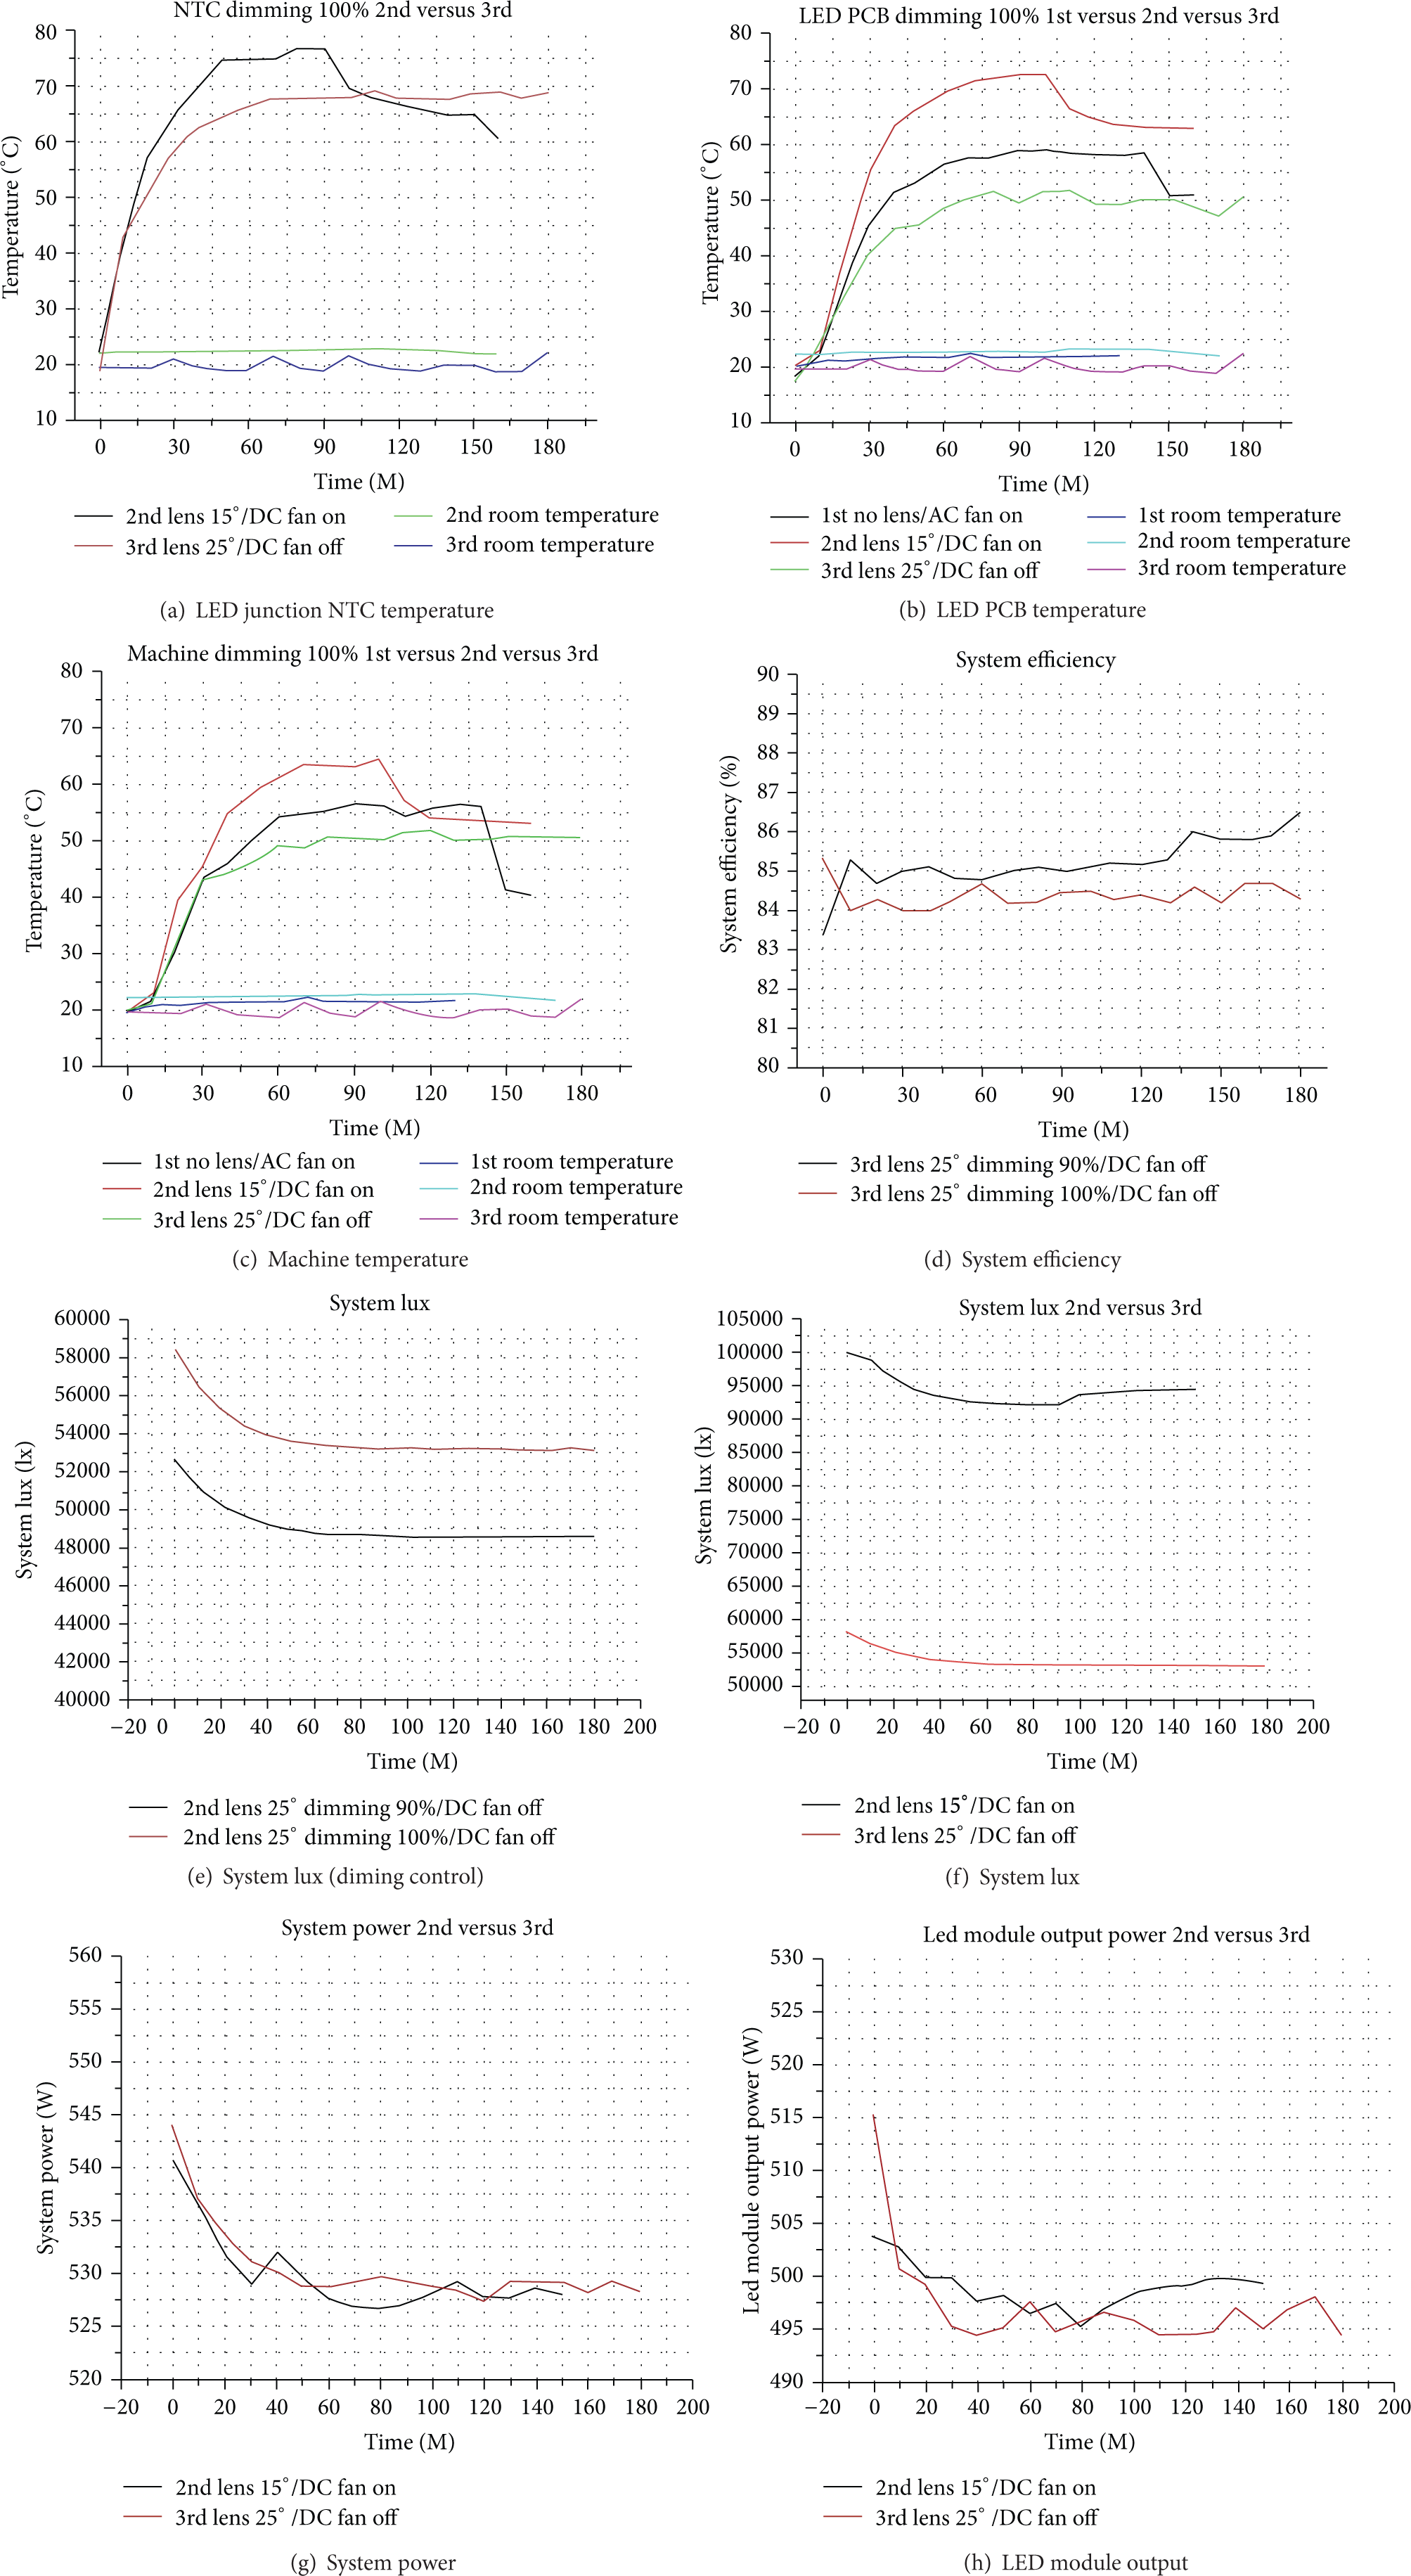
Experiment result of overheating and luminance efficiency.
5. Conclusions
This paper proposed sensor network-based smart SMPS system. The proposed system enabled stable and efficient power supply by providing output current control and sensor network-based monitoring. The output current control function was verified by the LED illumination dimming control simulation, and the monitoring function by the simulation using sensor network constructed with 10 SMPSs. In addition, the feasibility of the proposed system was discussed through the test results of LED luminance measurement performed using the testbed for efficiency evaluation. Based on the experiment using the testbed, the proposed system satisfied the Korean Industrial Standard Mark and normal operation was confirmed. In the experiment comparing luminance according to various beam angles, 15° lens delivered high performance. The experiment in various thermal conditions revealed that shortening the heat transfer channel improves the overall luminance efficiency of LED illumination devices. We expect that the technological issues discussed in this paper will contribute to the development of the smart grid applied technologies such as smart meters.
Footnotes
Conflict of Interests
The authors declare that there is no conflict of interests regarding the publication of this paper.