
Abstract
The reproducibility and reliability of quality aspects are an important challenge of the polymer laser sintering process. However, existing quality concepts and standardization activities considering influencing factors along the whole process chain have not been validated experimentally yet. In this work, these factors are analyzed and kept constant to obtain a reliable material data set for different layer thicknesses and testing temperatures. In addition, material qualities regarding powder ageing effects are analyzed using different build heights and layer thicknesses: while an increase of the layer thickness reduces mechanical part strength and density, it also results in a less intense thermal ageing of unmolten powder due to shorter build times.
1. Introduction
Polymer laser sintering is a powder bed additive manufacturing technology that promises lots of advantages compared to conventional technologies like injection molding. High part complexity and individualism as well as a rapid manufacturing of parts are the main benefits. Nevertheless there are also a lot of challenges on the way from prototyping to manufacturing technology: costs, available materials, reproducibility, and standardization of quality aspects are only some of the issues to be approached. The development of a quality management for polymer laser sintering as well as the analysis of specific powder or process parameters has been in the focus of many research projects. However, a holistic view considering the whole production chain and the experimental validation of quality assurance concepts have not been performed yet.
Therefore, the main influencing parameters along the whole process chain from the CAD data to the finished product are figured out in this work. These parameters are kept constant to obtain a reliable set of different thermal, physical, and mechanical part properties, which are required for the qualification of the manufacturing technology in the industry. For all tests, the same batch of refreshed polyamide 12 material and the “EOS Part Property Profiles” for five different layer thicknesses were used. Tensile and impact properties are given as function of different testing temperatures and used layer thicknesses as well as investigations on powder ageing effects during the build jobs.
The findings are an adequate reproducibility of build jobs on the one hand and the powder and part properties on the other hand: the higher the layer thickness, the lower the mechanical part strength and density. In contrast, a higher layer thickness also results in a less intense thermal ageing of unmolten powder due to shorter build times. The testing temperature dependency of mechanical part properties is thereby comparable to traditionally manufactured specimen. The results of this work can be used to both qualify part properties and to validate a repeatable process quality of laser sintering systems in application.
At first, the chapter state of the art will give an overview about existing related works in literature. After that, the process chain is analyzed and an overview about the most important influencing factors is given. Then, the methods for the specimen fabrication and characterization are presented and discussed. First, results of the powder and part tests are shown in the results chapter.
2. State of the Art
Polymer laser sintering is a very complex manufacturing process, which is influenced by many parameters along the process chain from the CAD model to the finished part. As a consequence, the quality of laser sintered parts is always a result of a multitude of parameters, which have to be kept constant for reproducible and robust part properties [1]. Depending on the individual application, “quality” criterions can be mechanical properties like tensile or impact behavior as well as good surface characteristics or the dimensional accuracy. To control all these parameters is still a challenge of additive technologies and is essential to use additive technologies for series production.
The influencing parameters can be categorized. For example, Schmid and Levy classified the influencing parameters into Equipment, Material, Production/Batch, and Part/Finish [2]. The material quality especially has been and is in the focus of many works: since mixtures of virgin and aged materials are used for part production, it is very important to investigate specific powder properties and correlate these with part and process characteristics. For example, the powder flowability investigated by Amado et al. [3] is important for a sufficient thin-layered powder application, while the characterization of thermal powder properties like the melting and recrystallization behavior investigated by Drummer et al. [4] is essential for choosing the right process temperatures. In addition, especially the measurement of the melt volume rate (MVR) and other rheological powder tests have been proven as methods to adjust the powder mixture ratio [5, 6] in order to influence the surface quality [7].
Regarding the production and the laser sintering process itself, the part orientation and placement within the building area as well as the process parameters, for example the laser energy density, building temperatures, scanning strategy, or the cooling procedure, are the most important influencing factors. While most of these parameters can be adjusted directly by the machine operator, other unwanted occurrences like an inhomogeneous temperature distribution on and within the powder bed lead to varying part qualities [8]. Therefore it is important to know and deal with the capability as well as the challenges of the available equipment.
As a result, the development of quality standards for the production of parts using the laser sintering technology became popular in the last years. For example, the VDI guideline 3405-1 [9] suggests specific powder characterization methods, an in-line process control, and testing of part properties to assure parts with constant properties. In addition, system requirements are stated to provide standardized reference values. Also the ASTM F42 committee is working on a specification for powder bed fusion of plastic materials.
3. Laser Sintering Process Chain
The laser sintering process chain illustrated in Figure 1 has been developed by Rüsenberg and Schmid at the Direct Manufacturing Research Center (DMRC) [1]. It considers five different steps from the CAD model to the finished product and shows relevant parameters influencing the process quality. A sixth step includes the specification of the process quality. The most important factors are described here.

Influencing factors along the laser sintering process chain.
3.1. Data Preparation
At first, a CAD model has to be generated and transferred into the STL format. Laser sintering specific design rules, for example, minimal clearances or wall thicknesses, have to be considered. The orientation of the parts as well as the positioning within the three-dimensional build area may also change part quality characteristics due to different temperature profiles, anisotropy effects, and number of hatch lines. In addition, a dimensional scaling has to be applied due to thermal shrinkage and overcure effects in the bottom layer(s) of a part.
3.2. Material
The material used has to fulfill a multitude of requirements for an optimal recoating and processing behavior: thermal and rheological properties have to be considered as well as particle properties like the size distribution and morphology. Another important aspect is the thermal ageing of the unmolten material during the build process: since recycled material is used, the history of the used powder has to be known. Instead of using a constant virgin/used powder ratio, the adjustment by rheological properties like the melt volume rate or the solution viscosity has been proven.
3.3. Preprocess/Machine Conditions
Several machine parameters like the laser power or the temperature distribution on the powder surface have to be controlled and adjusted regularly. Definite maintenance and cleaning intervals are essential for constant machine conditions. Before a build job starts, the machine has to be warmed up for sufficient heat homogeneity. The storage of the machine and the material in a constant standard atmosphere is also essential for reproducible results.
3.4. LS-Process
The laser sintering process itself can be divided into the following steps: recoating, preheating, and laser exposure, which are geared to each other precisely. Small changes in these parameters can have a significant influence. Here, the “EOS Part Property Profiles” are used, which are sets of defined process parameters to keep the process as constant as possible. For the different layer thicknesses, different recoater blade shapes are used. Thereby, especially the powder bed density can be influenced and again kept constant.
3.5. Postprocess
The most important step regarding the postprocess is the cooling of the part cake. For example, the cooling rates are dependent on the position within the part cake and the build height. The parts are unpacked only after the maximum core temperature is below the glass transition temperature of the material. If possible, the parts should be blasted automatically to eliminate any user dependency. In application, long-term ageing or strain effects must be considered.
3.6. Specification of the Process Quality
Figure 2 summarizes important key values to specify the laser sintering process quality. Existing standards and methods for the determination of part properties are mostly based on traditional manufacturing processes and have to be transferred to the laser sintering process characteristics, for example, the orientation dependency and layer thickness. Together with a documentation of the given parameters and an ongoing system analysis the evaluation of part and powder properties completes the laser sintering process chain.

Key values to specify the laser sintering process quality.
4. Specimen Fabrication
For the determination of part properties and powder analysis, two reference jobs (RJ#1 and RJ#2; see Figure 3) are designed. The parts are arranged hatch-compliant with a minimal distance of 50 mm from the frame edges. In this build area, part properties were determined as adequate homogenous in previous experiments. To keep the laser exposure time per layer constant, “dummy” parts are included and built with the same exposure parameters as the other parts, but with zero laser power.
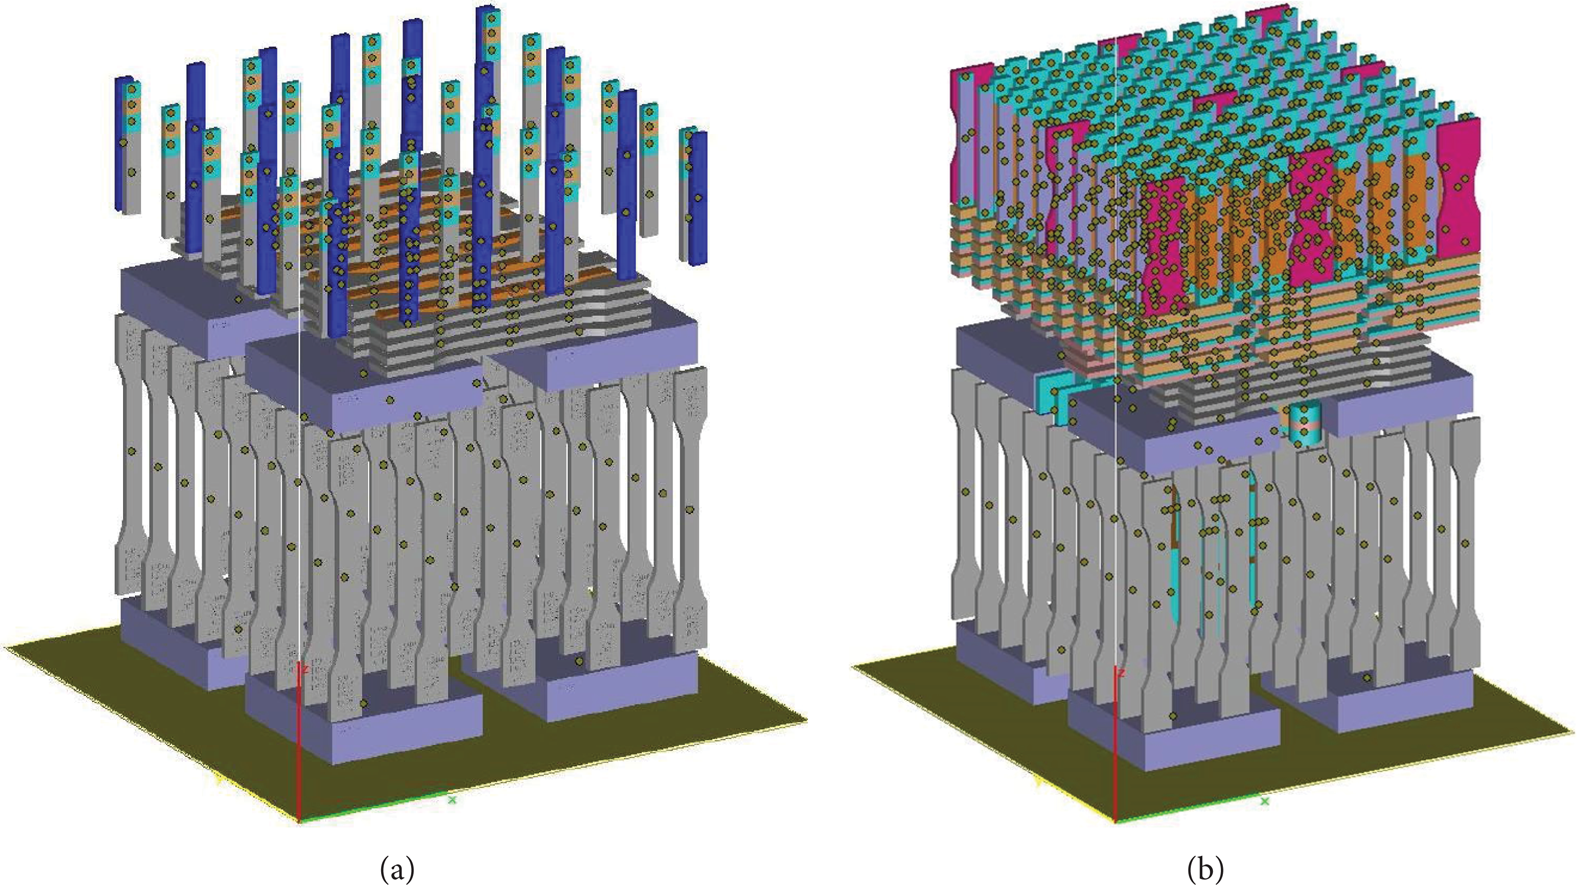
Build job layout of the reference jobs RJ#1 (a) and RJ#2 (b).
RJ#1 contains flat (x) and upright (z) oriented specimen for static tensile, compression, and flexural tests at different testing temperatures. Furthermore, eight hollow boxes are positioned in the bottom and center area of the build job to specify the powder bed density and position dependent powder ageing effects. The layout of RJ#2 is the same as that of RJ#1 in the lower part. The upper part contains specimens for the analysis of dynamic mechanical properties (torsion and bending), electrical conductivity, impact strength (Charpy and Izod), and the heat deflection temperature (HDT), again all in both x and z direction.
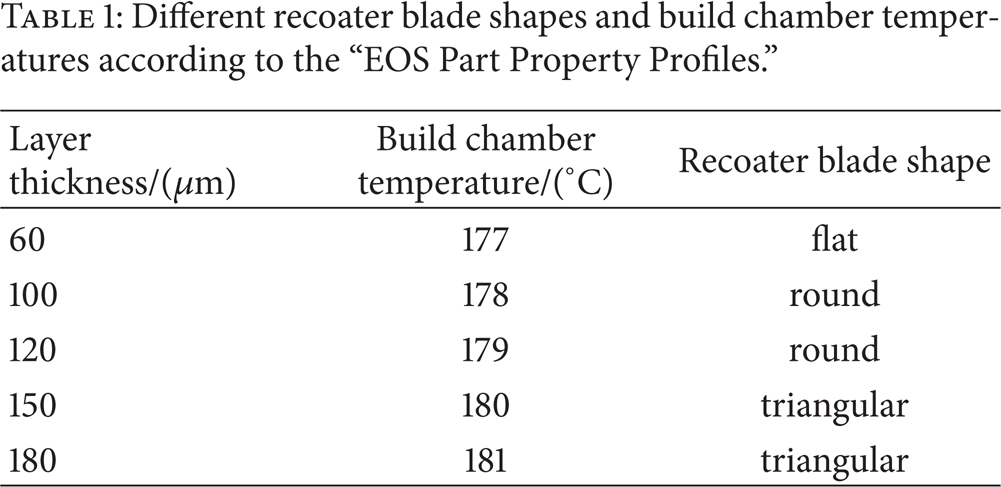
An EOSINT P395 laser sintering system from EOS Electrical Optical Systems GmbH is used to build the reference jobs. As exposure parameters, the “EOS Part Property Profiles” are used, which means that the exposure parameters like laser powder, scan velocity, and hatch distance are constant for the chosen layer thickness. The build chamber temperature is determined according to EOS instructions (build of crosses; non-curl-temperature + 5 K) and given in Table 1. The removal chamber temperature is set at 130°C and the preheating time is 4 hours for each job. In total, RJ#1 is built twice and RJ#2 is built once for each layer thickness. All jobs were unpacked after a minimal cooling time of 10 hours within the machine in nitrogen atmosphere plus 24 hours in standard atmosphere until a maximal core temperature of 40°C. All specimens are blasted in an automatic blasting cabin with a rotating cage and defined blasting pressure of 3 bars and time of 10 minutes from a distance of approximately 25 cm. Due to water absorption, the specimens are conditioned in standard atmosphere (∼21°C ± 1, 5°C, relative humidity 50% ± 10%) for at least 4 weeks before testing.
Different recoater blade shapes and build chamber temperatures according to the “EOS Part Property Profiles.”
The material used for all jobs is one batch of refreshed polyamide 12 (PA 2200) powder delivered by EOS. The average melt volume rate of this powder is 31 cm3/10 min ± 1 cm3/10 min, which equates a powder ratio of ∼46% virgin (∼68 cm3/10 min ± 1 cm3/10 min) and ∼54% used powder (∼16 cm3/10 min ± 1 cm3/10 min). The used powder was cycled and refreshed 4 times before, which is close to a “circulatory” state and representative for a real application.
5. Part and Powder Characterization Methods
5.1. Powder Bed Density (PBD)
The powder bed density is determined using the hollow boxes with the contained bulk powder, with outer dimensions of 100 × 100 × 25 mm³ and a wall thickness of ∼0.7 mm. At first, the absolute dimensions (XPB, YPB, and ZPB) are measured. Then, the mass of the whole box (m1) is detected in an unopened condition as well as in an opened condition with removed powder (m L ) using a Mettler & Toledo XS4002S balance. The wall thicknesses (d x , d y , and d z ) are the last values to measure. The powder box density is calculated with this formula:

5.2. Melt Volume Rate
The determination method of the melt volume rate is described by Rüsenberg and Schmid at the PPS 2013 in Nuremberg [6] and at the European Forum on Rapid Prototyping 2012 in Paris [1]. The method is based on the test standard DIN EN ISO 1133 and EOS working instructions. A Zwick Mflow measurement device is used with a testing temperature of 235°C and a piston load of 5 kg. The material is predried in a furnace for 10 min at 105°C, 5 min at 105 → 140°C (ramp), and 2 min at 140°C. Each given value is the average of a minimum of three single measurements.
5.3. Part Density
For the part density determination, cubic test samples with an edge length of 21 mm are used. The density ρ S is detected using the Archimedes principle described in standard DIN EN ISO 1183 and is calculated by the following formula [10]:
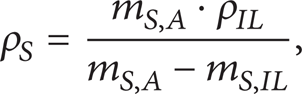
with m S, A being the sample mass in air, m S, IL being the sample mass within the sample fluid, and ρ IL being the density of the sample fluid [11].
5.4. Tensile Properties
The tensile properties are detected according to DIN EN ISO 527 with an INSTRON 5569 universal testing system with an Advanced Video Extensometer to detect the elongation. A truss speed of 1 mm/min to detect the Young's modulus and 50 mm/min for the strength and elongation at break is selected [12]. For the temperature dependent tensile tests, a heating/cooling chamber is attached to the testing system. All specimens are stored for a minimum of 20 hours within a climate chamber at testing temperature before the test starts.
Each RJ#1 contains 45 tensile specimens in z direction and 28 specimens in x direction. 9 specimens in z direction are tested dry (unconditioned) directly after unpacking to examine the reproducibility and comparability of build jobs. The rest of the specimen is divided into groups for the different testing temperatures: 4 × 9 specimen in z direction and 4 × 7 specimen in x direction. With two RJ#1 jobs, it is thereby possible to test eight different temperatures: −60, −30, 0, 22, 30, 40, 60, and 90°C.
5.5. Impact Properties
The impact properties are detected using the given standard DIN EN ISO 179 (Charpy) at an impact testing machine Zwick/Roell, Model HIT5.5P. For reliable results 10 test specimens in each direction are tested for one temperature. All test specimens are tested flatwise, without notch and with a pendulum of 5J.
6. Results and Discussion
6.1. Reproducibility of Build Jobs
A number of 9 upright built tensile test specimens (z direction), removed from each job at the same location, give information about the reproducibility from job to job. These specimens are tested at dry conditions. The results, for example, for a layer thickness of 100 µm, are nearly constant: the tensile strength is 47, 63 MPa for the first and 46, 62 MPa for the second reference job. The elongation at break and the Young's modulus also show no significant deviation (17, 31% and 16, 83%, resp.; 1650 MPa and 1674 MPa). These investigations are equivalent for each layer thickness; the reference jobs are reproducible and therefore a comparison is possible.
6.2. Powder Bed Density
The PBD shows different results for each layer thickness. There are no significant deviations between RJ#1 and RJ#2. The values shown in Figure 4 are the average of all 16 (RJ#1) or 8 (RJ#2) powder boxes per layer thickness. Jobs built with 60 µm thick layers have the smallest PBD (0.411 g/cm3 ± 0.002 [RJ#1] and 0.415 g/cm3 ± 0.002 [RJ#2]). The PBD for 180 µm as well as 120 µm is equivalent between 0.427 g/cm3 ± 0.001 [RJ#1_180 µm] and 0.430 g/cm3 ± 0.002 [RJ#1_120 µm]. There are no significant deviations being detected. The highest PBD are detected for a layer thickness of 100 µm and 150 µm: the values are between 0.437 g/cm3 ± 0.0009 [RJ#2_100 µm] and 0.441 g/cm3 ± 0.002 [RJ#2_150 µm]. The reason for the different powder bed densities is the different recoater blade shapes used for different layer thicknesses. For a layer thickness of 60 µm, a flat recoater geometry is used, while, for layer thicknesses of 100 µm and 120 µm, a round shape blade is used. The third geometry (triangular shape) is used for the layer thicknesses of 150 µm and 180 µm. Because of an equivalent particle size distribution (30 µm,…, 100 µm) for all layer thicknesses, the particles have to be packed using different recoater geometries for a steadier PBD. It is noticeable that the smaller layer thickness, for example 100 µm in contrast to 120 µm, has higher powder bed density. For a small layer thickness like 60 µm, the particle recoating is difficult, because the layer thickness is smaller than the biggest particle size. Therefore it is necessary to use a flat blade to prevent a compaction of the powder bed. Consequentially, the PBD for 60 µm is much smaller than for the other layer thicknesses.

Powder bed density as function of layer thickness for RJ#1 and RJ#2.
6.3. Melt Volume Rate (MVR)
The powder ageing during the build jobs is shown for RJ#1 and RJ#2 (Figure 5) and is detected using the melt volume rate (MVR). A comparison of powder ageing effects for different layer thicknesses and at different positions within the part cake is possible due to equivalent build job layouts. It is obvious that the layer thickness directly influences the material ageing. For small layer thicknesses, the ageing is much higher than for high layer thicknesses. This effect can directly be related to the number of layers and thereby the build time. A longer dwell time of the powder at high temperatures results in a lower MVR due to a higher viscosity of the molten material.

Melt volume rate (MVR) of the used powder from the bottom and center boxes.
Another finding is the position dependency of the powder ageing: for each layer thickness, the material ageing of the central placed powder boxes is much higher than of the bottom placed powder boxes. This effect can be traced back to the temperature history and distribution within the part cake: due to faster cooling rates at outer areas, the thermal ageing of the powder is less intensive and the dwell time at high temperatures is significantly shorter.
The differences between the first and the second reference jobs can also be traced back to the temperature-time profile. Although the absolute position of the powder boxes within the part cake is the same, the relative position is another because RJ#2 is 60 mm higher than RJ#1. The lower slope of the trend line considering the higher build job RJ#2 indicates that the layer thickness dependency is less intense. The absolute values between RJ#1 and RJ#2 vary only at very low and high layer thicknesses.
6.4. Part Density
The part density shown in Figure 6 depends on the layer thickness. The part density decreases using higher layer thicknesses. It is noticeable that parts built with a layer thickness of 60 µm have the highest part density (ρ60µm = 1,0208 g/cm3), although the powder bed density using this layer thickness is the smallest. The part density points to the different energy densities regarding different layer thicknesses. A layer thickness of 60 µm seems to have a higher energy density than other thicknesses. For a layer thickness of 120 µm also the reproducibility is shown: the part density for the first job (ρ120µm_1 = 0,9907 g/cm3) does not deviate significantly from the second one (ρ120µm_1 = 0,9910 g/cm3).

Part density as function of the used layer thickness.
6.5. Tensile Properties
The tension tests are performed for all layer thicknesses as well as chosen temperatures (−60°C,…, 90°C) using specimens from the first reference job RJ#1. The left graph shows the Young's modulus as a function of different layer thicknesses as well as different build orientations. It is noticeable that the Young's modulus (Figure 7) in x direction is higher than in z direction. For the Young's modulus detection it is difficult to get a sensible statement about significant deviations. For lower temperatures the smaller layer thicknesses show higher Young's moduli than the higher layer thicknesses. For 60 µm and 100 µm the curve is sloping down until room temperature. The other curves are sloping down in a smoother way and seem to be constant between −60°C and 0°C. It is conspicuous that the moduli within the glass transition temperature area, which is between 30°C and 50°C, fall down below 500 MPa at 90°C. As can be seen in the right graph, a significant deviation of the Young's modulus for different layer thicknesses cannot be detected due to large error bars. The trend for x direction only shows small deviations: the values are increasing for smaller layer thicknesses.

Young's modulus as function of the layer thickness and testing temperature for x and z direction.
The tensile strength (Figure 8) shows a behavior similar to the Young's modulus: it decreases with rising testing temperatures. For low temperatures it is visible that the strength of the test specimens placed in x direction is much higher than in z direction. These deviations become smaller for higher temperatures. A closer view is given by a look at the results for room temperature. The tensile strength shows increasing values with decreasing layer thicknesses as well as a higher tensile strength in x direction than in z direction. For a layer thickness of 180 µm the tensile strength in x direction is about 44.10 MPa ± 0.35 and therefore ∼15% smaller than for 60 µm (51.94 MPa ± 1.11). The deviation for z direction (50.05 MPa ± 1.57 compared to 40.3 MPa ± 2.79) is about 20%. It is conspicuous that the first standard deviation for all layer thicknesses is higher in z direction than in x direction. Due to similar curve trends, the part density seems to have a direct influence on the tensile strength.
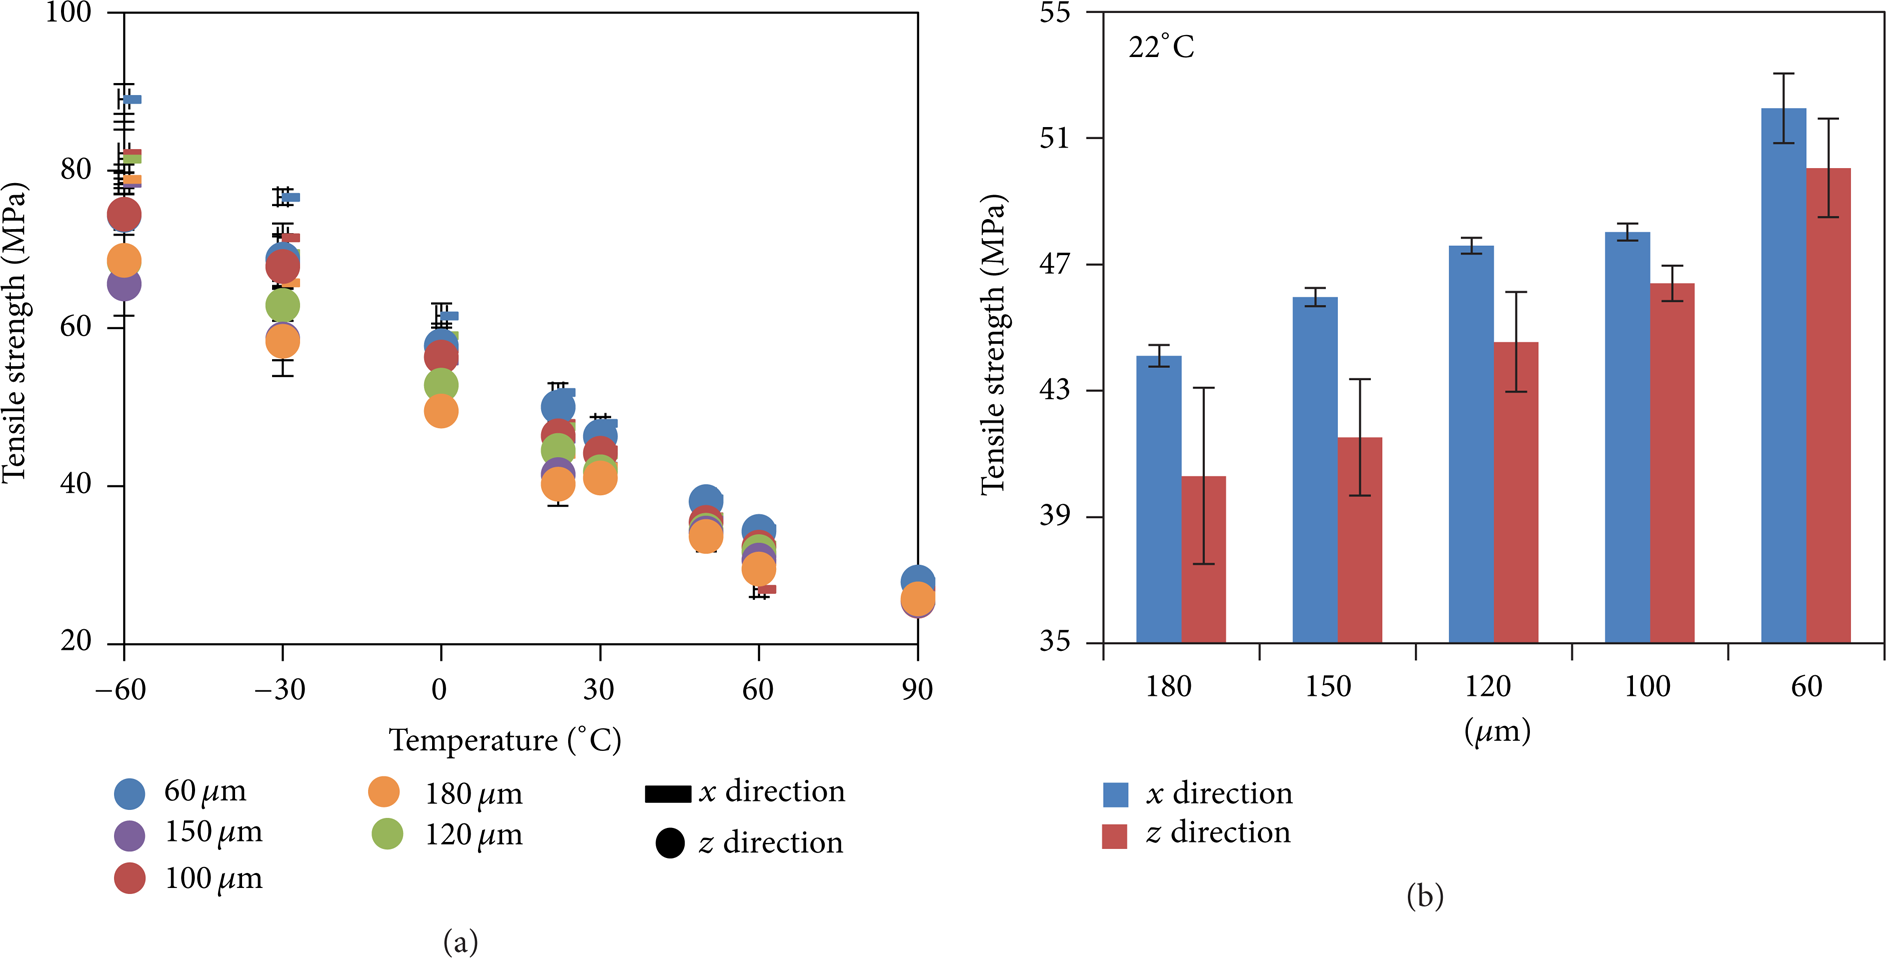
Tensile strength as function of the layer thickness and testing temperature for x and z direction.
The elongation at break shown in Figure 9 indicates significant deviations between test specimens placed in x and z directions for all tested temperatures. The gradients show an opposing trend compared to the Young's modulus and the tensile strength with a higher elongation at break at high temperatures. Thereby, the variations between the different layer thicknesses are negligible for temperatures below 0°C. For higher temperatures, smaller layer thicknesses result in higher elongations at break. The graph on the right shows the elongation at break as function of the layer thickness in detail. The tensile bars in x direction show a much higher elongation at break than the samples in z direction. In z direction, the absolute values decrease for higher layer thicknesses. For specimens built in x direction, no significant layer thickness dependency can be observed due to an indistinct trend and high standard deviations.
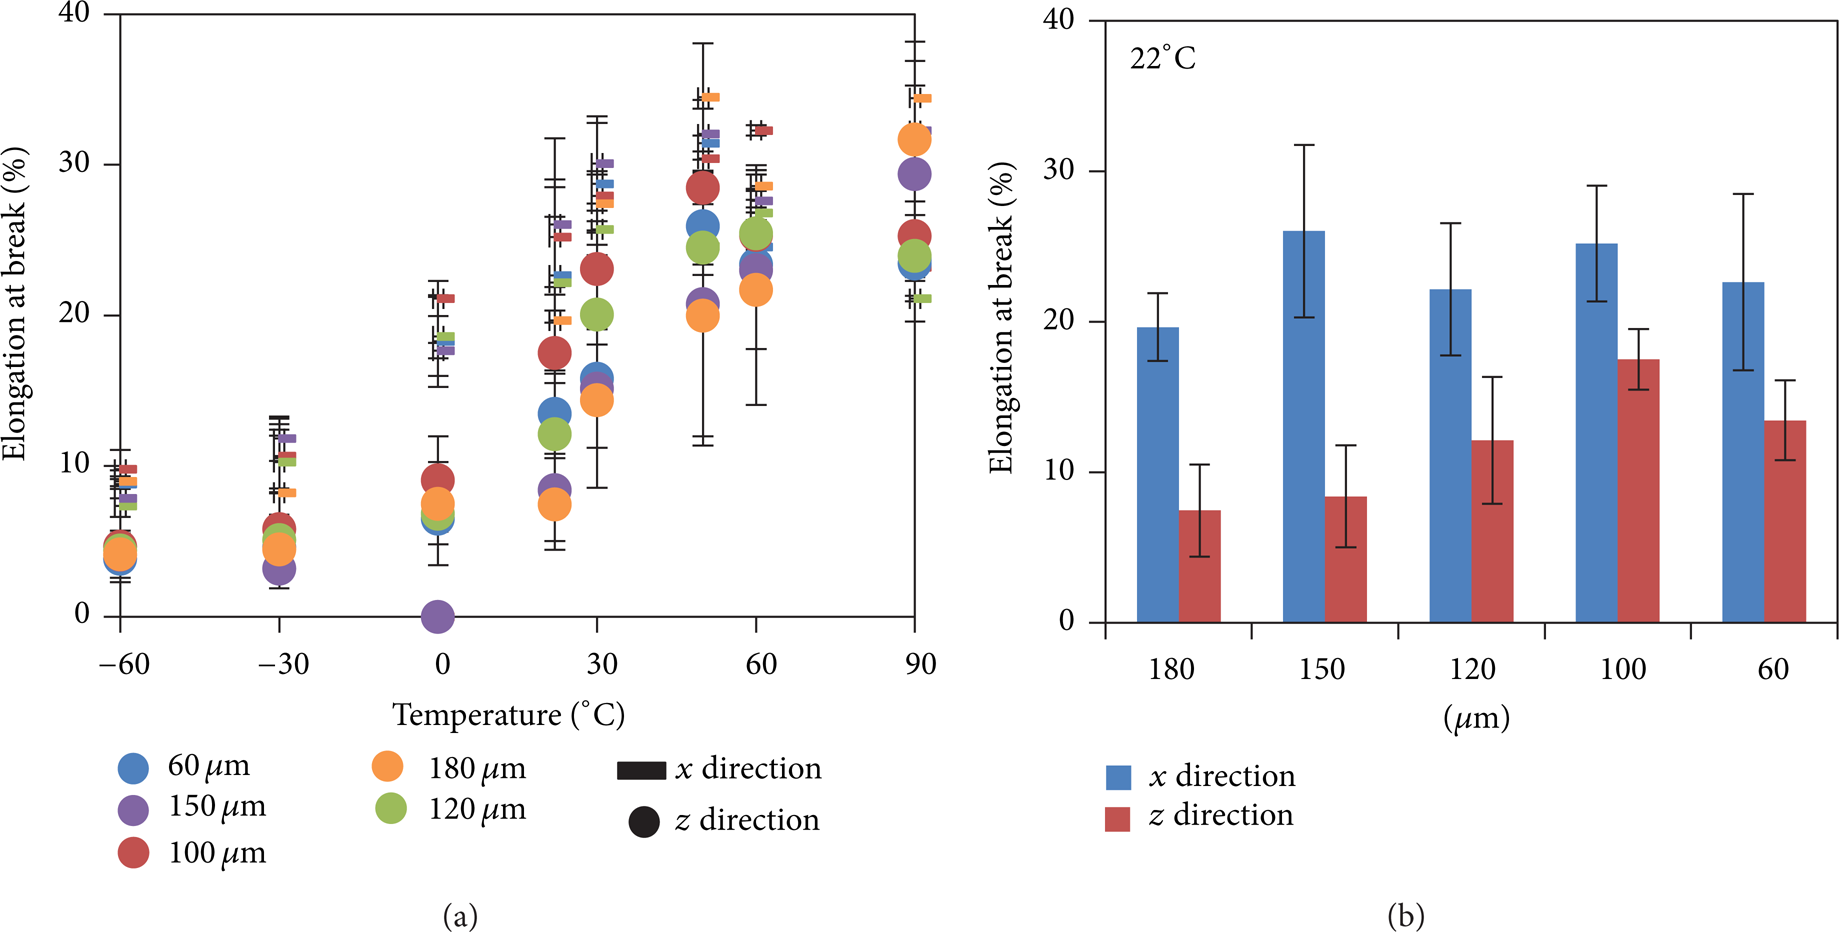
Elongation at break as function of the layer thickness and testing temperature for x and z direction.
6.6. Impact Strength
The curves given in Figure 10 show the impact strength as function of different testing temperatures and layer thicknesses. In general, the impact strength in x direction is higher than in z direction, especially at high temperatures. It is conspicuous that the test specimens have a nearly constant impact strength at temperatures below room temperature. The values increase by passing the glass transition area. A significant deviation between the different layer thicknesses is not shown with the exception of the values at a layer thickness of 60 µm, which is invalid because most of the values are outside of the detection parameters given in the test standard. The impact strength of 60 µm specimens in z direction has not been detected yet. The results for 50°C and 60°C for a layer thickness of 100 µm in x direction are also invalid. However, the impact strength for 60 µm specimen in x direction is significantly higher than for the other layer thicknesses and directions.
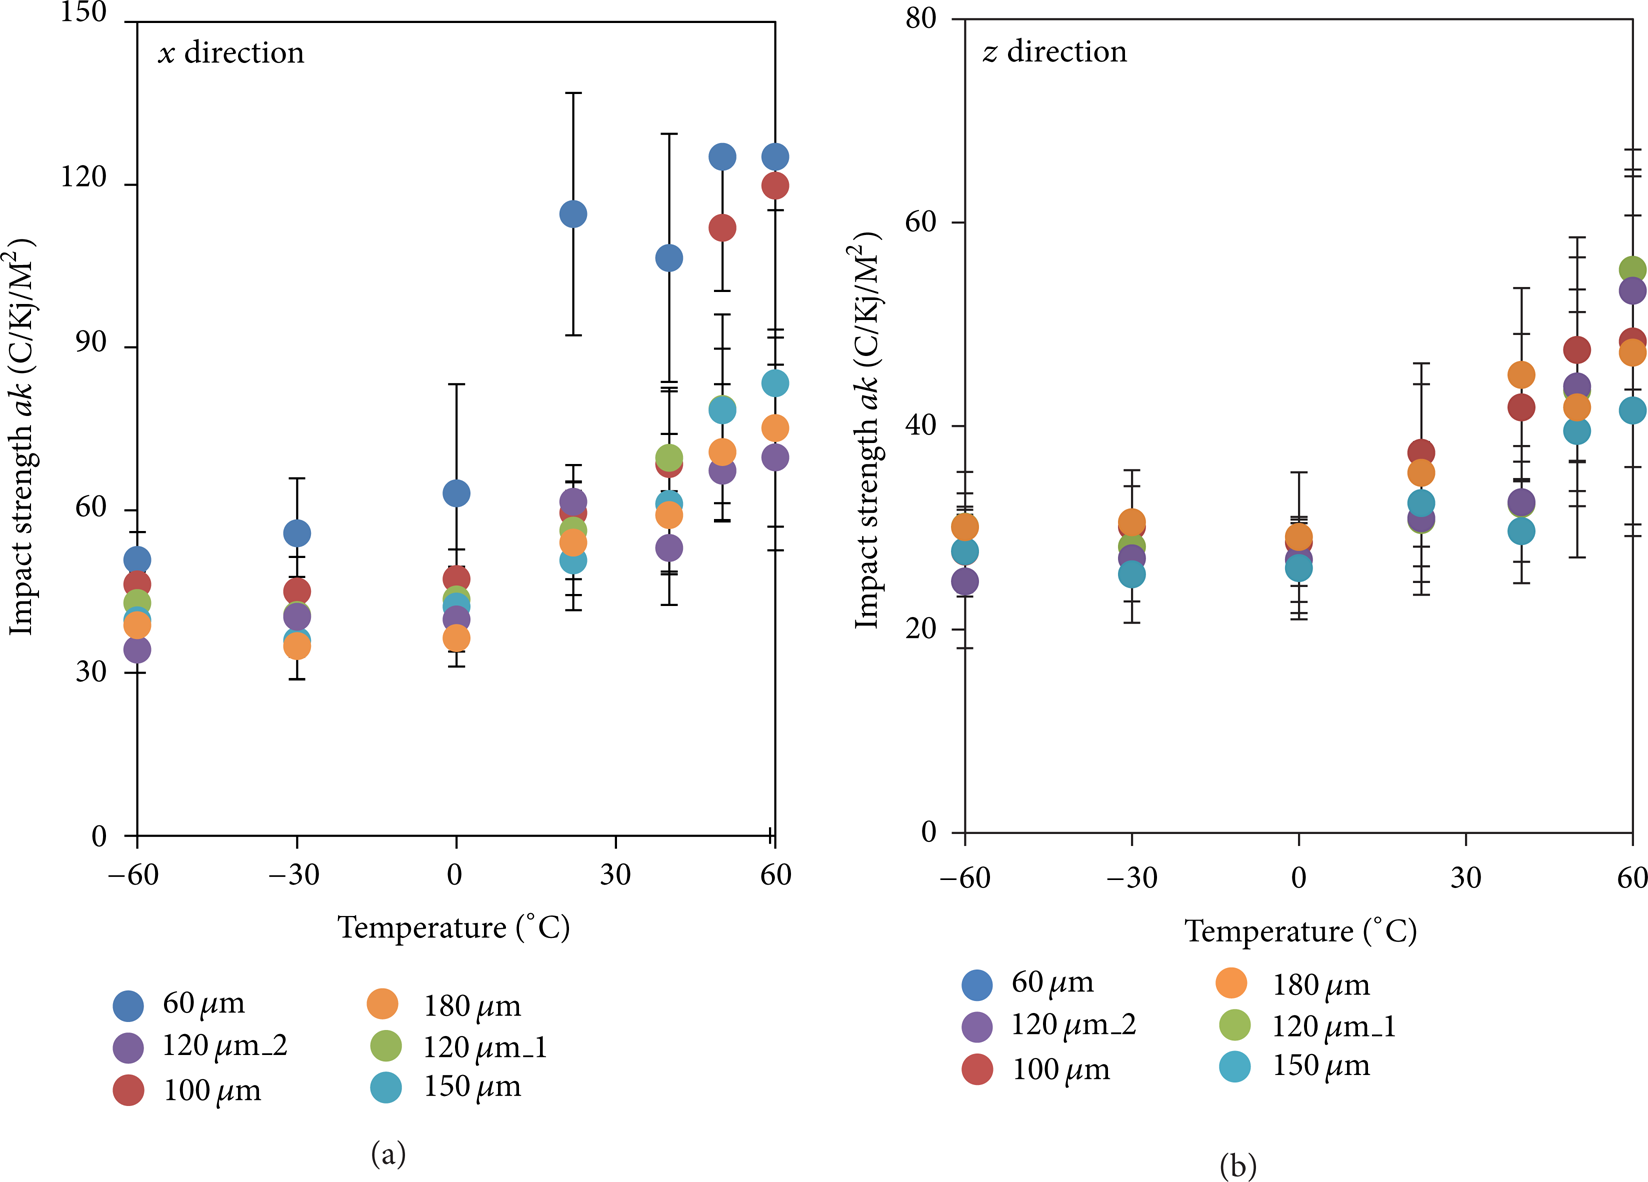
Impact strength as function of the testing temperature for x and z direction.
7. Conclusions
In this work the most important influencing factors along the process chain of the polymer laser sintering process have been identified and verified within a series of experiments keeping these parameters constant. Thereby, the field of parameters, where an acceptable product quality is secured, was determined. Also, the reproducibility and applicability of a quality concept in this holistic way have been shown and proven for the first time. The developed method can be used to get information about a complete data set as function of the main process parameters, for example, the layer thickness and the build orientation and placement. These data sets are essential to qualify the manufacturing process for specific applications. In total, two reference jobs were needed to detect the most important material properties. This work has been performed using a polyamide 12 standard material (PA 2200), but other materials like PA 2241 FR (flame retardant) or PA 2221 (refresh optimized) can be investigated with the same method.
Several mechanical and physical part properties have been investigated using the “EOS Part Property Profiles” standard parameters. While the smallest tested layer thickness results in the lowest powder bed density, the actual part density shows an opposing trend: the higher the layer thickness, the lower the part density. Similar results can be observed regarding the mechanical tensile properties: the tensile strength, Young's modulus, elongation at break, and the impact strength are higher using smaller layer thicknesses. Further on, the testing temperature dependency was analyzed from −60°C to + 90°C. Here, laser sintered parts show a behavior comparable to traditional manufactured specimen with increasing tensile strength values and decreasing impact strength and elongation at break at low temperatures. However, the effect of build orientation has to be considered.
The material ageing depends on the layer thickness, the job height, and the position within the part cake. The temperature distribution and history during the build and cooling process are an important influencing parameter and have to be investigated in greater depth to find a solution for “more homogenous” part properties. The material ageing at the center of the part cake is higher than at the bottom. Also, the intensity of material ageing increases with smaller layer thicknesses. This effect can also be traced back to longer build times and thereby a “stronger” temperature-time-profile. In further experiments, it might be possible to get information about the temperature distribution and history investigating material samples from different positions.
Conflict of Interests
The authors declare that there is no conflict of interests regarding the publication of this paper.
Footnotes
Acknowledgments
The authors want to thank the industry partners of the DMRC as well as the federal state of North Rhine-Westphalia and the University of Paderborn, Germany, for the financial and operational support. Many thanks are due to the assistance of EOS GmbH, Evonik Industries, and The Boeing Company for performing this project and working close together with industry staff to solve user questions.