
Abstract
Suddenly encountering light sources at night will reduce drivers' dynamic distance of visual cognition. In order to investigate the law of quantitative changes of the visual recognition distance under the conditions of different speeds and different environmental luminosity around drivers, calibration experiments were conducted on an actual road. And on the basis of the data set from the experiments, using the method of curved surface regression analysis, the function models describing the rule of the visual recognition distance changing with the environmental luminosity around drivers and running speeds were established. The models were effective via statistical tests. Furthermore, combined with the automobile braking distance, the reaction time allowed for drivers and the critical speeds were analyzed then. Verification tests were also designed to test the established function model. Results showed that as the environmental luminosity around drivers increases, vision recognition distance decreases; as vehicle speed increases, vision recognition distance decreases. Therefore, the sudden showing-up light sources will affect the environmental luminosity in the cab and lead to the reduction in the visual recognition distance as well as the reaction time for drivers. In this circumstance, drivers must control the speed lower than the critical speed to avoid collision.
1. Introduction
Guided by vision, automobile driving is a circulating feedback process which includes constantly perceiving road environment information, making decisions, and guiding the driving behavior [1]. Among all kinds of sensory channels that drivers obtain information from, more than 90% of information is acquired by vision [2]. Depending on a variety of visual cues, drivers obtain necessary road environment information. In the dark environment at night, because the amount of light entering drivers’ eye is insufficient, it is difficult to form a clear image on the retina. And the degree of difficulty in perceiving road environment information for drivers increases. Among all the cognitive clues of road environment information at night, the contrast ratio of luminance between obstacles and background is an important basis [3]. During the process of driving, drivers need to constantly identify obstacles in front and judge their motion state. Besides the contrast ratio between luminosity of obstacles and that of its environment, environmental luminosity around drivers is also a very important factor in determining whether drivers can recognize obstacles in front. With the increase of environmental luminosity around drivers, drivers’ distance of visual cognition of obstacles is reduced. In addition to objects which can give out light by themselves, the luminosity of other obstacles only comes from the reflection of car lights. During the process of driving, in order to ensure safety, it is very important to keep accurate cognition of the obstacles in front of the vehicle. However, in the actual road conditions, some light sources often appear unexpectedly, such as the headlamp of the opposite vehicle during automobile meeting, tunnel lighting lamps, lights installed on the rear of some large vehicles, large areas of retroreflective sign, large areas of electronic variable information board, and so forth. When drivers drive into the region influenced by the above light sources, environmental luminosity around drivers is very high, while the luminosity of many obstacles only comes from the reflected light. It will lead to the serious decline of the contrast between obstacles and environment; then the distance of visual cognition will severely decrease, and drivers will lack reaction time. And it is easy to bring the stress driving behavior, even traffic accidents, in this condition.
2. Literature Review
Impacts of the lights on drivers’ distance of visual cognition have been widely recognized. However, there have been no quantitative conclusions on the degree of its influence on the visual recognition distance. In many treatises about traffic psychology, there was an analysis on the impacts of light and dark adaptation, luminosity, and other factors on the distance of visual cognition [4–6]. In the study about visual cues of drivers, it pointed out that the contrast between light and dark was a key visual cue, particularly prominent at night [3]. In 1926, American physicist Holladay first put forward the concept of glare. He thought the impacts of glare on visual function were mainly caused by the equivalent light screen brightness which formed in the eye by the light from glare sources [7]. And in 1928, Stiles further showed that disability glare was caused by the scattering of light in the optic media of the eye [8]. In addition to the visual cognition distance, researches on the change rule of the distance estimation under different environmental luminosity showed that the estimated value at night was greater than that in the daytime [9]. There were few differences in the researches on driving behavior model and information processing at home and abroad. Professor Wang has studied the relation between psychological factors and driving behavior model [10]. All the related researches showed that the impacts of luminosity on the visual cognition distance were recognized. But most researches was qualitative researches and there were few quantitative research conclusions. Moreover, in the field of traffic psychology it was often thought that the perception of depth distance came from the binocular parallax. Roles of the contrast between light and dark were usually ignored. In addition, the impacts of luminosity on the visual cognition distance mainly focused on the problems of luminosity around obstacles, ignoring the impacts of the luminosity around drivers. However, at present, under different road conditions, the light sources of different luminosity increased and their impacts on luminosity around drivers had a certain suddenness, so it was of great significance to carry out relevant researches. Moreover, in almost all the studies above, it failed to obtain the quantitative conclusions about the visual cognition distance changes resulting from differences between environmental luminosity around drivers and road luminosity.
Thus, the relevant researches on the explicit concept and function of the visual cognition distance mainly focus on the legibility of signs. In 1935, the United States promulgated the first edition “Manual on Uniform Traffic Control Devices.” It put forward that traffic signs should be made of the material with brightness to reduce traffic accidents. In 1939, the manual further required that road traffic signs should use retroreflective material. In 1993, the United States proposed legislative directives to luminance and improved application rules. In 2008, it formally promulgated the minimum retroreflective coefficient of traffic signs [11]. Japanese provision of related signs was in the “road transport vehicle law,” “road traffic law,” “road transport law,” and “road law.” In 1975, Hörberg and Rumar conducted tests in the different light environment and revealed the relationship between the value of luminosity and visual distance [12]. In Europe, “Vienna convention on the road signs and signals in 1968” produced far-reaching effects on the signs and markings in Europe and even in the world. In 1984, Centers for Automobile Safety (CAS) of the U.S. requested the United States Federal Highway Administration to issue the retroreflective coefficient standard on the signs and markings. In 1993, the United States developed calculation software to calculate the minimum recognition distance. In 1994, a new calculation software was published to recalculate reflective luminosity. In 2000, more and more lamp types, vehicle types as well as vehicles driving at night appeared on the road, and the U.S. thought the minimum retroreflective coefficient should be determined. In 2003, the Federal Highway Administration of the United States released a new version of the minimum retroreflective coefficient [13]. Canada is located in high latitudes, and frost has been a big problem for driving. In 2004, Eric Hildebrand conducted the relevant study under the condition of frost. He pointed that after frost the legibility of signs obviously decreased and the retroreflective coefficient reduced 1/3 [14]. In 1990, Kline et al. researched the visibility of reflective signs; he pointed that the type of signs (icon signs or text signs) and lighting conditions were two factors having significant effects on the visibility of signs, while age almost had no effects [15]. Summala and Hietamaki also found that the more significant the sign the greater the drivers’ immediate response to it [16]. In 1993, using an optical blur (i.e., low-pass) approach, Kline and Fuchs presented improved symbolic highway signs, which had significant advantages in visibility over standard text signs and standard symbolic signs for all drivers. However, unlike Kline and Fuchs they thought old drivers had more difficulty in identifying signs [17]. Humans’ ability to accept large amounts of information in a short time was limited [18, 19]. Thereby, considering drivers’ short-term memory capacity, the amount of information contained by signs could not be too much. In 2005, Liu analyzed the amount of information contained by signs and compared the effects of different information volume on drivers. He found the greater the amount of information, the slower the drivers in visual search was [20]. In 1953, Hyman researched the relationship between the amount of information and the response speed of the recipient. He found a logarithmic function between the two factors [21], while in 1966 Forrin et al. thought it should be a linear relationship [22]. Workload was also an important factor influencing traffic sign perception. In 1964, Forbes concluded that the type of loading task should be considered in all laboratory traffic sign research. According to Dewar et al. as the types of tasks changed, the reaction time changed too. Reaction times needed for the classification task were smaller than that for the identification task [23]. And he also pointed out that a loading task may increase the validity of the reaction time index. However, Testin and Dewar (1981) thought there was no benefit on the reaction time of drivers to include a loading task [24]. The secondary task will change the movements of the eye, thereby affecting the drivers’ perception of the outside world [25, 26]. As for the sizes of traffic signs, some people thought that traffic signs could not be too large, because large signs can affect drivers’ perception of the nearby small one. However, in 1991, from the research of Donald et al. this concern can be reduced in some degree. They found that employing a large traffic sign would not delay the perception of a second contiguous sign [27]. Moreover, drivers’ gender, age, driving experience, educational background, income level, and so forth also had significant effects on traffic signs [28–30]. From these studies it could be seen that the issue about the distance of visual cognition and legibility mainly focused on road traffic signs, while there was little attention on the obstacles on the road.
Researches on the impacts of different light sources on drivers’ distance of visual cognition mostly concentrated in the description stage. When drivers were suddenly encountered the bright light environment, he would have glare problem, and then he could not see the road environment in a short time. But in fact, in many cases the light environment drivers encountered was not bright enough to cause glare. Just because the contrast difference between light and dark was too large, drivers could not see the road environment. Especially under different running speeds, there were no quantitative conclusions about how the distance of visual cognition changed with the luminosity and how much reaction time drivers needed. Researches on the distance of visual cognition mainly focused on the visibility of signs and were mostly during the daytime. In addition, when drivers were suddenly confronted with some light sources, the environmental luminosity around drivers was high, while that around obstacles was low. The relevant research on how the distance of visual cognition would change quantitatively in this case had been in a blank state. In fact, in this state, if there was a small obstacle which was higher than the minimum ground clearance of vehicle in front of the car, the lack of reaction time would lead to the impossibility of avoiding collision. It could be seen from the above that it was of great significance to study the visual distance of recognizing obstacles under the condition of lamp irradiation and different environmental luminosity around drivers and to obtain the quantitative change rules.
Therefore, through the actual road tests, aiming at different environmental luminosity around drivers and different speeds, this paper tried to have researches on the relationship between the distance of visual cognition and the two variables And then establish the function model to quantitatively study the impacts of the two variables on the visual cognition distance and reaction time allowed for drivers. Moreover, in order to reduce such accidents and improve the road traffic safety level, the critical speeds were calculated under different conditions.
3. Research Method and Experiment
3.1. Research Method
The relevant researches on drivers are greatly influenced by the difference of individual factors. And in the simulative environment, it cannot create the same driving feeling to drivers as the real environment either. Therefore, this research was conducted on the actual road at night. The environmental luminosity around the road was set to 0 Lx and the environmental luminosity in the cab was set to different values. When a driver controlled the test vehicle getting through the testing road, he began to recognize obstacles in front. As long as he saw the obstacles in front accurately, he sent a signal. Then, the experimenter marked the point of visual cognition and measured the length of the visual recognition distance. When selecting different luminance parameters in the cab, some typical light sources on the common road of China were considered, including the headlamp of the opposite vehicle during automobile meeting, lights set on the rear of some large vehicle, large areas of retroreflective sign, large areas of electronic variable information board, and so forth. As for speed, considering the speed limits on the road of China, it is, respectively, set as 0, 20, 40, 60, 80, and 100 km/h. After completing all the experiments, SAS (Statistics Analysis System) was used to analyze the data set to compare the impacts of different variables on the visual cognition distance of drivers. Multiple curved surface regression analysis was used to study the quantitative relationship among the distance of visual cognition, vehicle speeds, and environmental luminosity. function model was established then. At the same time, under the condition of different speeds and different light sources, the change rule of the reaction time allowed for drivers was analyzed and the corresponding function model was established.
3.2. Experiment
3.2.1. Subjects
35 drivers were recruited in total, 12 of them were women. They were from different industries, had different driving experiences, different occupations, different ages, and different driving years. All subjects were requested to have more than 2 years driving experience and they should have the experience of driving in different road environments. Adept driving skills and good driving habits as well as no physiological defects or involvements in serious accidents were also requested when selecting.
3.2.2. Instruments
Illuminometer was used to measure the luminosity in the test environment, and luminance meter was used to measure the luminance of the relevant surface and actual environment. Obstacles were set as 20 cm * 20 cm square objects whose colors were white or black. A car with 5 seats was selected as the test vehicle. The microwave radar speed sensor was used to measure and calibrate the speed. Using the signal generator, data was recorded in the Dewetron 16 channel data acquisition system to mark the point of visual cognition. And the measuring scale was used to measure the distance of visual cognition. The light sources in the cab were provided by different power lamps and calibrated by lluminometer.
3.2.3. Road and Luminosity
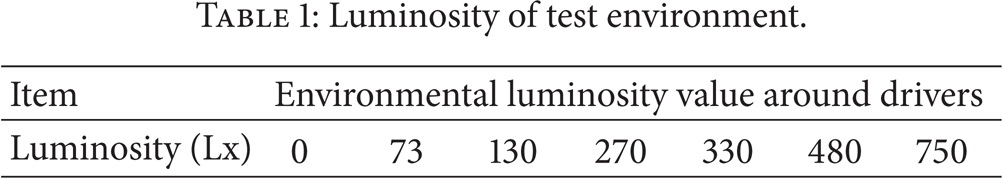
Experiments were carried out in the special automobile testing ground, and the environmental luminosity was 0 Lx. The test road was a straight black asphalt pavement, with the length of 1500 m. Based on the measurement results of the actual light sources, the environmental luminosity around drivers was set (see Table 1).
Luminosity of test environment.
When the only light sources were the headlamp, with the increase of the distance between obstacles and lamps, the luminosity of lamps decreased constantly. Considering the irradiation distance of the lamps and the safe distance between vehicles when driving, the luminosity data within 150 m in front of the lamps was measured. On the basis of the actual measurement results, the changes of the luminosity of lamps with distance can be seen in Table 2.
Luminosity of lamps under the condition of different distances.

3.3. Experiment Program
This experiment was designed in accordance with the double-blind principle and tried to control the possible impacts of other factors on the driving behavior. A simple repeated experiment scheme was used to ensure data validity. The experimental procedures are as follows.
According to the scheme, experimenters set the test environment and the luminosity of the light sources in the cab, calibrated the test equipment, and emplaced obstacles.
One subject started the vehicle and opened the headlight with the high beam mode.
Given sufficient time, the subject adapted to the environment without external light sources. Then he drove into the test environment.
According to the setting speed, the subject controlled the vehicle and approached the obstacle. As long as he could recognize the obstacle, he sent a signal to mark the recognition point. Experimenters measured and recorded the distance of visual cognition under this test condition.
The subject continued to drive into the environment without light. After the dark adaptation, he drove into the test environment at other setting speeds and carried out step (4).
After all the experiments were completed under one certain luminosity value, steps (1)–(5) were carried out again under another luminosity environment.
After the subject completed all experiments under one certain color obstacle, experimenters changed the obstacle color, and then the experimental steps (1)–(6) were repeated.
After this subject completed all experiments of the above steps (1)–(7), another subject was selected to carry out the experiments above. Experimenters recorded the relevant data.
4. Analysis and Calculation
4.1. Data Analysis
Under the condition of different luminosity and different speeds, all drivers succeeded in recognizing obstacles with different colors and the relevant data was obtained. All data were input into SAS to conduct statistical analysis. The method of paired t-test was used to analyze whether there was a difference in drivers’ distances of visual cognition under different color obstacles. The test results are shown in Table 3.
Statistical significance of paired t-test.

Significant difference between black and white obstacles, P < 0.05.
As can be seen from Table 3, under all conditions of luminosity and speeds, the significance of difference between different color obstacles was less than 0.05. There was significant difference between black and white obstacles. Therefore, the change rule of the distance of visual cognition must be analyzed separately.
From the statistical analysis, we also found that under the condition of the same environmental luminosity and speed, different drivers’ visual cognition distance on the same color obstacle shows a normal distribution. Under the condition of different luminosity and different speeds, the statistical average was chosen as the typical value under this condition, and it is used to characterize the change rule of the visual cognition distance with the two variables (see Tables 4 and 5).
The distance of visual cognition on the white obstacle.

The distance of visual cognition on the black obstacle.

As can be seen from Tables 4 and 5, with the increase of luminosity around drivers, the distance of visual cognition on obstacles reduced, and with the increase of speed, the distance of visual cognition reduced too. But when comparing different color obstacles under the same condition, the distance of visual cognition for white obstacles was greater than that for black.
4.2. Models
4.2.1. The Distance of Visual Cognition
Considering the data characteristics and change rule, it was clear that the environmental luminosity around drivers and the driving speeds were the key factors that affected drivers’ distance of visual cognition. Therefore, taking luminosity and speed as the independent variables and taking the characteristic value of the distance of visual cognition as the dependent variable, a model could be established to represent the change rule of the visual cognition distance by the method of dual curved surface regression analysis.
(1) White Obstacle. Under the condition of different luminosity and different speeds, dual curved surface regression analysis on the distance of visual cognition and driving speeds was conducted for white obstacles. result is shown as follows:

where D W is the distance of visual cognition, V is the driving speed, and L is the environmental luminosity around drivers.
The correlation coefficient R2 of the model is 0.9783, indicating that the model is effective. The F-test was used to test the significance of the model built in SPSS software. The result showed that for a given significance level α = 0.05, P = 0.000 < α = 0.05. So regression model was significant in statistics. Test results also certificated that correlation coefficients were significant. The model was effective via statistical test. It can well show the relationship among the distance of visual cognition for white obstacles, the environmental luminosity around drivers, and the driving speeds.
(2) Black Obstacle. Using the same analysis method as shown in white obstacles, the change rule of the visual cognition distance for black obstacles is also obtained. The result is shown as follows:

where D B is the distance of visual cognition, V is the driving speed, and L is the environmental luminosity around drivers.
The correlation coefficient R2 of model is 0.9326, indicating that the model is effective. Other statistical tests conclusions about model and correlation coefficients were the same with white one. All these showed that the model was effective. It can accurately reflect the relationship among the distance of visual cognition for the black obstacle, the environmental luminosity around drivers, and the driving speeds.
From the change rule of function in formulas (1) and (2), it can be seen that with the increase of the environmental luminosity around drivers, the distance of visual cognition gradually reduces, and with the increase of speed, the distance of visual cognition also decreases (see Figure 1). When the luminosity value further increases, it will bring the glare problem and make drivers unable to recognize the obstacle in a short time. Under this circumstance, the distance of visual cognition becomes extremely small. But during the actual driving, unless it is created deliberately, it cannot generally appear.

Dual curved surface of regression model.
4.2.2. Allowed Reaction Time of Collision
The allowed reaction time of collision was defined as the time from finding the obstacle to taking the brake. This time could not be too large. Otherwise, it would result in colliding with obstacles. In the above calculation and analysis, several factors must be considered, including drivers’ brake reaction time, brake coordination time τ2′, the growth time of braking force τ2″, road adhesion coefficient φ p , and so on. Consulting the relevant information, the above parameters were obtained. Before the driver braking, the vehicle kept driving at the original speed. Therefore, this time it was the result of the visual recognition distance minus the braking distance divided by the vehicle speed. The calculation results were, respectively, shown as formula (3) and (4).
Braking distance:

Allowed reaction time:

where τ2 = τ2′ + τ2″ is the action time of the brake. It is generally between 0.2 s and 0.9 s. a bmax = φ p g is the braking deceleration.
When drivers were affected by the external light, the decrease of the visual cognition distance led to the decrease of the allowed reaction time for drivers and might cause collision accidents. Therefore, when analyzing the driving speeds, the limit state when the distance of visual cognition was less than the braking distance should be considered; namely D ≥ s should be ensured. Under this state, the critical speeds could be calculated at one certain luminosity. Through the above analysis, formula (4) was used to calculate the critical speeds under different environmental luminosity. The results were shown in Table 6.
The critical speeds under different conditions.
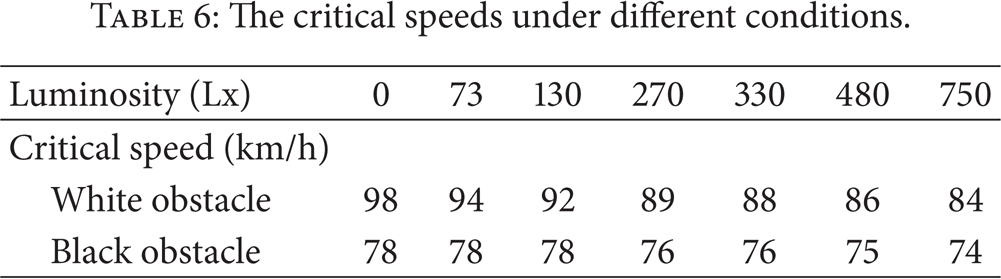
Therefore, in different light environments, the change of the visual cognition distance could cause the decrease of the allowed reaction time. Drivers must control the driving speed below the critical speed. If the speed was more than the critical value, the decrease of the distance of visual cognition would lead to the condition that allowed reaction time to be insufficient. Then collision would inevitably happen.
4.3. Results Verification
To verify the reliability of the above model, lightweight flexible material was chosen to make the same size and color obstacles as these used in previous experiments. And under the condition of different luminosity, three speeds were randomly selected to carry out the tests of the visual cognition distance. The first speed was set as 5 km/h lower than the critical speed, the second equal to the critical speed, and the last 5 km/h higher than the critical speed. Ten people were recruited to conduct 30 verification tests. In every test drivers were required to take braking to avoid collision at different speeds. Test results showed that when the test speed was lower than the critical speed, it collided with obstacles once, and the others could stop in front of obstacles. When driving at the critical speed, it collided with obstacles six times. When driving at greater than the critical speed, it collided with obstacles nine times. Verification results showed that this model was effective and could reflect the relationship among the distance of visual cognition, driving speeds, and the environmental luminosity around drivers.
5. Conclusions
In this paper, aiming at the impacts of luminosity in the cab at night on drivers’ dynamic distance of visual cognition, using the method of actual road tests and combined with curved surface regression analysis, mathematical models were developed. Statistical tests, as well as verification experiments, were designed and conducted to test the results. The main conclusions of this study are as follows.
In the dark environment at night, as the environmental luminosity in the cab increases, vision recognition distance decreases; as vehicle speed increases, vision recognition distance also decreases. Moreover, the reduction in the visual recognition distance will result in the reduction in the allowed reaction time.
Different colors of obstacles will bring different results in the visual recognition distance and the differences are significant. Compared with black obstacles, white obstacles bring greater visual recognition distance in all tests under different conditions.
The established function model was effective. It could quantitatively analyze the impacts of the environmental luminosity around drivers on the distance of visual cognition.
There is one critical speed under each condition of different luminosity and different speeds. When drivers exceed the speed, it is impossible to avoid collision with the obstacles in front. Thus, when suddenly confronted with the light sources, drivers must control the driving speed below the critical speed in this driving environment to ensure safety.
Conflict of Interests
The authors declare that there is no conflict of interests regarding the publication of this paper.
Footnotes
Acknowledgments
This work was supported by the China Postdoctoral Science Foundation (2012M521731), the Fundamental Research Funds for the Central Universities (CHD2011JC031), and the National Natural Science Foundation of China (51178054).