
Abstract
The subway-induced ground-borne vibration poses great challenge to the environment in the nearby districts. This problem is more prominent for near-station sections of subways since more buildings and human activities are influenced. And the train would be either accelerating or decelerating in this section; the vibration induced would be different from that induced by the train running on long straight subway sections. For the purpose of evaluating human comfort and designing vibration mitigation systems in the buildings, it is necessary to measure the ground-borne vibration induced by the subway. In the presented paper, a measurement system based on the CompactRIO system and LabVIEW platform is constructed. A network of acceleration sensors is placed to collect the vibration signals. This system is used to measure the ground vibration in terms of acceleration and the corresponding Fourier spectra at a near-station section of the Shanghai Metro Line 9. Some observations have been obtained towards the ground-borne vibration induced by a train running underground near the station as well as the vibration decay with the distance from the subway tunnel.
1. Introduction
During the urbanization process, many subways have been constructed to meet the growing needs for fast and massive transportation. Taking the metro system in Shanghai as an example, twelve lines have been built in the past twenty years. In addition, two more lines are under construction and seven more are already on the city's construction plan. It is known that subways are highly demanding on the environment. Among others, ground-borne vibration from underground tunnels is a major environmental concern for nearby areas.
The problem of ground-borne vibration [1] has been studied by using different approaches, including in-situ measurement, laboratory test, and numerical modelling. Among others, Gupta et al. [2] investigated the influence of the vibration induced by the Beijing Metro on a physics laboratory by both vibration measurements and numerical simulation. For the purpose of designing vibration mitigation system in buildings, Sanayei et al. [3] compared the vibration measurements inside the buildings at foundation level with the open field measurements. Nicolosi et al. [4] considered the interaction between the railway vehicle and the superstructure and developed a unified model to predict the vibration induced by underground railway. Yang et al. [5] considered the variation of soil properties with depth and studied the ground-borne vibration through centrifuge test and numerical modelling. Forrest and Hunt [6] developed a refined track model based on the floating-slab track to assess its effectiveness.
However, most of the studies have focused on the vibration induced by trains running in long straight tunnels. For the ground near a subway station, the train would be in a state of accelerating or decelerating, as compared to the constant high speed on long straight sections. And there are more buildings and human activities in the nearby area; the ground-borne vibration would impose more influence on the vibration-sensitive equipments in the buildings and comfort of human. It is thus imperative to reduce these vibrations inside buildings and on the ground to acceptable levels with the design of an efficient vibration mitigation system. Incorporation of a vibration mitigation system in a building in the design phase requires prior understanding and characterization of the subway-induced base excitations of the ground to meet serviceability criteria. In-depth investigation into the influence of ground vibration is significant in a practical sense.
In-situ test is the most straightforward approach to obtain the real-time ground-borne vibration. It is known that the automation and control systems for the real-time data via networks including the data acquisition system (DAQ) and the personal computer (PC) can be realized during the complex test processes. Several manufacturers including Wizcon and Wizfactory-Pc Soft International Inc., RSI-Rockwell Automation, LabVIEW-National Instruments, and Windows-Elipse Software Ltd. provide efficient networks for maximization of data changes and increase in flexibility. Sensor networks are the critical part in in-situ test. Advances in sensing technology have greatly promoted the application of sensor networks [7–9]. To make the best use of the measured results, remarkable progress has been made toward the optimal sensor placement technology [10, 11], the intelligent algorithms in the design of sensor networks [12], its evaluation criteria [13], data processing method [14], uncertainty analysis [15], and so forth. Up to now sensor networks have been applied to measurement of different types of infrastructures [16–19].
In the presented paper, a virtual instrument system is built by integrating computer technology, virtual instrument technology, and digital signal processing technology. The system is used to measure the subway-induced ground motion near a subway station in Shanghai Metro. A network of sensors is distributed to collect the vibration signals due to the running train. Some observations are obtained towards the ground motion in all the three dimensions in terms of acceleration time history, acceleration spectra, and the 1/3 octave band RMS spectra of the vertical acceleration.
2. The Measurement System
The measurement system consists of a personal computer (PC) and a data acquisition system (DAQ). The latter is developed based on the CompactRIO system which is an embedded platform based on real-time operating system. It includes a real-time controller, a reconfigurable field programmable gate array (FPGA), and a hot-pluggable industry module. The personal computer and the data acquisition system are connected through an ethernet cable. All the programming work is finished on the computer. Then the program is downloaded to the real-time controller and FPGA through the LabVIEW real-time module.
In the measurements, a set of sensors are distributed at designated locations to collect the signals, which are then transformed, amplified, and sent to the I/O data acquisition module. The I/O module further transfers the data to the FPGA through the FPGA program, from which the real-time controller reads the data through the RT program and transfers to the upper computer through the internet protocol. By using the data interaction program, the data are received and stored real-time after certain processing. Taking the acceleration signal as an example, the data acquisition process is shown in Figure 1.
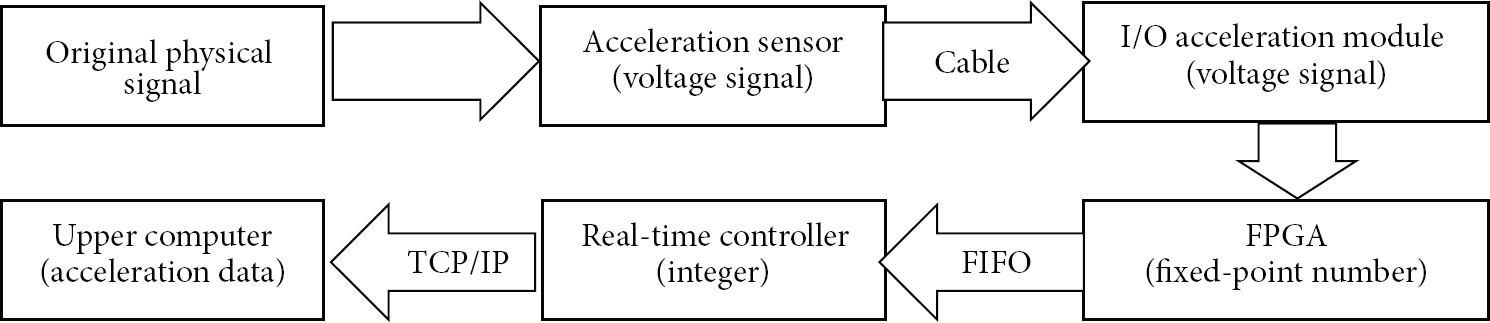
Flowchart of data acquisition.
The CompactRIO system is comprised of the cRIO-9074 chassis and acceleration acquisition module provided by the National Instruments (NI) company [20] (Figure 2). In the NI cRIO-9074 system, the real-time controller and the reconfigurable FPGA are integrated in the same chassis for the purpose of embedded machine control and monitoring. 128 MB dynamic random access memory for embedded operation and 256 MB nonvolatile memory for storing signals collected are integrated in the chassis. Two 10/100 Mb/s ethernet ports are available for communication and inclusion of I/O modules into the system through distributed slots. NI9234 module is used to collect dynamic signals, that is, acceleration in the present case. The relevant parameters for the cRIO-9074 chassis and NI9234 module are listed in Tables 1 and 2, respectively.
Technical characteristics of the cRIO-9074 chassis.

Technical characteristics of NI9234 module.

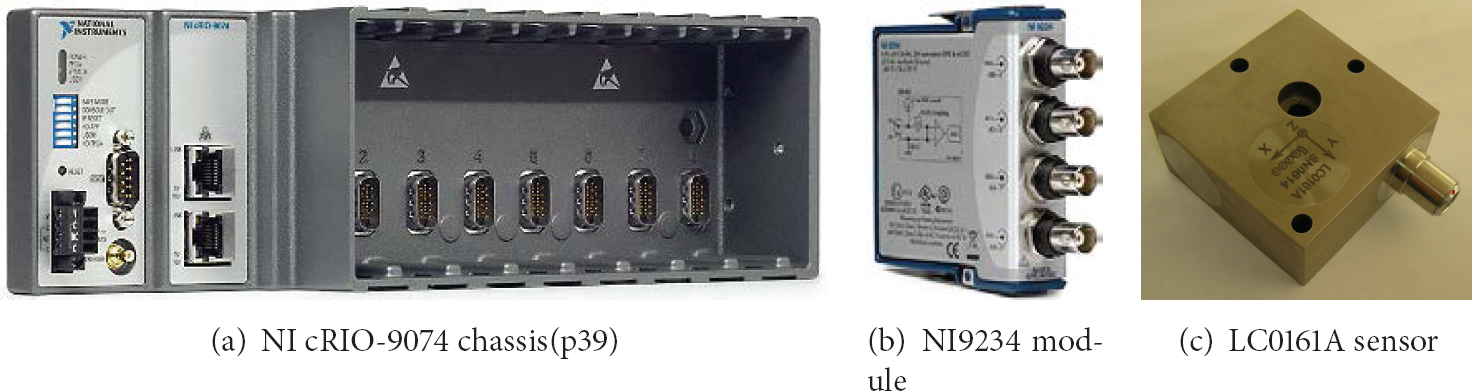
The measurement system.
LC0161A piezoelectric acceleration sensors produced by the LANCE Technologies Inc. are used for collecting acceleration signals in all the three directions. This type of sensors has inherited the advantages of traditional piezoelectric acceleration sensors. In addition to that, a mini IC amplifier is embedded in it, making the measurement process greatly simplified. For the same reason, the measurement precision as well as reliability in adverse environment is also remarkably improved. Listed in Table 3 are the main technical characteristics of the acceleration sensors.
Technical characteristics of acceleration sensor.

This system is verified through a bridge pier placed on a shaking table. Twelve sensors were distributed on the pier and table to record the acceleration when the table was excited by white noise. The response was compared and accorded well with that obtained by commercial data acquisition system [21].
3. Vibration Measurement Site and Environmental Vibration
The measurement site is located at a crossroad 500 m from the Zhongchun Road Station on the Jiuting Station—Zhongchun Road Station section of Line 9 of the Shanghai Metro. The site is shown by the star symbol in Figure 3(a) and a photo of the site is shown in Figure 3(b). There are three tunnels underground including a pair of straight ones and a curved one (Figure 4(a)); only the ground-borne vibration induced by train running in the bottom tunnel has been investigated. The area surrounded by the blue lines indicates a pavement on the ground. This location is close to the station and the train underground is either accelerating or decelerating. In addition, there are more buildings and human activities in this area. The influence of ground vibration is more important as compared to the case of long straight subway sections, which is associated with less buildings and populations. The site is open in the direction perpendicular to the line. The tunnel is 13.8 meters underground which is not deep; the soil above the tunnel is approximately horizontally layered and detailed information of the soil is available in Figure 4(b).

The subway section and measurement setup.

Measurement setup and soil condition of the measurement site.
The background environmental vibration was tested first. During the measurement process, normal road traffic and human activities were present. There were no train transportation or construction activities in the nearby area. The measurement points were placed on a line perpendicular to the tunnel as shown in Figure 4(a) by the red points numbered from 1 to 6. The distances of points 1 to 6 to the center line of the tunnel were 0 m, 5 m, 10 m, 15 m, 20 m, and 30 m, respectively.
Since point 1 was the closest to the main road (perpendicular to the pavement shown in Figure 4(a)), it is supposed to be influenced by the environmental vibration the most. The response at measurement point 1 was taken as an example for the environmental vibration. The vibration in X, Y, and Z directions was recorded and displayed in Figure 5. X refers to the direction perpendicular to the tunnel, Y refers to the direction along the center line of the tunnel, and Z refers to the vertical direction.

Time history and Fourier spectra of the background vibration acceleration.
It could be seen that the ground-borne vibration induced by normal vehicles and environmental noise was small. The acceleration amplitude in the X direction and Y direction was both less than 0.005 m/s2, while the amplitude in the Z direction was about 0.02 m/s2. The dominant frequency range of acceleration in the X direction was [0, 10] Hz and [50, 60] Hz. The dominant frequency range of acceleration in Y direction was [0, 10] Hz and [25, 35] Hz. The range for the acceleration in the Z direction was [0, 10] Hz and [50, 60] Hz. For all the three directions, dominant frequencies for background vibration were all below 60 Hz. It could also be seen that no obvious interference source was present.
4. Measurement of Vibration Induced by Underground Train
To measure the ground-borne vibration induced by the running underground train, the sensors have been placed at the same locations as that for measurement of environmental vibration.
4.1. Vibration at Measurement Point 1
Shown in Figure 6 are the time history and corresponding Fourier spectra of the vibration acceleration at the measurement point 1. As can be seen from the figure, the vibration induced by the underground train lasted for about 20 seconds. Between the time intervals 8 s to 28 s, twelve peaks of accelerations were observed. The first peak and last peak corresponded to the vibration induced by the front wheels and back wheels of the train. For the remaining ten peaks, five pairs of peaks for wheel set could be clarified, which was consistent with the actual conditions. From the duration of the five pairs of peaks for wheel sets and length of the train, the speed of the train was estimated to be 30 km/h, which accorded with the speed for low-speed operation near the station.

Time history and Fourier spectra of the vibration acceleration recorded by measurement point 1.
The acceleration amplitude in the X and Y directions was about 0.062 m/s2 and 0.044 m/s2, respectively, which were much more prominent than the corresponding environmental vibration. The amplitude in the Z direction was 0.145 m/s2, also much higher than the corresponding environmental vibration. So, for all the three directions, the influence of the environmental vibration could be neglected. The amplitude in Z direction was remarkably higher than that in the X and Y directions, so, in the investigated case, vibration in the Z direction was dominant.
Through fast Fourier transformation (FFT), the Fourier spectra for the acceleration at measurement point 1 were obtained. It could be seen that, for all the three directions, the acceleration corresponding to a frequency range of [30, 60] Hz was dominant, which was consistent with the frequency range for vibration of wheel tracks. It could also be seen that the acceleration spectra in the Z direction were wider than those in the other two directions, and the distribution was more complex. The stronger vertical vibration could be attributed to the shape of wave front caused by underground train. The wave front was a cylinder with the central axis coinciding with the train, so the dominant vibration at the ground would be vertical. As it is known that the human comfort is influenced more by the vertical vibration of the ground, so main attention should be paid to the ground-borne vibration in the Z direction. In the subsequent sections, only the acceleration in the Z direction was discussed.
4.2. Vibration of All Measured Points
The acceleration time history of measure points 1 to 6 is shown in Figure 7, standing for the vibration of ground 0 m, 5 m, 10 m, 15 m, 20 m, and 30 m from the center line of the tunnel. The corresponding Fourier spectra are shown in Figure 8.

Time history of the vibration acceleration.
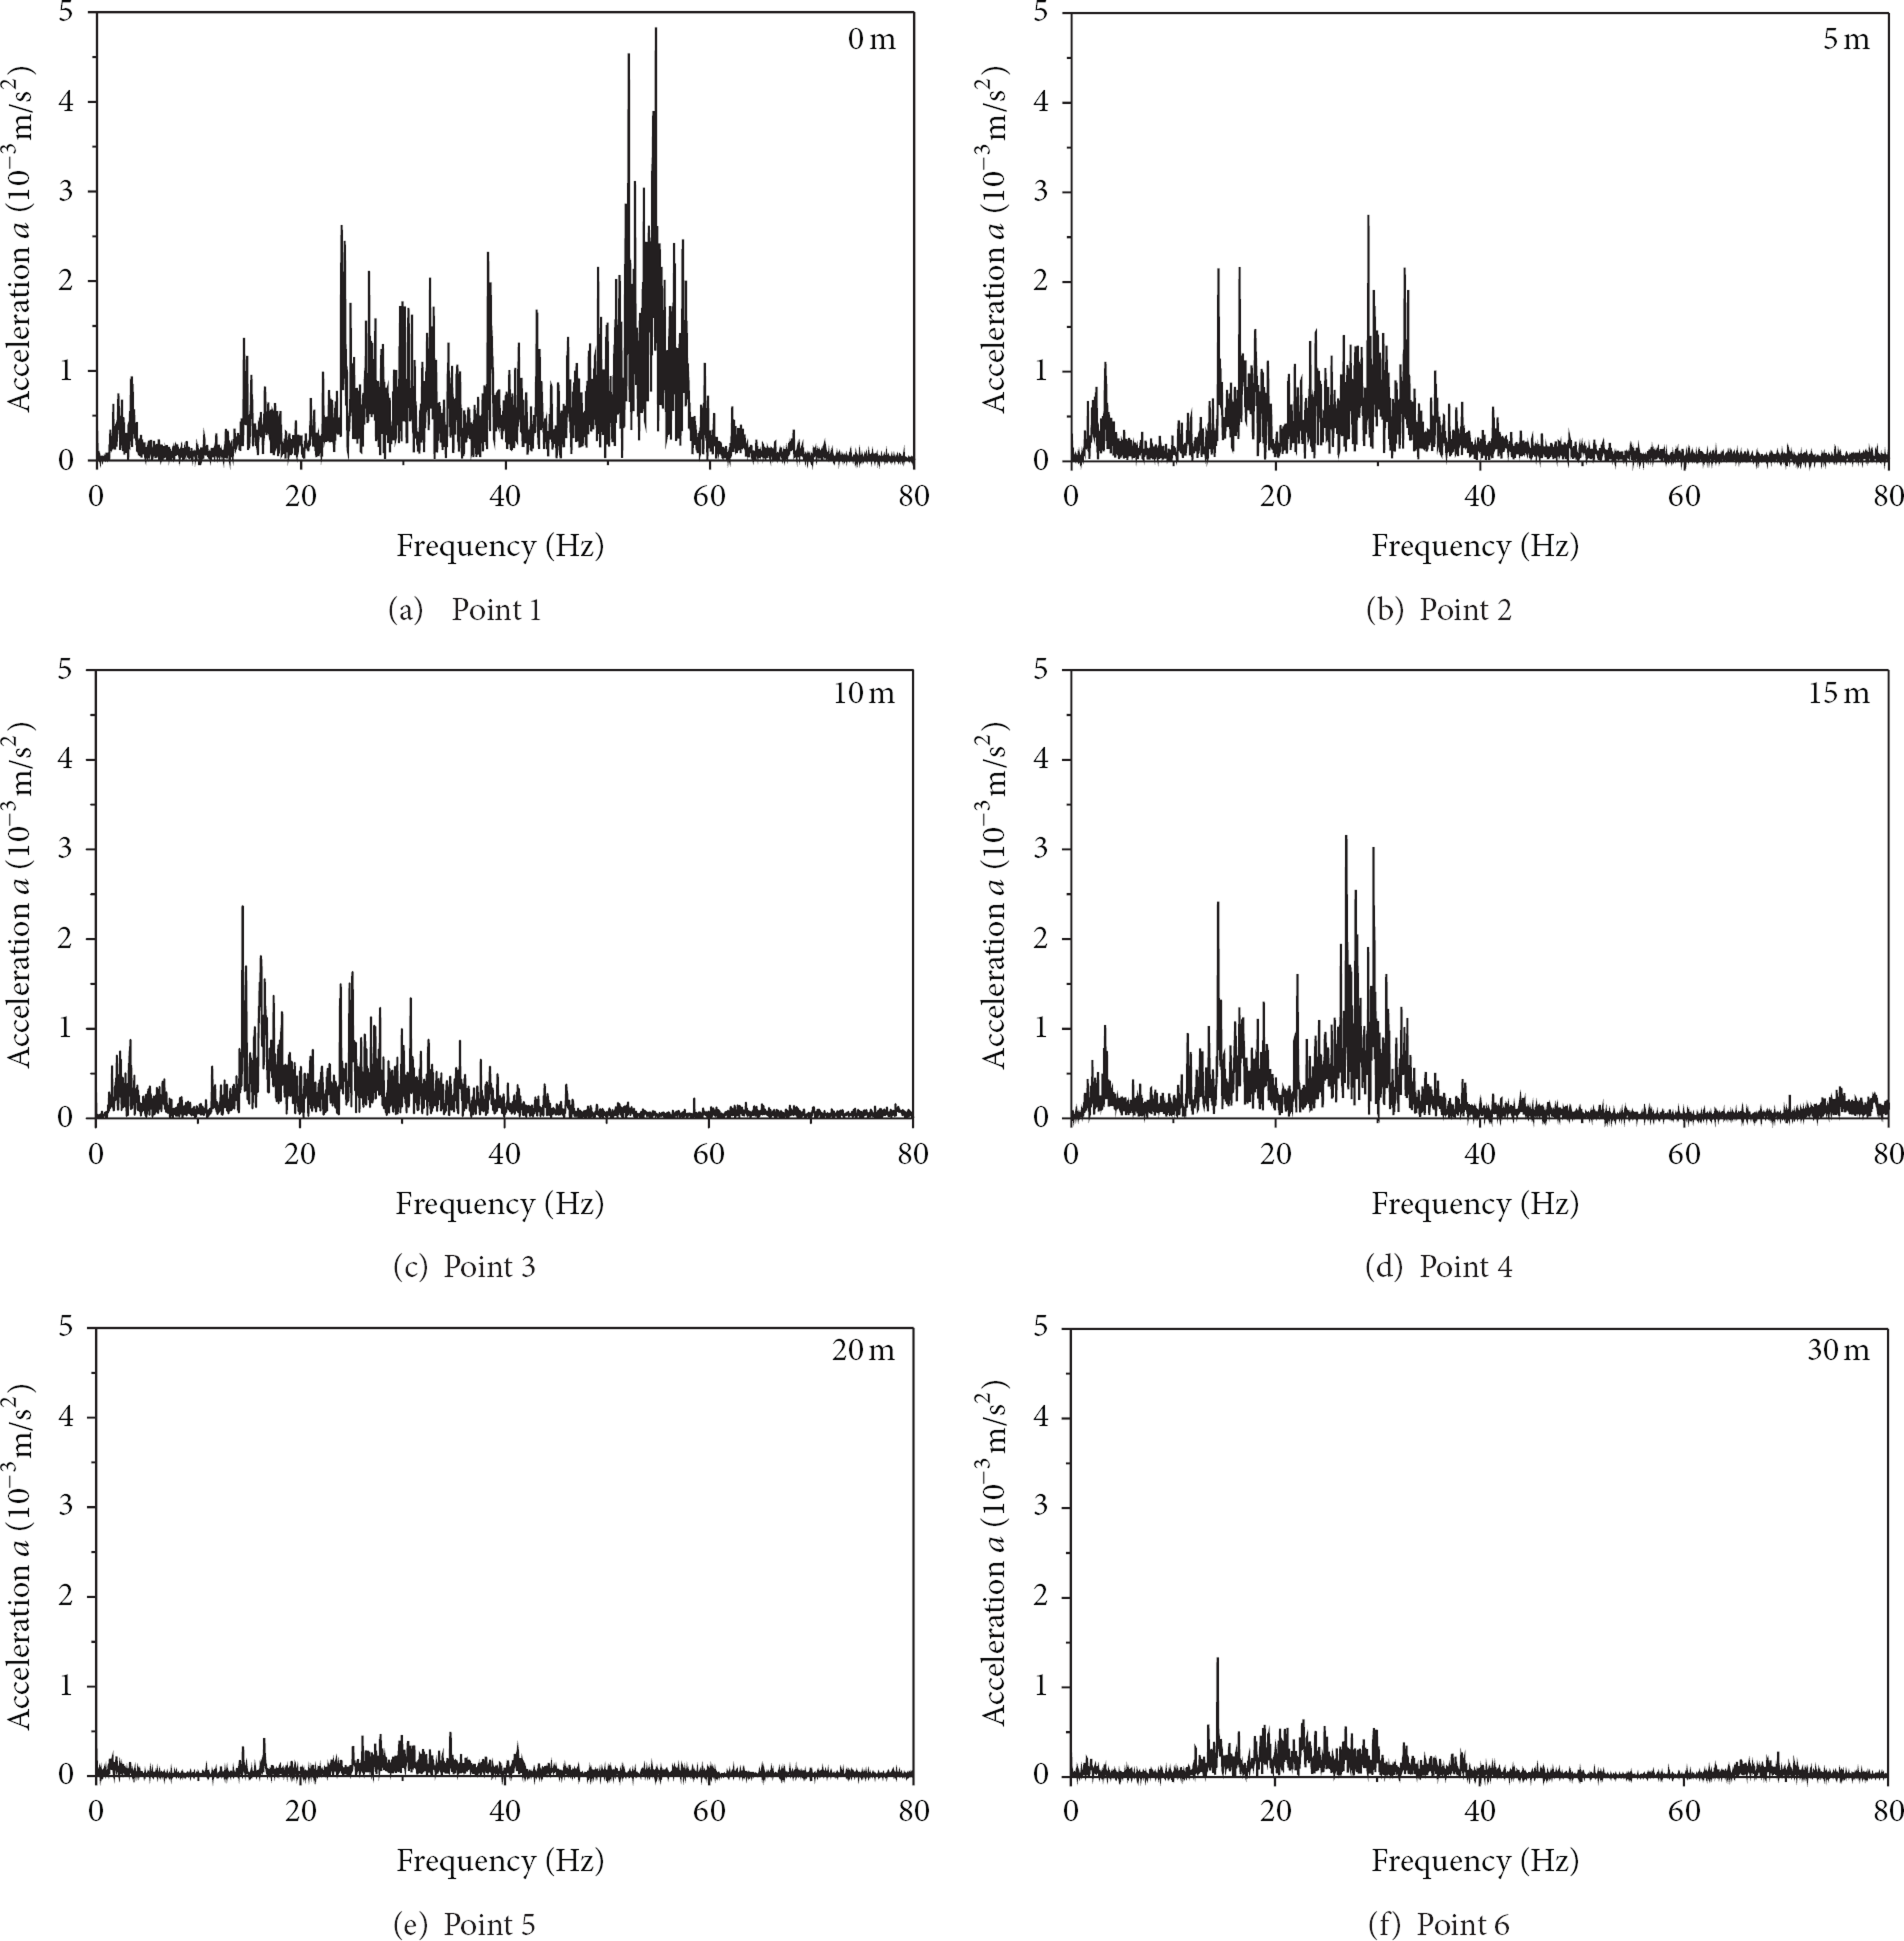
Fourier spectra of the vibration acceleration.
4.3. Vibration Decay with respect to Distance in terms of Acceleration and Fourier Spectra
From the time history of acceleration in Figure 7, wheel track peaks were observed at time 8 s, 10 s, 14 s, 18 s, 22 s, 26 s, and 28 s. Based on the vibration at these time instants, the amplitude of acceleration for all the measurement points is plotted in Figure 9. The characteristics of the acceleration distribution could be analyzed through the damping effect and filtering effect of the soil, as stated below.

Fourier spectra of the vibration acceleration.
From the Fourier spectra of acceleration in Figure 8 and acceleration amplitude in Figure 9, it could be clearly seen that the acceleration amplitude and the corresponding spectra decreased as the distance from the tunnel increased. When the distance between the measurement points and center line of tunnel reached 30 m, the vibration decayed to a very low level, and the high-frequency components decayed faster than the low-frequency components. This phenomenon was caused due to the damping effect of the soil.
For all the time instants recorded, the vibration of the ground decreased with the distance on the whole. The acceleration amplitude at point 4 (15 m from the tunnel) was obviously higher than that at point 3 (10 m from the tunnel), indicating amplification of vibration at point 4. For a train running underground, the vibration at the ground was transferred through the track, the shield, and the soil. Different soil configurations have different effects on the vibration. It can be reckoned that the soil under point 4 was not strictly horizontal or there were inclusions below this point, which caused the vibration beneath this point to be relatively easier to propagate. However, this easy-to-propagate effect was confined only to a small region and did not change the overall trend of vibration decay with distance.
By examining the corresponding spectra, it is found that the acceleration has been amplified for component within the frequency range 15~35 Hz, while the components for higher frequency were decreased. This indicated that vibration amplification might appear for ground-borne vibration induced by underground trains, and for the current configuration of soil this happened for low frequency components. It could also be seen that the amplitude for the component with frequency around 20 Hz was extremely low, indicating that present soil has strong filtering effect to vibration with frequency components falling in this range.
4.4. Vibration Decay with respect to Distance in terms of the 1/3 Octave Band RMS Spectra
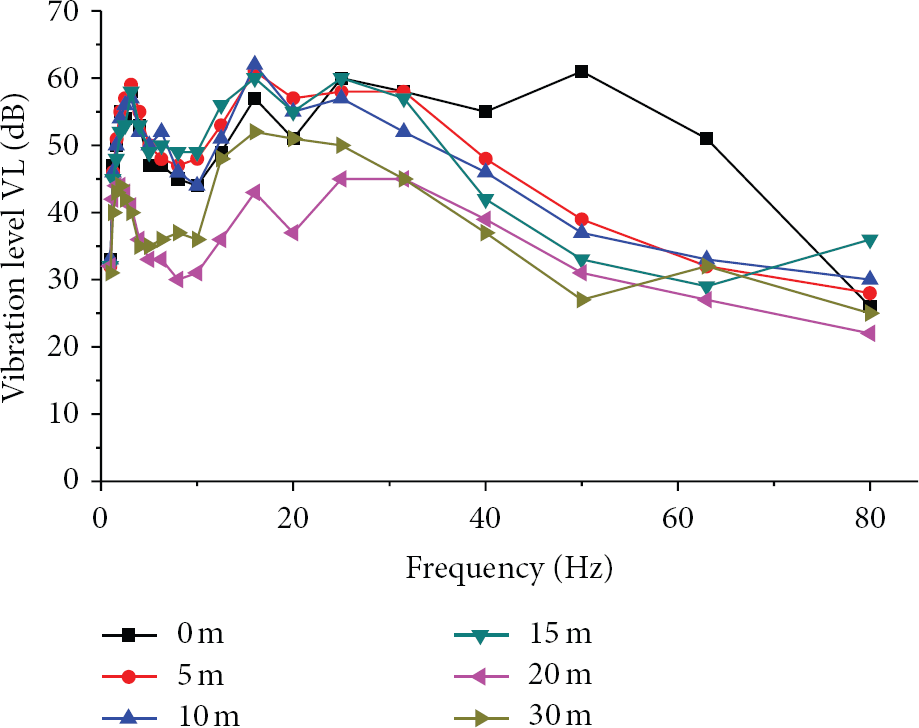
The 1/3 octave band RMS spectra of all points are shown in Figure 10. The relation between the spectrum and the distance is shown in Figure 11. On the whole, the spectrum decreased as the distance between the measurement point and tunnel increased. The low-frequency components decayed slower than the high-frequency components. Particularly the curve for the component with a frequency equal to 1 Hz was almost flat, with negligible fluctuation. The vibration of buildings nearby would be influenced by lower frequency components.
The 1/3 octave band RMS spectra with respect to the octave frequency.

The 1/3 octave band RMS spectra with respect to the distance.
However, the spectrum was amplified at the measurement point 4 (15 m from the tunnel) for frequency ranging from 8 Hz to 31 Hz. From 13 m to 18 m, peak spectrum was obtained for these low frequency components. For components with higher frequency, the spectrum decayed with the distance and no amplification zone was observed. This was consistent with the vibration amplification as stated in the previous section.
For all the measuring points, the vibration was reduced for frequency around 10 Hz, indicating a necking phenomenon. The explanation could be as follows. The vibration for components lower than 10 Hz was caused mainly by the environmental vibration and the influence of distance was small. But for higher frequency components, the vibration was attributed mainly to the underground train and the influence of environmental vibration was secondary. A similar phenomenon has been observed in [22], in which the frequency 10 Hz could be named as the joining frequency according to their definition.
5. Conclusion
For measurement of ground-borne vibration induced by trains running underground near the subway station, a system based on the CompactRIO system and LabVIEW platform has been constructed, and a distributed network of sensors has been applied for in-situ measurement. The following conclusions were arrived at.
Among the three directions, the vibration in the Z (vertical) direction is dominant as compared to that in the horizontal directions. The ground-borne vibration decreases as the distance from the tunnel increases and the high-frequency components decay faster than the low-frequency components, so the buildings on the ground are subjected mainly to the vibration of low-frequency components. For the presented site on the Shanghai Metro, there exists a vibration amplification zone which is about 15 m from the center line of the tunnel. The performance of buildings located by this distance from the tunnel should be paid with special attention. The components with a frequency between 8 Hz and 31 Hz are amplified in this zone, while those components beyond this range are not. Buildings with resonant frequency between 8 Hz and 31 Hz may be subjected to stronger influence from the running train. The environmental vibration for near-station locations is similar to that for long straight subway sections. However, the position of the amplification zone, dominant frequency range, and corresponding 1/3 octave band RMS spectra are different. Considering the significance of near-station section on human's lives, more attention should be placed on this section. By taking advantage of the sensing technology, networks of sensors have great potential in measuring and monitoring the vibration of ground and infrastructures induced by trains running underground.
Footnotes
Conflict of Interests
The authors declare that there is no conflict of interests regarding the publication of this paper.
Acknowledgments
The research has been supported by the National Science Foundation of China under the Grant no. 51009019 and Sino-German Science Foundation under the Grant no. GZ566.