
Abstract
The time-dependent shear-induced nonlinear viscosity effects of dilute surfactant solutions (CTAC/NaSal) at constant shear rate were tested by using the rheometer Couette cell. The apparent viscosity evolution curve can be divided into five stages: weak shear-thickening (Stage I), weak shear-thinning and plateau (Stage II), sharp shear-thickening (Stage III), oscillating adjustment (Stage IV), and rough plateau (Stage V). In Stage I, the stretching effects of shear flow lead to the weak increase in apparent viscosity at the inception of shearing. The apparent viscosity curve firstly decreases in Stage II and then levels off. The apparent viscosity plateau is caused by the forming and slipping of micellar lumps at the inner cylinder wall surface. Once the volume of lump exceeds a certain degree, the nucleation process of forming SIS is triggered, which is the beginning of Stage III and then the apparent viscosity increases sharply. The variations of apparent viscosity in adjusting period are rather complicated in Stage IV, and the variations mainly depend on the situation of SISs network. In Stage V, coupled with obvious oscillations, the apparent viscosity maintains a basically constant plateau value, indicating that the SISs network is fully developed and saturated at the corresponding shear rate.
1. Introduction
As a kind of complex fluid, surfactant solution has a complicated viscoelastic behavior that includes the presence of flow instabilities such as shear banding and spurt, flow induced phase transitions, and shear-thickening resulting from shear-induced structures (SISs) [1]. These typical behaviors have been studied intensely by using different techniques including rheometry [2–5], birefringence and flow visualization [2, 3, 6], and light and neutron scattering [5, 7] and by velocimetry [5, 6].
Under shearing, surfactant solution shows nonlinear viscosity effects due to molecular reorganization. One intriguing nonlinearity concerns the interpretation on the fact that the viscosity of surfactant fluid under deformation will increase greatly, resulting in a phenomenon known as shear-thickening. However, in previous works, divergences still remain on mechanism of the shear-thickening phenomenon and the relative internal structure in shear-thickened surfactant flow. It is the purpose of this study to provide new experimental insight into the nature of shear-thickening phenomenon.
Focusing on the surfactant viscosity changes, most of the studies are based on the flows with continuously increased shear stress or rate, which leads to a potential problem that some transient microscopic changes might be omitted or overlapped. Given that possibility, we carried out a series of rheological experiments under differently constant shear rates to survey the uninterrupted shear-induced evolution of surfactant viscosity. In addition, few researchers have paid attention to the initial viscosity variations when surfactant solution suffers shearing suddenly. In contrast, studies are focused mostly on viscosity behaviors after the “induction time” [8–13] to chase after the origin of shear-thickening. In our opinion, it is incomplete, since the initial variation is the origin of all the following behaviors of apparent viscosity. In order to look for the initial origin of shear-thickening, we have traced the whole apparent viscosity evolutions from the beginning of the second to 10000 seconds at differently constant shear rates. And, in fact, our experimental results have demonstrated the reasonability and necessity of our suspicion.
In order to contribute to the understanding of shear-thickening transition, the present work focuses on the transient viscosity effects of dilute surfactant solution with time at constant shear rate using the rheometer. The collected experimental evidences in these works allow us to show unequivocally the influence of shearing on the apparition of viscosity behaviors. In this paper, we will analyze and interpret the mechanisms of different stages of apparent viscosity evolving with time.
2. Experimental Apparatus and Procedure
2.1. Working Fluids
In the experiments, the tested cationic surfactant was cetyltrimethyl ammonium chloride (CTAC) (Shandong Fusite Chemical Co., Ltd., China, 99% purity), with a molecular weight of 320.0 g/mol. Sodium salicylate (NaSal) (Yixing City Shenguang Medicine Chemicals Co., Ltd., China, 99% purity), with a molecular weight of 160.1 g/mol, was used as the counterion to stabilize the solution structure. The surfactant solution was prepared by adding the same molarity of surfactant and counterion to the distilled water for the rheological measurements, marked by the concentration of CTAC, and a range of mass concentration aqueous solutions (300 ppm–1200 ppm) were made. The surfactant concentrations are higher than the CMC (critical micelle concentration) above which the micelles start to overlap [14, 15]. All the solutions were left to stand at least 3 days in order to reach equilibrium before testing.
2.2. Test Facility
The rheological viscosity characteristics of CTAC/NaSal aqueous solutions were measured with the AR1500ex Rheometer (TA Instruments). AR1500ex Rheometer can be controlled by stress, strain, or rate, which is capable of handling with many different types of samples, utilizing a range of geometry sizes and types. We did all the experiments with the geometry of double gap concentric cylinder system (the Couette cell) shown schematically in Figure 1. The major dimensions are listed in Table 1.
Geometry dimensions.


Schematical double gap concentric cylinder system.
All tests were carried out under the peak hold mode at differently constant shear rates (1 s−1, 5 s−1, 10 s−1, and 30 s−1); the temperatures were set at 15°C, 20°C, and 25°C controlled by Julabo F25 Refrigerated Circulators (manufactured by Julabo Labortechnick GMBH, Germany). Viscosity data were sampled at 1-second interval from the beginning, and the shearing duration for each new sample lasts for 10000 seconds.
The fresh surfactant solutions as well as solutions which were submitted to shearing, during an experiment, were completely transparent and free from foam and air bubbles. In order to allow a significant comparison of the experimental results, all the measurements were rigorously performed with the same standard procedure. For each experiment, we had used a new sample of the solution.
3. Results and Discussion
Figure 2 shows the time-dependent shear-induced viscosity evolutions of 1000 ppm at 20°C (the insert graph shows the same results in linear coordinates). The viscosity evolutions go through similar processes at four different shear rates and each evolving process can be divided into five stages (Figure 3): weak shear-thickening (Stage I), weak shear-thinning and plateau (Stage II), sharp shear-thickening (Stage III), oscillating adjustment (Stage IV), and rough plateau (Stage V). We will make detailed analyses on the mechanisms of these five stages one by one in the following sections.
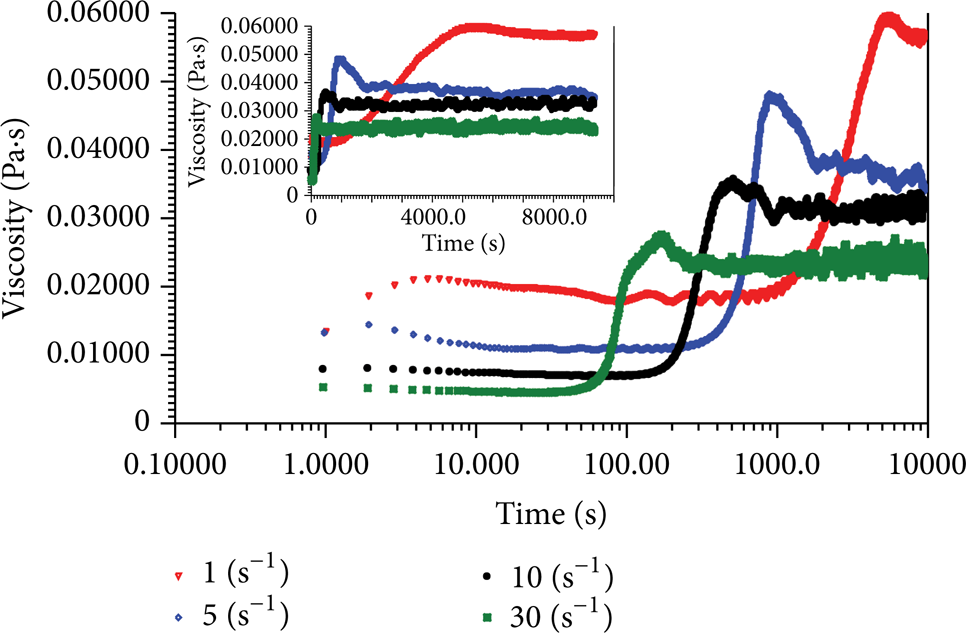
Time-dependent shear-induced viscosity evolutions of 1000 ppm at 20°C.

Apparent viscosity evolution of five stages (1000 ppm, 20°C).
Stage I. It is a peculiar behavior for dilute surfactant solution thickening at the inception of shearing, which, in many previous researches, is absent [5, 16–19]. That is probably because this transient thickening is very weak and happens in a very brief period of time (there is even no apparent thickening at 10 s−1 and 30 s−1), under the combined effects of increasing shear rate (or stress) and time, which will be easily concealed. A question may be raised that whether the weak thickening is caused by the mechanical instability of rheometer itself. To dispel this misgiving, we have retested the sample of 1000 ppm and fetched viscosity data at 0.18 second interval for the test of Figure 4, while other tests were at 1 second interval.

Startup instability of rheometer at the very beginning of shearing (1000 ppm, 20°C).
It can be seen that, indeed, rheometer has startup instability, but the instability vanishes completely in 1 second after startup. Therefore, the weak thickening in Stage I reflects the shear-induced internal structure deformation. In fact, the similar thickening has also been observed by some researchers [10, 20, 21]. Dehmoune et al. considered that it was due to the elastic response of sample opposing the disentanglement action of shear flow. If that is the case, there should be some oscillations, which are the typical features of elastic effect, whereas the thickening curves are very smooth (see Figure 2). Hu et al. suggested that it may represent some kind of pretransitional “wetting” of the inner surface by an incipient SIS. Regrettably, this statement cannot explain the significant shear-thickening observed by Dehmoune et al.
We all know that the dissociative molecules and micelles are in a thoroughly random state in the well-rested solution. Suffering shearing, the initial equilibrium is broken and molecules and micelles obtain energy when they are stretched by shear flow. During this stretching process, the micellar configurational entropy is reduced; namely, shearing breaks the initially random and curled state (with the highest configurational entropy) of micelles which incline to be in an oriented arrangement under shearing. This realigning process, inevitably, leads to the increase in micellar entanglements transiently. That might be the root cause which brings about the weak shear-thickening. There is no weak thickening at higher shear rates (10 s−1 and 30 s−1) because the new unstable micellar entanglements are destroyed in more shorter time than the time at 1 s−1 and 5 s−1. In fact, no permanent new structures are observed in the gap of the Couette cell in this stage, except that occasionally traces of structures appear at the inner cylinder surface for a short time and then disappear [10]. This weak thickening lasts just for several seconds (less than 10 seconds), and solution is transformed into the second stage under shearing.
Stage II. This stage consists of two sections: the weak shear-thinning and the first plateau in the viscosity evolution curve, which is the so-called induction period [10, 22, 23]. Figures 5(a)–5(d) are the enlargements of Stage II of the four curves in Figure 2 (the insert graphs show the corresponding entire curves).

Larger versions of Stage II at (a) 1 s−1; (b) 5 s−1; (c) 10 s−1; and (d) 30 s−1 (1000 ppm, 20°C).
The shear-thinning should be attributed to the unwrapping of the not strong micellar entanglements and the aligning with shear flow of micelles. But how can the apparent viscosity maintain constant for a relatively long time (tens or even hundreds of seconds) when suffering shear? We know that surfactant solution cannot maintain apparent viscosity constant without any internal structure changes since the sustained shearing is acting on it. And any micellar growth or forming of entanglements will give an increase in apparent viscosity. Either way, since the flow can remain apparently stable for that long time, what disturbs the till?
There was a stress plateau in the constantly increased shear rate or stress surfactant flow [5, 16–19], and it was thought to result from the forming of shear bandings [24–27]. In addition, occasionally traces of structures appeared at the inner cylinder surface for a short time and then disappeared, which was observed by Hu et al. [10] in the similar stage. Inspired by these appearances, we surmise that there are some microscopic micellar lumps in shear flow (see Figure 6). Caused by shearing, these micellar lumps are essentially some microscopic and local entanglement structures of several micelles and actually the origins of the so-called SISs. According to the shear-banding theory, stress is the greatest at the inner cylinder wall surface (σ∝r−2); therefore, the structural changes of surfactant solution happen here firstly. At the end of shear-thinning in this stage, solution near the inner cylinder wall is in a dynamic equilibrium of micelles entangling and disentangling, coupled with some micellar lumps slipping away from the inner cylinder wall surface to the outer wall as transporters of the constant shearing energy. This equilibrium keeps apparent viscosity of the near inner wall solution in an approximately stable state under shearing. However, the slipping and the moving of micellar lumps cause some oscillations (slight like some irregularities) in apparent viscosity, and the oscillation amplitude becomes bigger with time (see Figure 5). It is because, as shear time goes on, there are more and more micellar lumps and the volume of lump becomes bigger and bigger.

Schematical micellar lump.
Initially, these lumps are isolate and then, with number increasing, some of them are binded together by entanglements. Once the volume of lump exceeds a certain degree, the nucleation process of forming SIS is triggered, which is the beginning of Stage III. We also find that the higher the shear rate, the shorter the induction time and the less the oscillation amplitude. It means that a higher shear rate can trigger the nucleation process of forming SIS more easily for the same surfactant solution. At this point, we can conclude that the forming and slipping of micellar lumps at the inner cylinder wall surface make the apparent viscosity maintain a steady state, while the aggregation and fusion of these lumps disturb the till.
Stage III. This stage corresponds to the process of sharply increasing apparent viscosity caused by the formation of SISs. To date, almost all researchers studying on the shear-thickening phenomenon of surfactant solution have made their personal explanations on the internal structures of SIS and the mechanism of shear-thickening. It has been widely accepted that the formation of SISs should be responsible for the shear-thickening phenomenon. However, opinions are different on the formation mechanism of SIS. Hu et al. [10, 11] considered that the SISs only nucleate homogeneously throughout the whole shear cell in an intermediate range of shear stresses, whereas it is further preferred that the shear-thickening progresses thoroughly nonhomogenously in all situations [17, 20, 28, 29]. Furthermore, for low-concentration solutions, some experiments [8, 30, 31] have proved that shear-thickening may be a kind of nonequilibrium shear-induced phase transition. However, it has also been suggested that hydrodynamic instabilities may play an important role in the shear-thickening behaviour [17, 20, 28, 29]. Olmsted and Lu [32], as well as Porte et al. [33], attempted to develop theories which incorporate ideas about nonequilibrium phase transitions and hydrodynamic instabilities. But so far it is still difficult to determine whether a description involving a nonequilibrium phase transition or a hydrodynamic instability is more appropriate.
According to our experimental results, it seems that the shear stick-slip process [5, 11, 34] at the inner cylinder wall of rheometer provides an energy release, which leads to the initial instability of shear flow. Then the instability causes the entangling of micelles, which leads to further instability in shear flow. The effect of this feedback mechanism finally results in the formation of SISs. In other words, once the first instability is triggered in the Couette cell of rheometer, the flow becomes nonhomogeneous throughout the whole shearing process. Correspondingly, the oscillations caused by shear flow instability go with the evolution of apparent viscosity all along (see Figure 2). The appearance that the SISs nucleate homogeneously throughout the whole shear cell observed by Hu et al. [10, 11] is quite possible due to the fact that the entire nonhomogeneous nucleation process achieves a fairly short time period at the relatively high shear stress.
Stage IV. There is a significant decrease in apparent viscosity following the sharp increase in Stage III as shown in Figure 3, which can be analogous to a later adjustment process. The decrease of apparent viscosity suggests that the SISs may have undergone some kind of mechanical failure, such as yielding or fracture. Because of the quick development of SISs in Stage III, there are structural defects in SISs network inevitably. Due to the high apparent viscosity and the huge SISs network, the stick-slip effect becomes much stronger and more frequent, which produces many high stress concentration areas. Once the structural defect in SISs network happens to be in the high stress concentration area, the network will be torn apart from the defect, which leads to apparent viscosity decrease. Without doubt, at the same time, some smaller micellar fragments will be integrated into the huge SISs network continuously. The stick-slip process provides the motivity for breaking and reforming of SISs, so to speak. After a period of adjustment, the whole SISs network becomes more compacted and homogenous. The adjusting period lasts for several hundreds (see Figure 2) or even thousands of seconds as shown in Figure 7, where the apparent viscosity keeps on adjusting procedure until the end of experiment and Stage V is absent in these curves.
Time-dependent shear-induced apparent viscosity evolutions (15°C, 1 s−1).
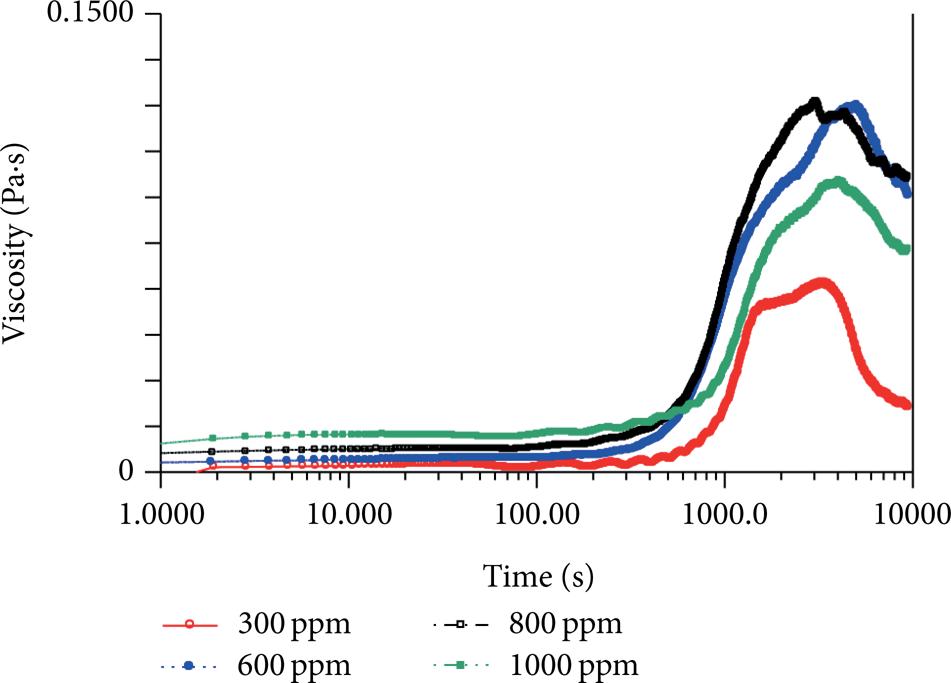
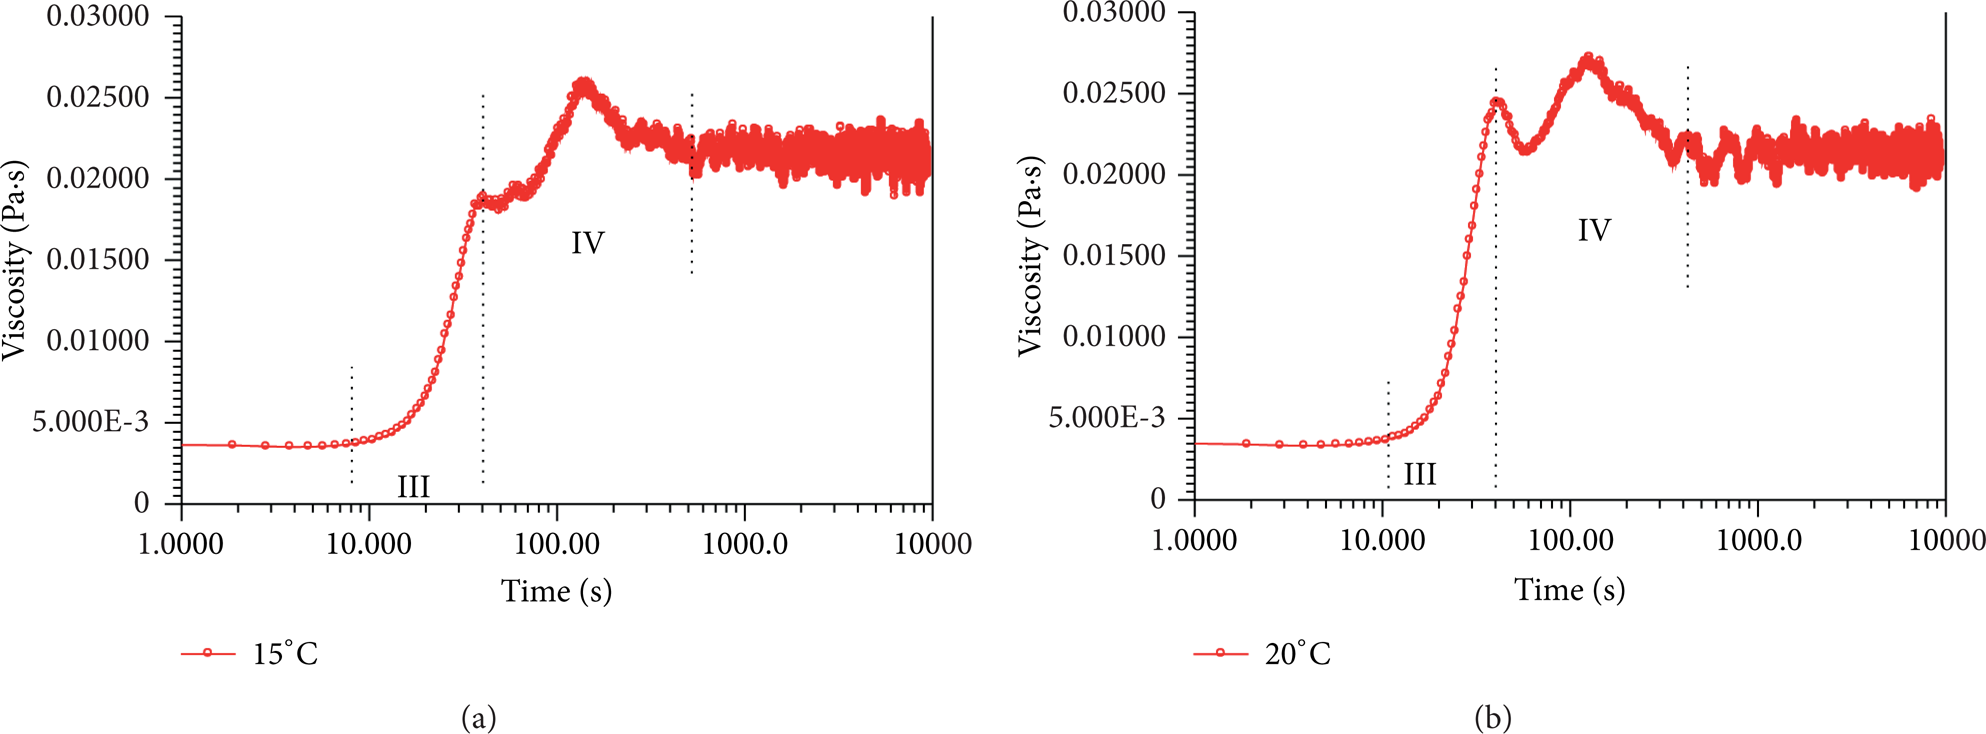
It is important to note that the adjusting procedure does not necessarily result in the decrease in apparent viscosity; in fact, sometimes viscosity goes up coupled with oscillating as shown in Figure 8. We have found that the similar phenomena always happen in more dilute solutions at relatively high shear rate (such as 300 ppm at 30 s−1). For very dilute solution, the SISs formed in Stage III under high shear rate are very spare and not saturated; thus, the stick-slip effect is not as influential as at the beginning of Stage IV (the decrease is small as shown in Figure 8). Coupled with later oscillating and adjusting, it is easier for isolated micellar fragments and individual micelles to get into the SIS bulk, since they are more simpler than the ones in higher concentration solution, leading to an increase in apparent viscosity. Furthermore, we also find that this apparent viscosity increase-adjustment happens earlier and sooner for higher concentration (but still very dilute) solution (see Figures 9(a) and 9(b)). To be sure, this apparent viscosity should be categorized into Stage IV, due to the concomitantly obvious oscillations (looking like some vesicles), which is very different from the nucleating process of forming SISs.

Adjusting increase in apparent viscosity in Stage IV (300 ppm, 30 s−1).
Earlier and sooner increase-adjustment in apparent viscosity in Stage IV (600 ppm, 30 s−1).
Stage V. In this stage, the apparent viscosity maintains a basically constant plateau value after the adjusting period, coupled with obvious oscillations (see Figures 2 and 3). The stable apparent viscosity indicates that the SISs network is fully developed and saturated at the corresponding shear rate. Moreover, the obvious oscillations may be caused by the breaking-remerging process between SIS bulk and isolated micellar fragments in solution. Also the stick-slip mechanism mainly gives rise to the dynamics of oscillations. In this sense, the oscillation magnitude is a mirror of the micellar fragment size, as well as the saturation extent of SISs network, since it is easier for the more developed SISs network to absorb more smaller isolated micellar fragments. Note that sometimes the oscillations become particularly striking [5], with some oscillations exceeding 400% [11]. Similar appearance has also been observed in our experiment (see Figure 10). On this occasion, the whole solution grows and develops into a kind of homogenous and elastic bulk.
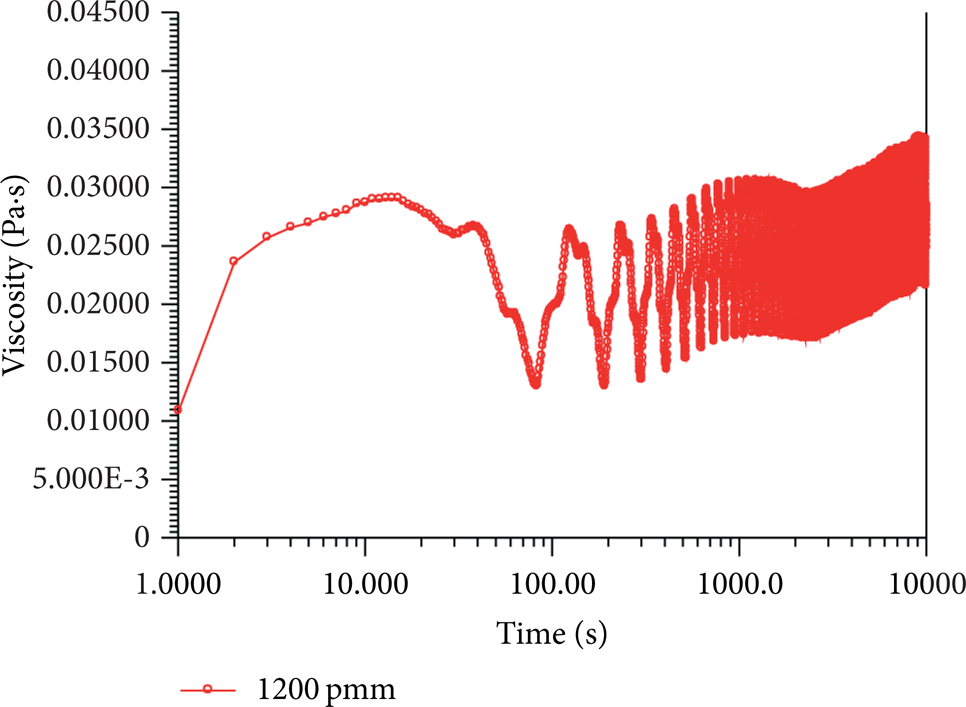
Particularly striking oscillations in Stage V (25°C, 1 s−1).
4. Conclusions
The time-dependent shear-induced nonlinear viscosity effects of dilute surfactant solutions (CTAC/NaSal) at constant shear rate were tested by using the rheometer Couette cell. The duration for each sample lasts for up to 10000 seconds, and the obtained apparent viscosity evolution curves contain a massive amount of information, reflecting the combined effects of shearing and time on the apparent viscosity variations. The evolution curve can be divided into five stages: weak shear-thickening (Stage I), weak shear-thinning and plateau (Stage II), sharp shear-thickening (Stage III), oscillating adjustment (Stage IV), and rough plateau (Stage V).
In Stage I, under the stretching effect of shear flow, the initially random and curled micelles incline to be realigned, and the realigning process inevitably leads to the increase in micellar entanglements transiently, which causes the very weak apparent viscosity thickening at the inception of shearing. The apparent viscosity curve firstly decreases in Stage II and then levels off. The shear-thinning should be attributed to the unwrapping of the not strong micellar entanglements and the alignment with shear flow of micelles. As time goes on, there are some micellar lumps formed gradually, which make the apparent viscosity maintain a plateau value. These lumps merge with each other constantly under shearing. Finally, once the volume of lump exceeds a certain degree, the nucleation process of forming SIS is triggered, which is the beginning of Stage III. According to our experimental results, the flow instability resulted from shear stick-slip causes the micellar entanglement, which intensifies the flow instability. The effect of this feedback mechanism finally results in the formation of SISs. Surely, the nucleation process of SISs is nonhomogenous according to our results, because there are structural defects in the SISs network; also due to the stick-slip mechanism, the dynamics of breaking and reforming of the SISs are given rise to. The variations of apparent viscosity in adjusting period are rather complicated in Stage IV, and the variations mainly depend on the situation of SISs network (related to concentration, shear rate, and temperature). In Stage V, coupled with obvious oscillations, the apparent viscosity maintains a basically constant plateau value, indicating that the SISs network is fully developed and saturated at the corresponding shear rate.
One final note is that the weak shear-thickening in Stage I is almost always ignored. As the origin of all the following behaviors of apparent viscosity, the apparent viscosity performances in this stage may have important implications for the study on mechanisms of the following significant shear-thickening. Therefore, the neglect of this stage may result in understanding biases on the research of surfactant solution shear-thickening. Some of the divergences in previous works on the mechanisms of shear-thickened surfactant flow may be outcomes of the biases. Tracking along the whole apparent viscosity evolution from the inception of shear allows us to find that the shear flow instability caused by the stick-slip effect is the root cause of shear-thickening and the nonequilibrium phase transition is just the product of the hydrodynamic instability.
In the following paper, we will make detailed analyses on the influences of temperature, shear rate, and concentration on the time-dependent apparent viscosity at different stages.
Conflict of Interests
The authors declare that there is no conflict of interests regarding the publication of this paper.
Footnotes
Acknowledgments
The authors gratefully acknowledge the financial supports from the Project of the National Natural Science Foundation of China (nos. 51225601 and 51076124) and the Fundamental Research Funds for the Central Universities.