
Abstract
In order to ensure integrity of thermal protection system (TPS) structure for hypersonic vehicles exposed to severe operating environments, a study is undertaken to investigate the response and thermal-acoustic fatigue damage of a representative multilayer TPS structure under combined thermal and acoustic loads. An unsteady-state flight of a hypersonic vehicle is composed of a series of steady-state snapshots, and for each snapshot an acoustic load is imposed to a static steady-state TPS structure. A multistep thermal-acoustic fatigue damage intensity analysis procedure is given and consists of a heat transfer analysis, a nonlinear thermoelastic analysis, and a random response analysis under a combined loading environment and the fatigue damage intensity has been evaluated with two fatigue analysis techniques. The effects of thermally induced deterministic stress and nondeterministic dynamic stress due to the acoustic loading have been considered in the damage intensity estimation with a maximum stress fatigue model. The results show that the given thermal-acoustic fatigue intensity estimation procedure is a viable approach for life prediction of TPS structures under a typical mission cycle with combined loadings characterized by largely different time-scales. A discussion of the effects of the thermal load, the acoustic load, and fatigue analysis methodology on the fatigue damage intensity has been provided.
1. Introduction
For high performance military aircrafts and future high-speed civil transport planes, certain structural skin components are subjected to very large acoustic loads under an elevated thermal environment. Some structural components excited by the intense acoustic and thermal-mechanical loads (∼1650°C temperature and ∼180 dB Overall Sound Pressure Level, OASPL) will commonly exhibit complex structural response characteristic. For instance, the thermal protection system (TPS) structure, which is a critical component for any hypersonic flight vehicle, will encounter extremely hot surface temperatures with large overall temperature gradients in conjunction with very high acoustic pressures and long duration exposure to these environments. The dual effect of high acoustic and the thermal loadings will result in degradation of material properties and large static (thermal) stresses superimposed on random dynamic stresses and has given rise to the so-called thermal-acoustic sonic fatigue issue [1]. For example, the ceramic matrix composite (CMC) TPS panels have been tested at 160 dB OASPL and 1000°F for eight minutes in MDA'S high temperature progressive wave chamber, and the tests’ results showed that the first CMC face-sheet on the hot side of the panel had almost completely delaminated, which also created a crack in the foam core material due to the combined thermal acoustic loadings [2]. In addition, it was found that the failure occurred in the attachment techniques due to the acoustic excitation for carbon/carbon TPS panels, which have been tested at 163 dB. For the carbon/carbon wedges, which have been tested with the narrow spectrum at 1000°F, it has been demonstrated that the predominant type of failure was breakage across the fibers near the clamped end of the specimens due to the random fatigue loading at elevated temperature [3].
In order to protect the substructure of a hypersonic flight vehicle, a multilayer structure using high temperature resistant 2D plain-woven C/SiC ceramic composite panel adhesively bonded to a thick Si-C-O aerogel composite thermal insulator is used as a representative thermal protection system structure. However the high temperature C/SiC ceramic composite panel at the top face sheet (TFS) of the typical TPS structure is structurally weak with low fatigue resistance and can fail easily. In order to ensure structural integrity, it is always desired to have an accurate and computationally efficient methodology to investigate the structural response to a combined loading and its thermal-acoustic fatigue in an extreme environment [1].
The extensive research has been performed by reduced-order methods for thin structures, which respond to imposed thermal and acoustic loads in a geometrically nonlinear static and random fashion since 1980s. The work by Mei et al. [4] for a flat plate configuration implemented a special purpose FEA code, in which the nonlinear modal stiffness can be evaluated directly from known nonlinear finite element stiffness matrix. Indirect nonlinear modal stiffness evaluation method arose based on implementing reduced-order nonlinear analyses in the context of any commercial finite element analysis. The works of McEwan et al. [5, 6] and Rizzi et al. [7, 8] are good examples of the indirect stiffness evaluation approaches. With the direct/indirect nonlinear modal stiffness evaluation method at hand, the large amplitude vibration about multiple equilibrium configurations, which is called “snap-through” response, of the buckled thin structure (beams, plates, or shell) excited by the influence of loading (elevated temperature and acoustic load) has been studied extensively. However structural complexity of the typical multilayered TPS structure with three-dimensional geometrical characteristic and a large temperate gradient in the transverse direction has received little attention.
The structural complexity of the representative thermal protection system structure dedicates the use of commercial finite element codes. It has been further demonstrated by Turner and Patel [9] that the thermal-acoustic analyses can be implemented in the commercial finite element codes, Abaqus or Nastran, and an excellent agreement with the research code [10] has been achieved by comparison as a validation of commercial FEM software implementations. Results were obtained based on an assumption that the structure will undergo small dynamic motions about a stable static shape. Accordingly, it can be deduced that the commercial finite element code Abaqus is capable of modeling and analyzing the complex thermal protection system structure under a combined loading environment accurately.
There are two known algorithms for sonic fatigue life assessment under an acoustic loading. The first one includes the algorithms using numerical methods of cycle counting in time domain, which involves in extensive stress time histories simulation to formulate reliable statistical considerations about the distribution of rainflow cycles [11], the fatigue damage, and the structure service life; therefore it is costly and time-consuming. The other one is a frequency-domain analysis based on the so-called spectral methods, in which the irregular stress response is modeled as a random process [12]. Spectral-based methods make use of analytical formulae to correlate the distribution of rainflow cycles, the fatigue damage, and the fatigue life to the power spectral density of the process. Compared to the fatigue life assessment in time domain, the approach is easier and quicker especially in the structural design stage. However the best fit spectral parameters, which relates the distribution of rainflow cycles to the spectral density of the process needs to be determined.
The present work offers a procedure using the commercial finite-element (FE) approach, which is necessary to achieve the desired modeling fidelity, to conduct a structural response analysis of the representative multilayer TPS structure under a combined thermal-acoustic loading environment. The slowly varying heat transfer problem and quasistatic stress analysis under thermal and/or aerodynamic pressure loads are solved using the implicit solvers in the procedure, while the random response analysis required for rapidly changing acoustic pressure can be solved using an explicit solver with full physical degree-of-freedom or reduce-order methodology. However due to the thickness of the proposed TPS structure and potential imposed boundary conditions, the linear dynamic response analysis following the nonlinear static thermoelastic analysis is implemented based on an assumption of a small amplitude motion about a thermally induced geometrical nonlinear stable-static configuration. The strong assumption is further verified by the analysis carried out in full physic DoF using explicit solution technique. The thermal load effects on the dynamic characteristic and acoustic response of the structure have been studied through random response analysis.
In order to evaluate integrity of the multilayer TPS structure under a combined thermal-acoustic loading, the following high-cycle fatigue analysis of the configuration is performed using the rainflow cycle counting method in time domain and a spectral-based approach in frequency domain under a linear cumulative damage assumption. The comparison of results obtained from both methods has been given to evaluate the applicability. The studies aimed at validating the thermal-acoustic fatigue estimation methodology for the multilayer TPS configuration and exploring the effects of the thermal load and the acoustic load on the damage intensity and sonic life of the TPS structure, respectively.
2. Numerical Modeling
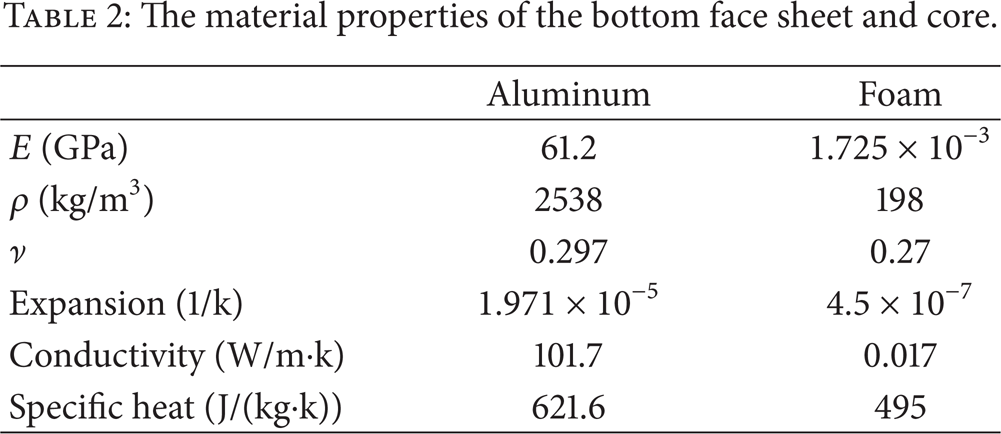
A typical multilayer TPS structure in present study is composed of three layers. The TFS with dimensions of 0.3 m × 0.3 m × 0.0025 m is a high temperature resistant, transversely isotropic 2D plain-woven C/SiC ceramic material, which is manufactured using chemical vapor infiltration (CVI) technique and adhesively bonded to the core structure. The function is to carry aerodynamic pressure and acoustic loading at elevated temperature for hypersonic vehicles. The isotropic thermal insulation core with dimensions of 0.3 m × 0.3 m × 0.022 m is made of mullite fiber reinforced Si-C-O aerogel composite with very low thermal conductivity [13] and adhesively bonded to the metallic bottom plate. The bottom plate is made of 0.38 m long × 0.38 m wide × 0.005 m thick isotropic aluminium material, which represents the substructure of the hypersonic vehicle. The configuration of the multilayer TPS structure in the present study is given in Figure 1. The thermal and mechanical properties of each layer material are given in Tables 1 and 2 and Figure 2 [13, 14]. It is noted that the variation of material properties of the top face sheet (TFS) material with temperature is included in the model. The four edges of the bottom face sheet (BFS) have been fully constrained to simulate the compliance of the surrounding structures, adjacent TPS structures, and frames in the flight vehicle. The TFS and BFS of the TPS structure are constructed using S4R (4-node general purpose reduced integration with hourglass control finite membrane strain) shell elements with six active degrees-of-freedom (DoFs) per node in Abaqus 6.10. The core is constructed with three-dimensional 8-node first-order solid brick C3D8I element, which is one of first-order elements enhanced by incompatible modes to improve its bending behavior. In order to model the adhesively bonding interaction between the face sheet and the core, surface-based “tie” constraint is applied between the face sheet and the core to make all active DoFs equal for a pair of tied surfaces. Mesh convergence is ascertained by reducing the dimensions of the element by half and repeatedly solving a stress-free eigenvalue problem until the difference in the fundamental frequency was reduced to below 2%. This procedure results in the element size of 8.0 mm and the total number of elements is 8080. The mechanical BCs of the panel are also presented in Figure 3.
The top face sheet temperature-dependent material properties.

The material properties of the bottom face sheet and core.

A representative multilayer TPS panel.

Thermal properties of the top face sheet. (a) Thermal conductivity variation with temperature; (b) thermal expansion coefficient variation with temperature; and (c) specific heat variation with temperature.

FE model of the full TPS structure.
The reliability of the numerical model has been validated by the frequencies of the modal test of the similar structure at room temperature. The fundamental frequency of the similar structure, which has a few metallic mechanical attachments compared with the panel in Figure 1, is about 175 Hz, and the result of the fundamental frequency obtained through the FEM numerical modeling with the solid brick C3D8I element for the core is 174.1 Hz. Hence the results given by the numerical modeling agreed with the experimental results very well at room temperature. The multilayer TPS structure also can be modeled as a “sandwich” shell structure by stacking continuum shell elements from TFS to the BFS. However the fundamental frequency results from the FE “sandwich” shell model do not match the results obtained from the model, in which the core is constructed with the solid brick C3D8I element. The comparison showed that if the core of the TPS structure is constructed with the “sandwich” shell such as SC8R, which is an 8-node hexahedron and general-purpose shell element and can be used to model the thick sandwich structure in Abaqus 6.10, the fundamental frequency is 74.5 Hz. However if the core of the TPS structure is modeled with the solid brick C3D8I element, the fundamental frequency is 113.4 Hz. The dramatic difference between them is due to the simplification of the transverse shear stiffness for the shell element, in which the transverse shear strain is assumed to be constant through the thickness of the shell with the use of shear correction factors. Accordingly, the three-dimensional 8-node first-order solid brick C3D8I element for the core of the TPS structure is ideal in the investigation. Hence the hybrid elements including shell and solid elements with the “tie” constraint are used to conduct the complicated 3D built-up TPS structure.
3. Analysis Procedure
3.1. Loading Definition
The prescribed heat flux profile, representative of a simplified thermal flux condition in a combined thermal-acoustic ground experiment, is presented in Figure 4. The ambient air temperature is approximated as 23.5°C; uniformly distributed heat flux q increases with time linearly until 150 s and reaches the maximum applied heat flux, 5000 W/m2. The total time for the applied heat flux q is 2000 s. The acoustic loading spectrum is give as in Figure 5. An acoustic loading level of an overall sound pressure level (OASPL) of 170 dB (re: 20 μPa) is considered for the TPS structure. The acoustic load was determined by the prediction given in [15]. It was also illustrated that future aircraft structures will be excited by the intense acoustic and mechanical loads, such that the temperature might reach 3000°F and OASPL could reach ∼180 dB [16–19].
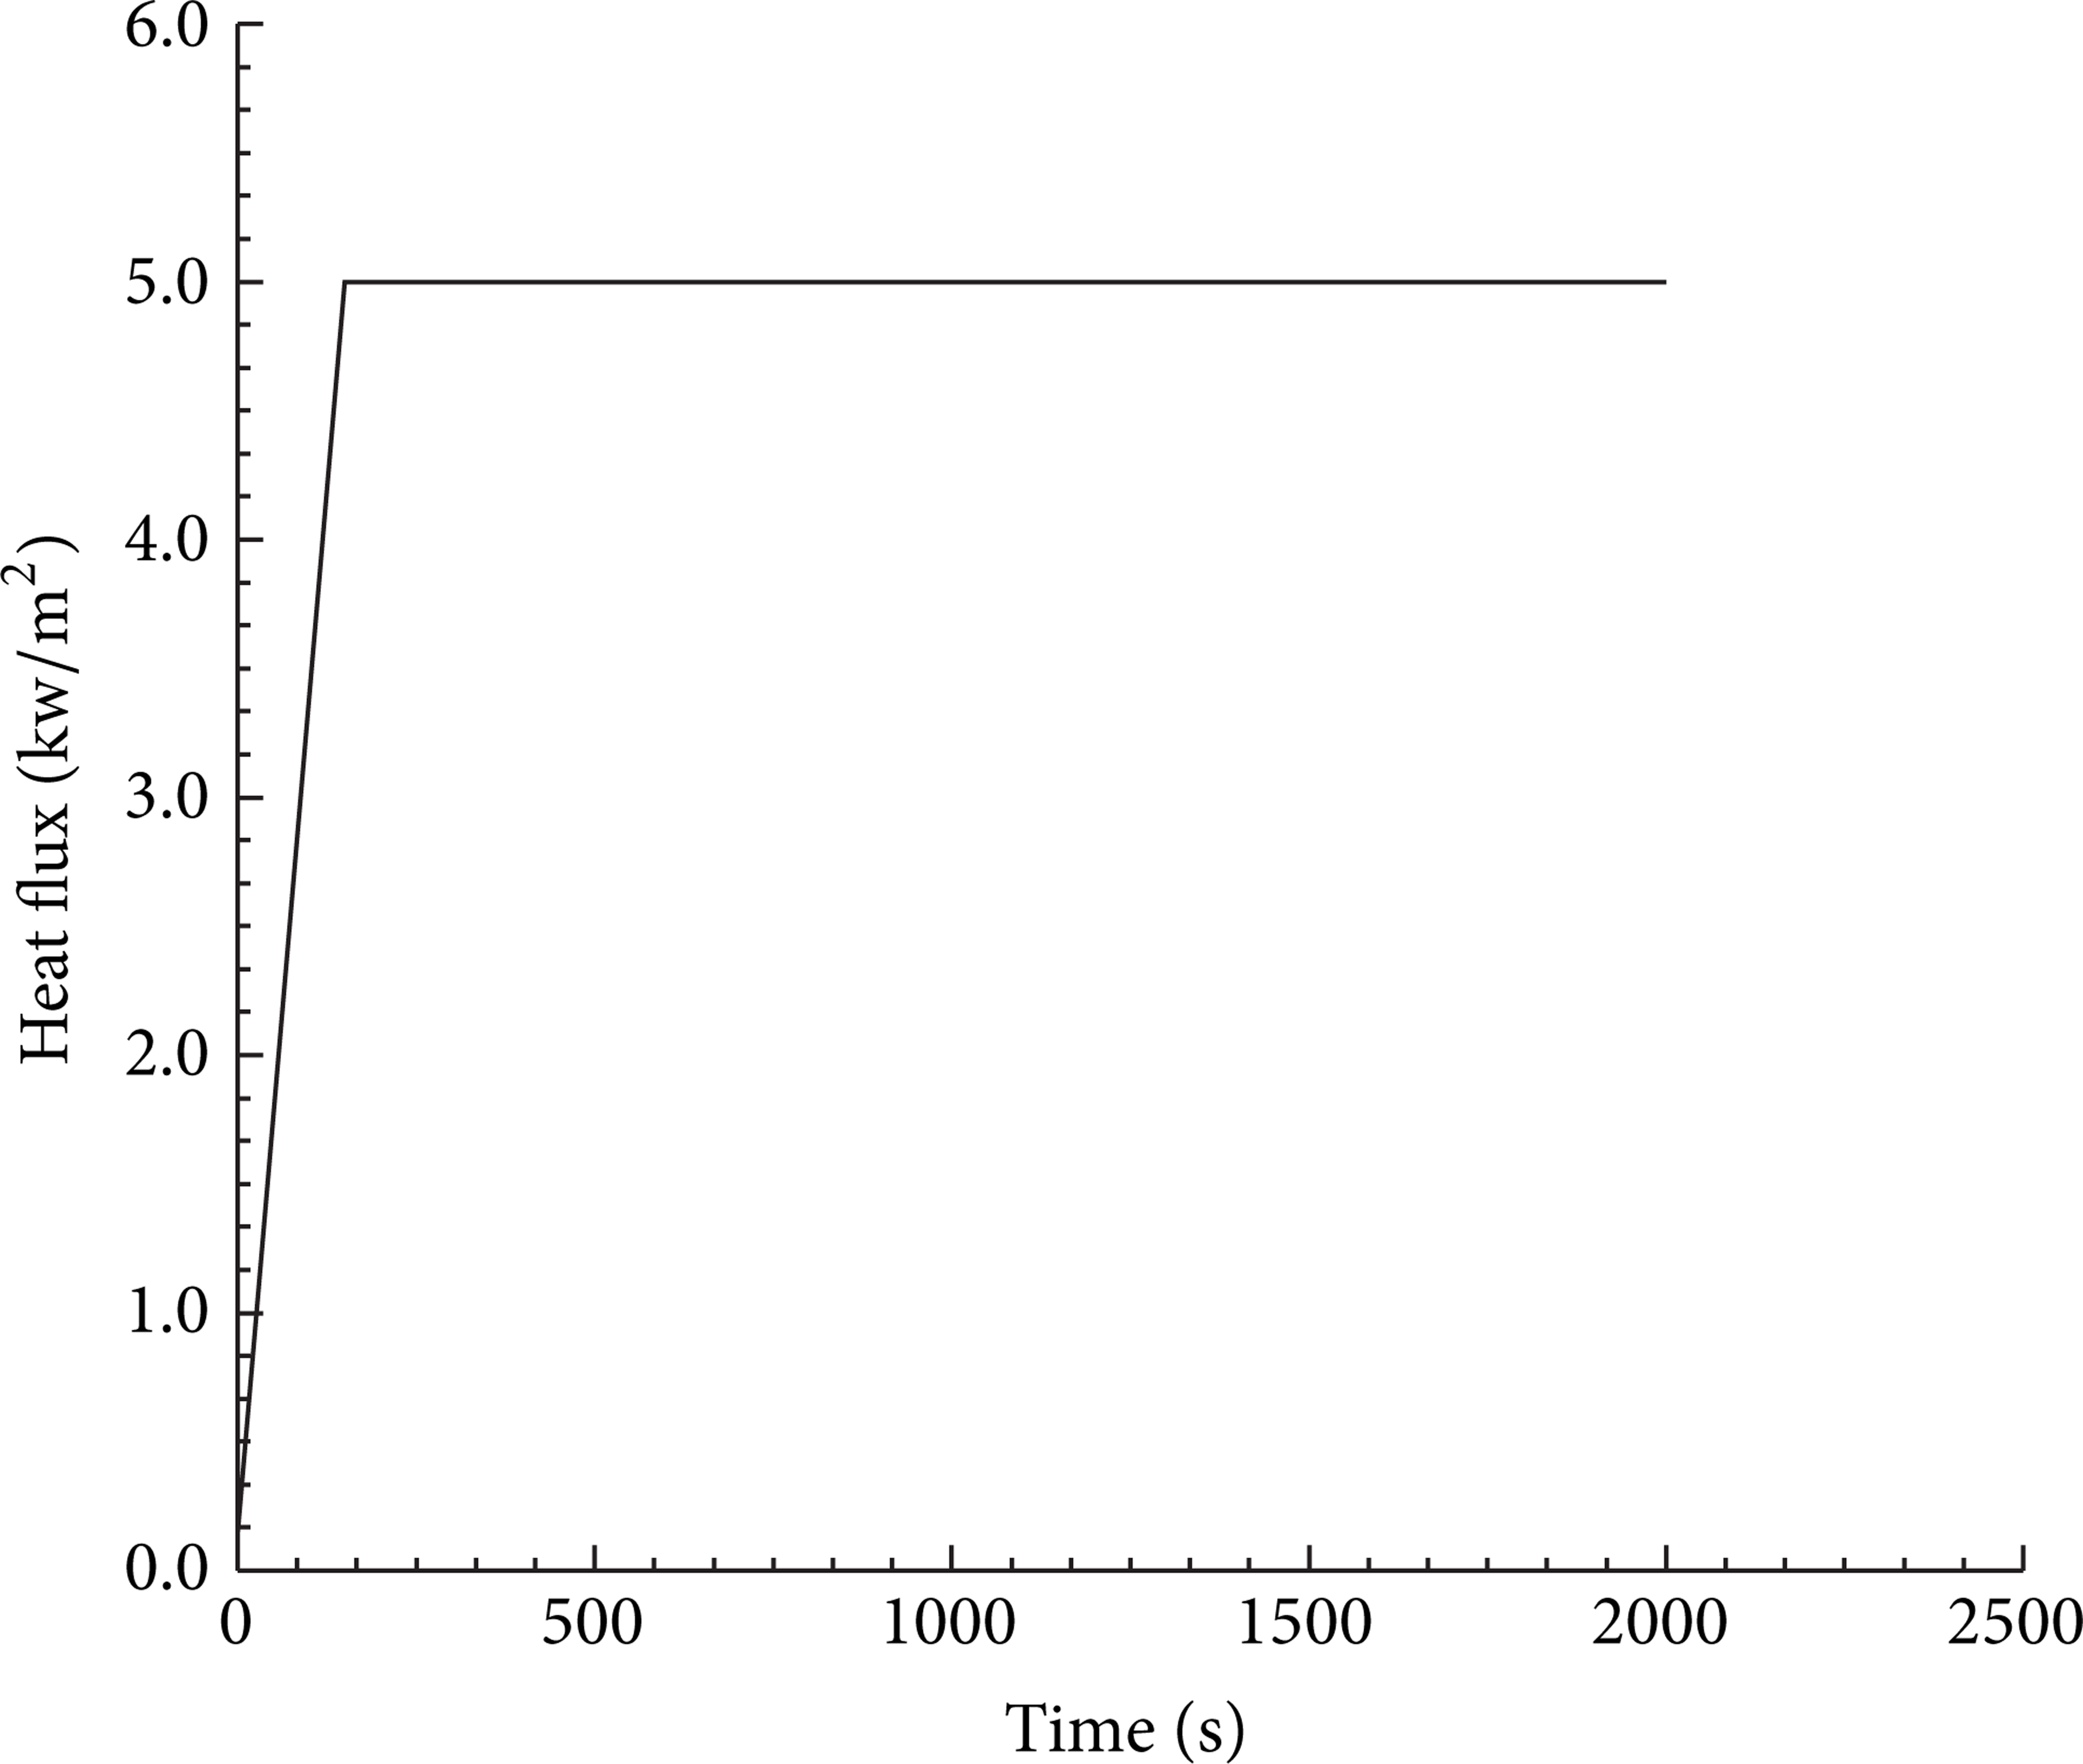
Heat flux profile in the present study.
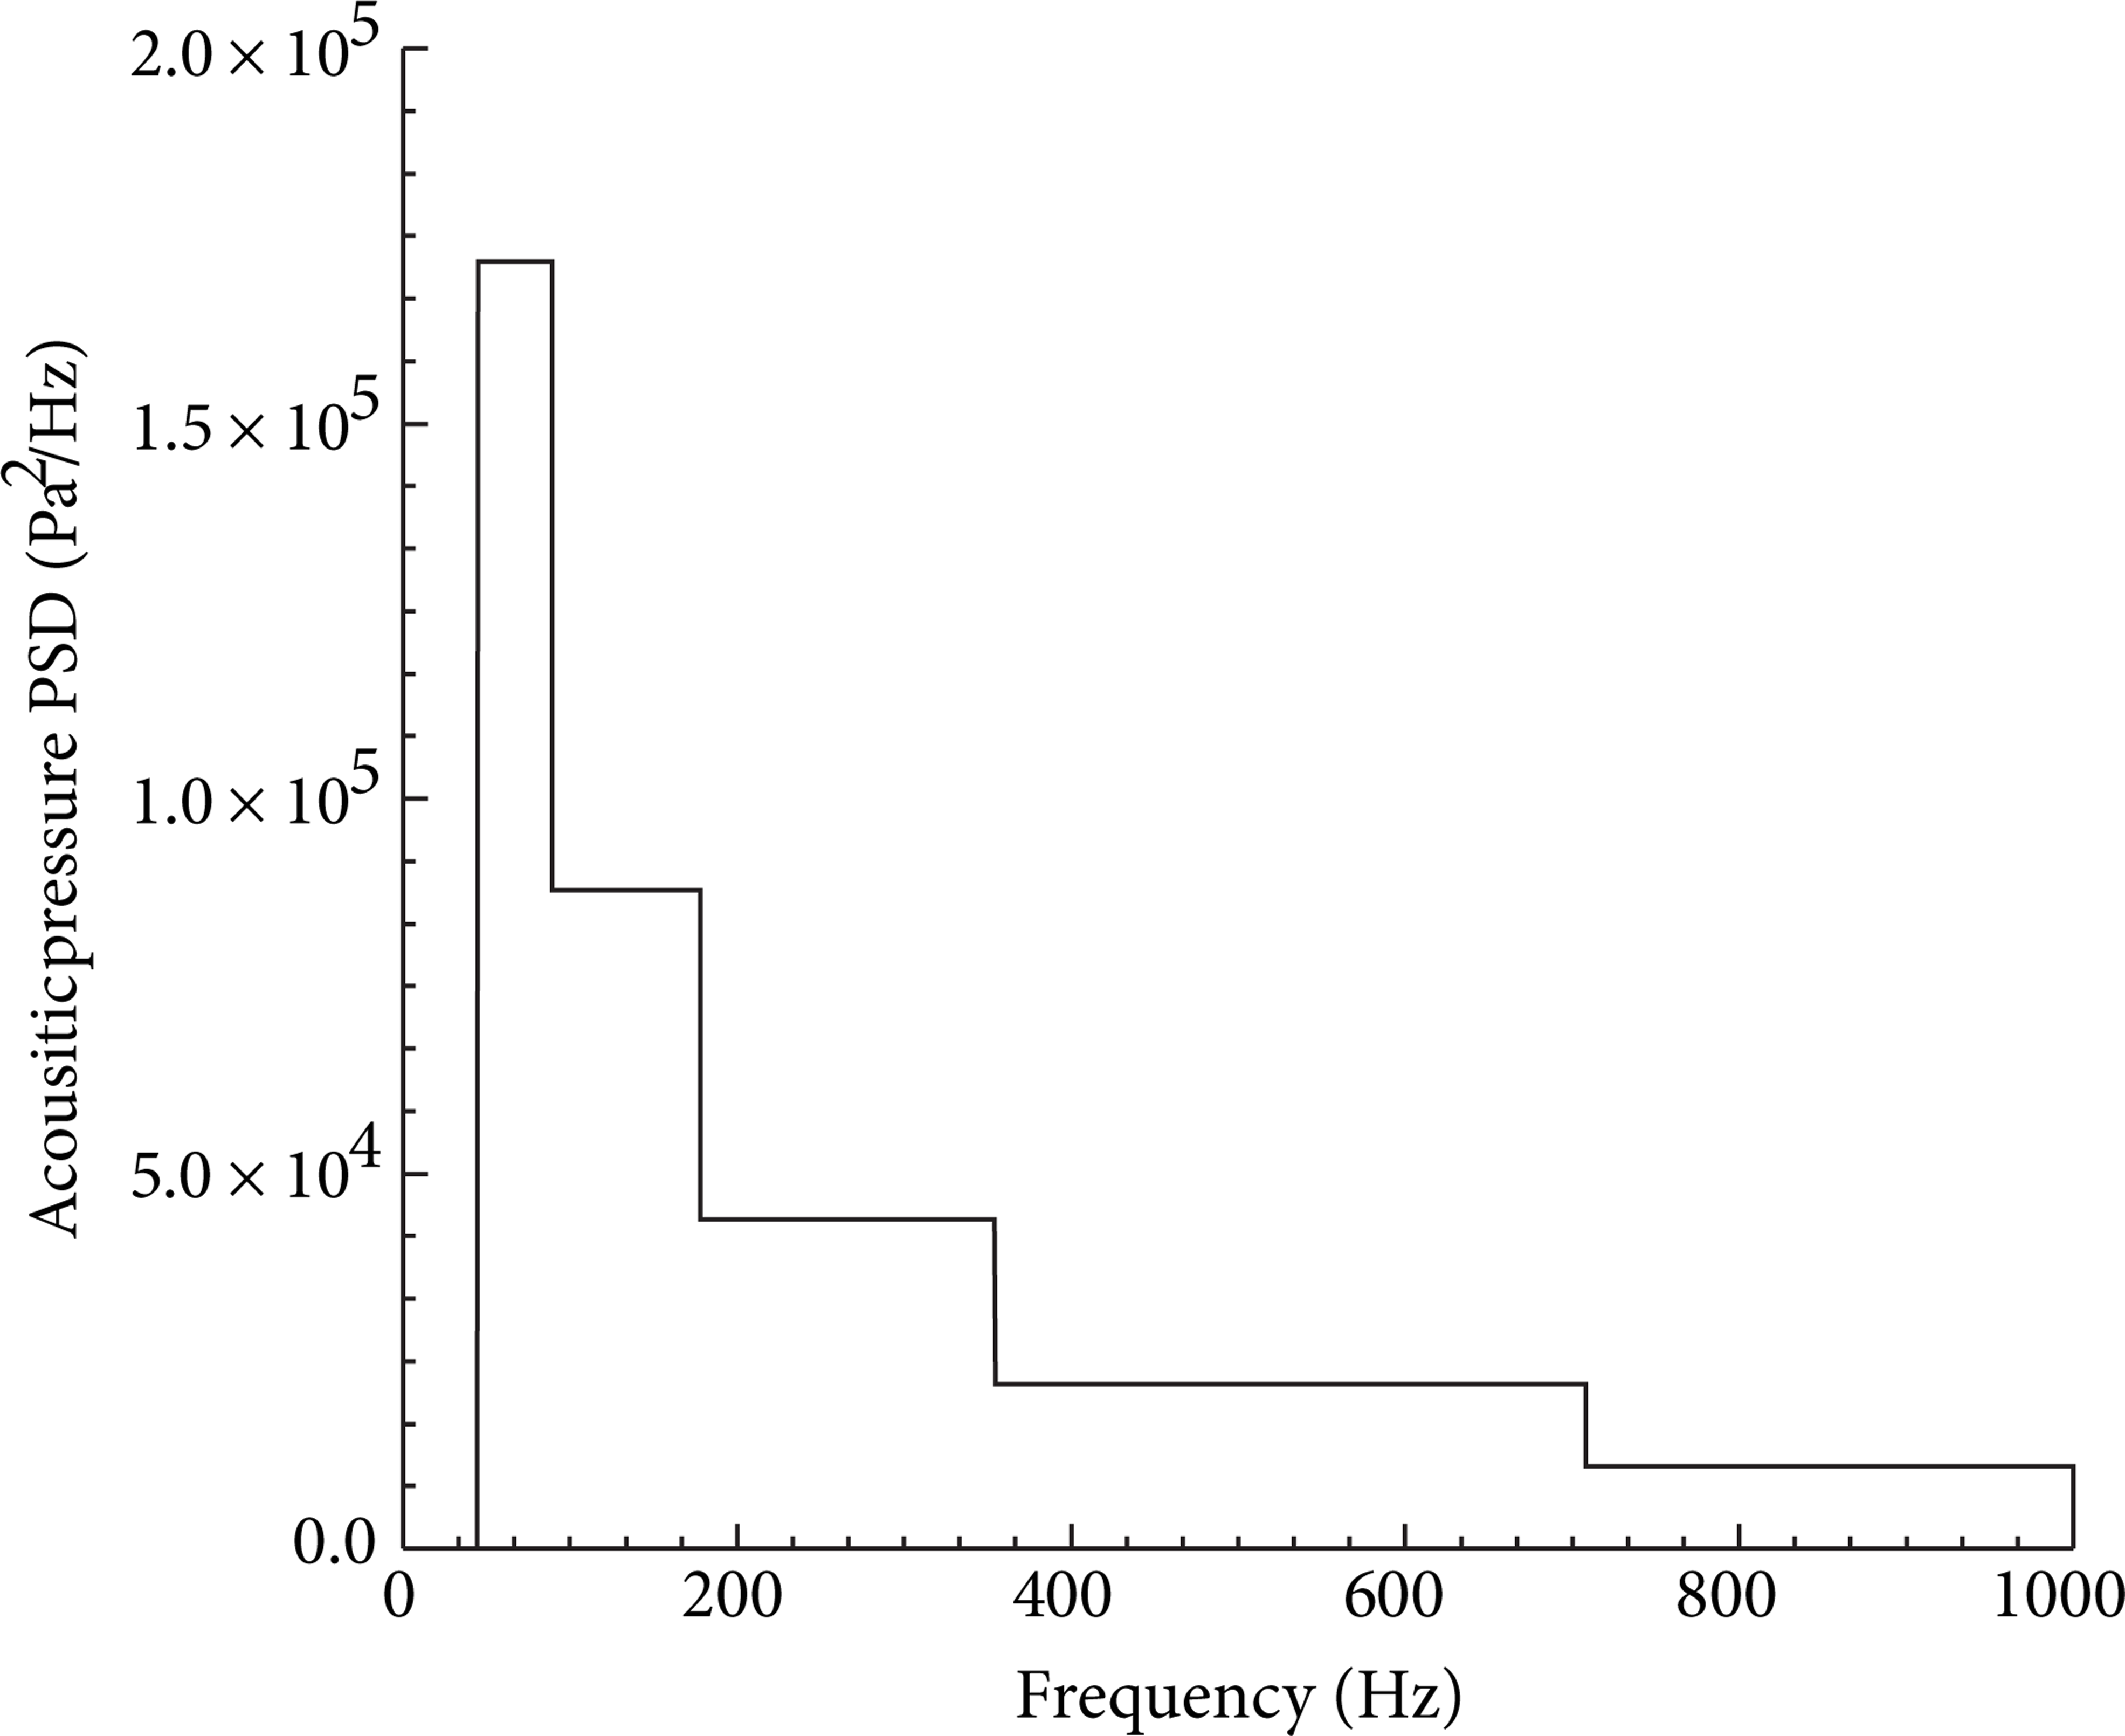
Random acoustic PSD at OASPL of 170 dB and cut-off frequency of 1000 Hz.
3.2. Solution Sequence
A block diagram of the solution procedure applicable to the TPS structure is presented in Figure 6. The preprocessing steps consist of the thermal model and structural FE model development. The preprocessing step also includes preparation of the loading definitions. The loadings are depicted in the frames.

Dynamic analysis and sonic fatigue life analysis procedure.
The core of the analysis is comprised of three consecutive steps. The first step is a thermal analysis, where the thermal model has to be constructed to provide a transient temperature distribution through the structure over the duration of the simulation. The thermal model has to account for thermal equilibrium and heat transfer between the boundary layer and the thermal structure, including the effects of radiation. Besides, the aerodynamic heat flux boundary condition has to be computed. However we simplified the thermal analysis procedure extensively in the solution sequence since the more accurate thermal analysis of the TPS structure is extremely complicated and is beyond our main objective of the current investigation. In order to simplify, the heat convention and heat radiation to the surrounding environment and the specific aerodynamic heat flux boundary condition are ignored. A simplified thermal analysis was conducted using Abaqus linear heat transfer shell and brick elements. Besides, the temperature distribution from other external analysis procedure or experiments also can be applied to the structural FE modeling as the prescribed initial condition.
The second step in the procedure is a random response analysis, where the nonuniform temperature distribution from the thermal analysis and random pressure fluctuations due to acoustic load are applied simultaneously. Following the required thermal analysis is a static nonlinear thermoelastic analysis performed, which includes thermal and/or static pressure loadings. The physical conditions involve imposing a nonuniformly distributed temperature due to heat load in the presence of the clamped boundary conditions at four edges of the bottom face-sheet and subjecting the top face-sheet to random acoustic load. It is clear that the combination of thermal loads and immovable in-plane boundaries presents the opportunity for thermoelastic instability and large thermal postbuckling deflections. Therefore three analysis types are generally needed in the random response analysis (in the blue rectangular frame in Figure 6) to determine the response of the panel-type structure to the combined loading conditions: (1) thermal buckling analysis, (2) thermal postbuckling analysis if it is necessary, and (3) dynamic analysis. The thermal buckling analysis is a linear perturbation procedure to estimate the critical (bifurcation) load of the panel-type structure under thermal loading and provide the buckling eigenvectors. Typical numerical approaches for nonlinear static solutions involving stability require some seeding of the solution by an initial deflection, which is generally constructed by weighted combinations of buckling eigenvectors, to prevent numerical ill conditioning. However no seeding of the initial deflection is necessary in this case due to the development of a thermal moment from the nonuniformly distributed temperature through thickness. Therefore the first thermal buckling analysis can be skipped in the current solution sequence.
The required thermoelastic solutions were achieved by performing a nonlinear static analysis with a nonuniform temperature distribution, which varied with the heat exposure time t. The desired equilibrium conditions were obtained thereby and the random response was determined as linear small perturbation steps at specified thermoelastic equilibrium states for different heat exposure times. The structure is restricted to be thermally steady-state and assumed that it will undergo small dynamic motions about a stable static shape (flat or thermally buckled). The linear random analysis is performed using a modal approach incorporating the first 20 modes, a critical damping ratio of 3.83%, 3.18%, 2.69%, 3.29%, 0.62%, and 1.0% for the first 6 modes, and 1.0% for the rest modes. A frequency resolution of 0.25 Hz is applied for all cases investigated. It should be noted it is a possible that the TPS structure panel may be expected to buckle and the severe acoustic excitation will then induce strongly nonlinear response features such as snap-through from one buckled configuration to another, thus the linear random response determined by the modal superposition is not valid. The nonlinear explicit dynamic analysis (shown in Figure 6) has to be performed or direct/indirect reduced-order method has to be utilized.
3.3. Sonic Fatigue Analysis
The last step is the random fatigue life prediction. The Palmgren-Miner linear cumulative damage rule [20] is typically used for variable amplitude loading and assumes that the damage, D, caused by stress cycles at one stress level can be calculated and added to damage caused by stress cycles in another stress level, or where N i is the number of cycles at stress level σ i and (N f ) i is the number of cycles to failure at stress level σ i :

where N i is the number of cycles at stress level σ i and (N f ) i is the number of cycles to failure at stress level σ i .
3.3.1. Time Domain Approach
Fatigue damage can be traditionally determined from time signals of loading, usually in the form of tress or strain. This approach is satisfactory for any stress probability density function (PDF) distribution; even stresses are not Gaussian distributed. However it requires very large and sufficiently long stress time records to obtain converged fatigue life estimates. For random response, it is convenient to recast (1) in the form
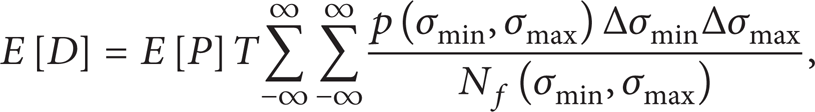
where E[P] are the number of peaks per second, T is the lifetime, p(σ min , σmax) is the joint PDF of stress minimum and maximum values, and Δσ min and Δσmax are the PDF bin widths. The dependency N f of on σ min and σmax is determined by the particular model used, such as zero-mean, Walker, and so on for the specific material. It was shown in [21] that p(σ min , σmax) can be estimated from the rainflow matrix (RFM):
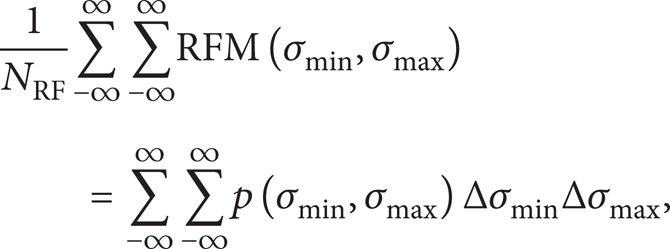
where NRF are the number of rainflow cycles per time. The RFM is a two-dimensional histogram of rainflow ranges. In this investigation, the RFM was obtained using the WAFO Matlab toolbox for analysis of random waves and loads [21]. From the linear random response analysis in the second step of the core analysis, the applied acoustic random load process is assumed to be a stationary ergodic Gaussian random process and the response of the TPS structure is obtained and defined by its power spectrum uniquely. The rainflow matrix is computed through Markov approximation and the expected damage intensity is further computed using accurate numerical approximation. Substitution of (3) into (2) with E[P] = NRF then yields

where RFD(σ min , σmax) is the two-dimensional rainflow damage matrix. Failure occurs when E[D] = 1, giving the estimated fatigue life T as

3.3.2. Spectral-Based Approaches
Alternatively, a frequency domain sonic fatigue calculation can be used where the random loading and response are categorized using power spectral density (PSD) functions and the dynamic structure is modeled as a linear transfer function. In the current investigation, the small amplitude linear vibration of the TPS structure under the combined thermal and acoustic environment has been assumed, which indicates that the TPS structure dynamic behavior is linear although it behaves nonlinearly under static thermal load. There are a variety of approaches for computing fatigue life from the PSD of stress as opposed to a time history. These methods are only applicable for PSDs describing an ergodic stationary Gaussian and random process. Bendat proposed a method of determining fatigue life from stress PSDs. Bendat's narrow band solution for the range mean histogram is therefore expressed [22]:

where N is the number of cycles of stress range Δσ occurring in T seconds. m0 is the zero moment of the area under the PSD and E[p] is the expected number of peaks obtained by

where m4 and m2 are the 4th and 2nd moments of areas of PSD, respectively, where the nth moment of area is obtained as
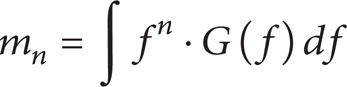
and G(f) is the value of the single sided PSD at frequency f. The issue with Bendat's narrow band solution is that it is extremely conservative. It is assumed that peaks are matched with corresponding troughs of similar magnitude in Bendat's model. However a wide band time history is characterized by smaller waves riding on low frequency carrier, hence the damage is grossly exaggerated for wide band histories.
Based on extensive computer simulations, Dirlik proposed an empirical closed form solution to the problem and this method has been found to be widely applicable and constantly outperforms all of the other available methods. The Dirlik formulation is given [23]:

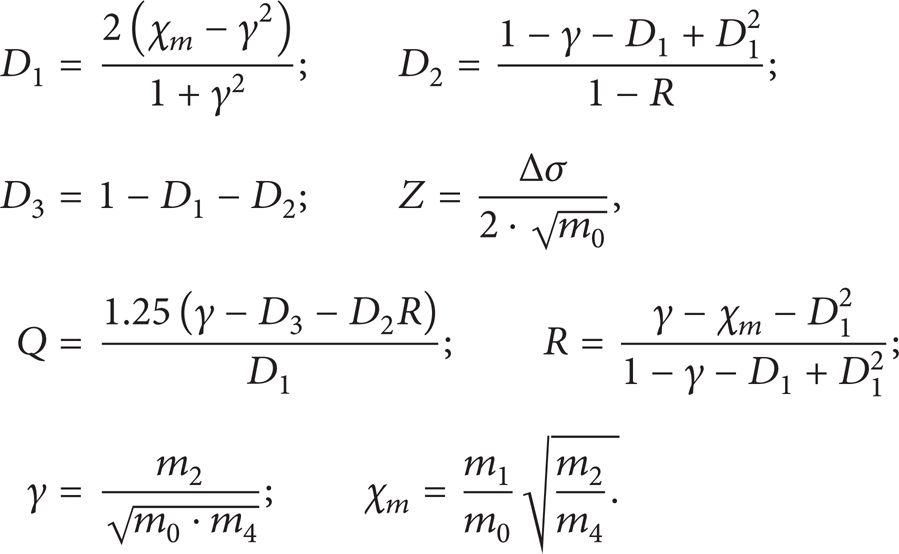
where N(Δσ) is the number of stress cycles of range Δσ expected in time T sec. E[P] is the expected number of peaks obtained by (7). p(Δσ) is the probability density function of stress range Δσ, which is given by two Rayleigh distributions and one exponential distribution:
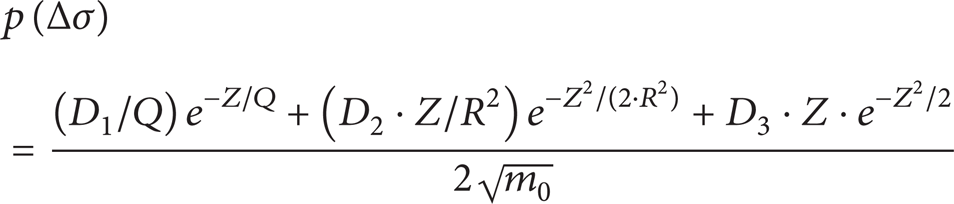
with
With the Palmgren-Miner linear cumulative damage rule, the fatigue damage per unit time, which is defined as the fatigue damage intensify, induced by the ergodic stationary Gaussian and random stress process can be determined by

and the fatigue damage in time T sec is

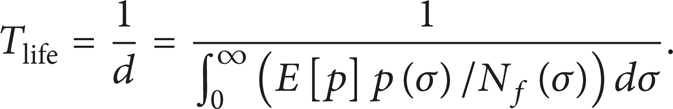
Failure occurs when D = 1, giving the estimated fatigue life T with frequency domain method as
4. Results
4.1. Validation
Before the approach and the solution procedure are applied to the panel-type complex TPS structure, FE implementation needs to be validated through comparison with fundamental cases. The linear dynamic response of the structure was determined using a modal approach under the assumption that the structure is restricted to be thermally steady-state and undergoes small dynamic motions about a stable static shape (flat or thermally buckled); therefore the structural dynamic characteristic such as frequencies and eigenvectors under thermal loading is critical for the validation and accuracy of the random response. In order to verify the FE implementation results for the dynamic characteristic of the panel-type structure at elevated temperature, comparisons will be made with known analytic solutions for the case of a prebuckled simply supported transversely isotropic composite plate at elevated temperature to benchmark the eigenanalysis, which is used as a modal basis to calculate the corresponding power spectral densities (PSD) of response variables in the further linear dynamic response analysis.
Consider a simply supported transversely isotropic composite plate with dimensions of 0.3 m × 0.3 m × 0.0025 m and subject to a uniform temperature increase ΔT. The material properties for the example case are shown in Table 1. The variation of the natural frequencies of the prebuckled plate with the uniform temperature increase ΔT and the critical buckling temperature ΔTcr can be derived analytically with constant material properties. The natural frequencies from the analytic solution are derived through stress function [24]:

where h, a, and b are plate thickness, length, and width, and ρ, α x , α y , D ij , and D ij * are the composite related material constants in the material principal coordinates. The analytical critical buckling temperature ΔTcr = 74.06°C is obtained with ω1,1 = 0. The analytical natural frequencies for the simply supported plate before buckling decrease with the uniform temperature increase ΔT until the critical temperature reaches ΔTcr. The effect of the temperature variation on the dynamic response of the panel-type structure is due to the existence of the thermal-induced membrane force, which contributes to the structural stiffness at elevated temperature. The same prebuckling plate has been analyzed with Abaqus nonlinear static solver and the comparison of the frequency between the analytical solution and the FE results is shown in Figure 7. It is demonstrated the numerical solution based on the FE implementation agrees very well with the analytical solution and the error for the critical buckling temperature is less than 0.2%. Accordingly, Abaqus static nonlinear solver, which accounts for large deformation and the contribution of the membrane load in shells to the stiffness, is used to analyze the small amplitude linear dynamic response of the panel-type structure about a thermally induced postbuckling deflection configuration. As an illustration, the fundamental natural frequency variation with the temperature increase as ΔT > ΔTcr is also shown in Figure 7. These results showed the commercial FE implementation for the linear dynamic analysis of the panel-type structure at elevated temperature and also demonstrated that the natural frequencies and the corresponding mode shapes of a prebuckling and postbuckling plate-type structure can be obtained, which is used to calculate the power spectral densities of response variables (stresses, strains, displacements, etc.) and the corresponding root mean square (RMS) values of these same variables in the random response analysis. The same conclusion has been made in [9, 10].

The natural frequency variation with temperature for a simply supported transversely isotropic composite plate.
4.2. Thermal Analysis Results
The heat transfer analysis used to obtain the temperature distribution is a common prerequisite to the model under consideration. Therefore, the simplified heat transfer results are first presented in Figure 8, where the heat convection and radiation to the environment have been ignored. Hence the present analysis only gave the temperature distribution along the structure thickness dimension. Figure 8 shows five snapshots of the through-the-structure-thickness temperature distribution of the TPS. The temperature of the TFS and the through-the-structure-thickness temperature gradient increased with the applied heat flux exposure time. With 2000 s exposure time, the temperature, exhibiting a highest temperature difference between TFS and BFS of 1050°C, was selected for all subsequent analyses involving thermal loading because this case yielded the highest thermal stress levels obviously.

Temperature distribution with various heat exposure times.
4.3. Nonlinear Thermoelastic Analysis Results
The static thermoelastic response of the TPS structure under the nonuniform temperature distribution shown by the pink curve in Figure 8 corresponds to the heat exposure time 2000 s. This distinct thermal loading scenario is considered to gain insight into the thermal effect on the TPS structure behavior since it induces highest thermal stress level. The numerical analysis results show that the maximum transverse deflection of 0.491 mm is located at the center of the aluminium bottom face and the TPS panel structure deflected toward the heat exposure. The transverse deflection result shows that the structural maximum transverse deflection is less than 2% of the structure overall thickness. This observation substantiates that the highest thermal loading introduces deformations, which are small enough to warrant a small deflection assumption for the TPS structure under the present conditions. However the nonlinear static solver has to be used in the present static thermoelastic analysis procedure to take account of the contribution of the thermally induced membrane forces in the top and bottom face sheets to the structural stiffness.
Although the maximum tensile stress and transverse displacement are both located on the aluminium BFS, which represents the substructure of the of the hypersonic vehicle, the integrity and sonic fatigue life of the TPS structure is governed by the ceramic TFS due to its low fatigue damage tolerance, and it is subjected to high intensity acoustic loading and aerodynamic pressure fluctuation directly. The tensile stress and transverse displacement fields of the ceramic TFS are given through the solution procedure, respectively. The maximum stress of 74.6 MPa is located at the center of the TFS. Although the structure is subjected the extensive thermal loading, the thermal induced stress level is low, which underestimates the thermal stress in the TPS structure. On the one hand, only the bottom face-sheet of the structure is constrained and the top face-sheet experiencing the highest temperature can be considered to expand freely during heat exposure; on the other hand, the simplified thermal analysis procedure results in uniform temperature distribution on the top face-sheet; the thermal stress induced by the nonuniform in plane temperature distribution is ignored. The variation of transverse deflection and the tensile stress with the temperature increasing at the center of the TFS are shown in Figures 9 and 10. The mechanical behavior of the TPS under the thermal load is very complex and governed by several issues including the imposing elevated temperature, the clamped boundary condition (B.C.), and the material properties; therefore the variation of the transverse displacement and tensile stress change nonmonotonically and nonlinearly. For instance, at the beginning of the heat exposure, for example, T < 882°C on the TFS, the levels of transverse deflection and the thermal tensile stress are substantially low and varied with temperature linearly, nearly. The free expansion mechanism of the TFS dominates the behavior with less thermal transverse deflection. As the temperature increases further, the remarkable transverse deflection and the thermal stress occur and vary with temperature nonmonotonically and dramatically. The variation can be fit by exponential relationship nearly. The notable critical transition of the TPS structural behavior is induced by the combination of the constrained boundary conditions along the four edges of the BFS, and the elevated temperature. With the temperature increasing further, the thermal induced moment develops and exaggerates due to the initial transverse deflection and the thermal stress, which makes the TPS structure exhibit a geometric nonlinearity.
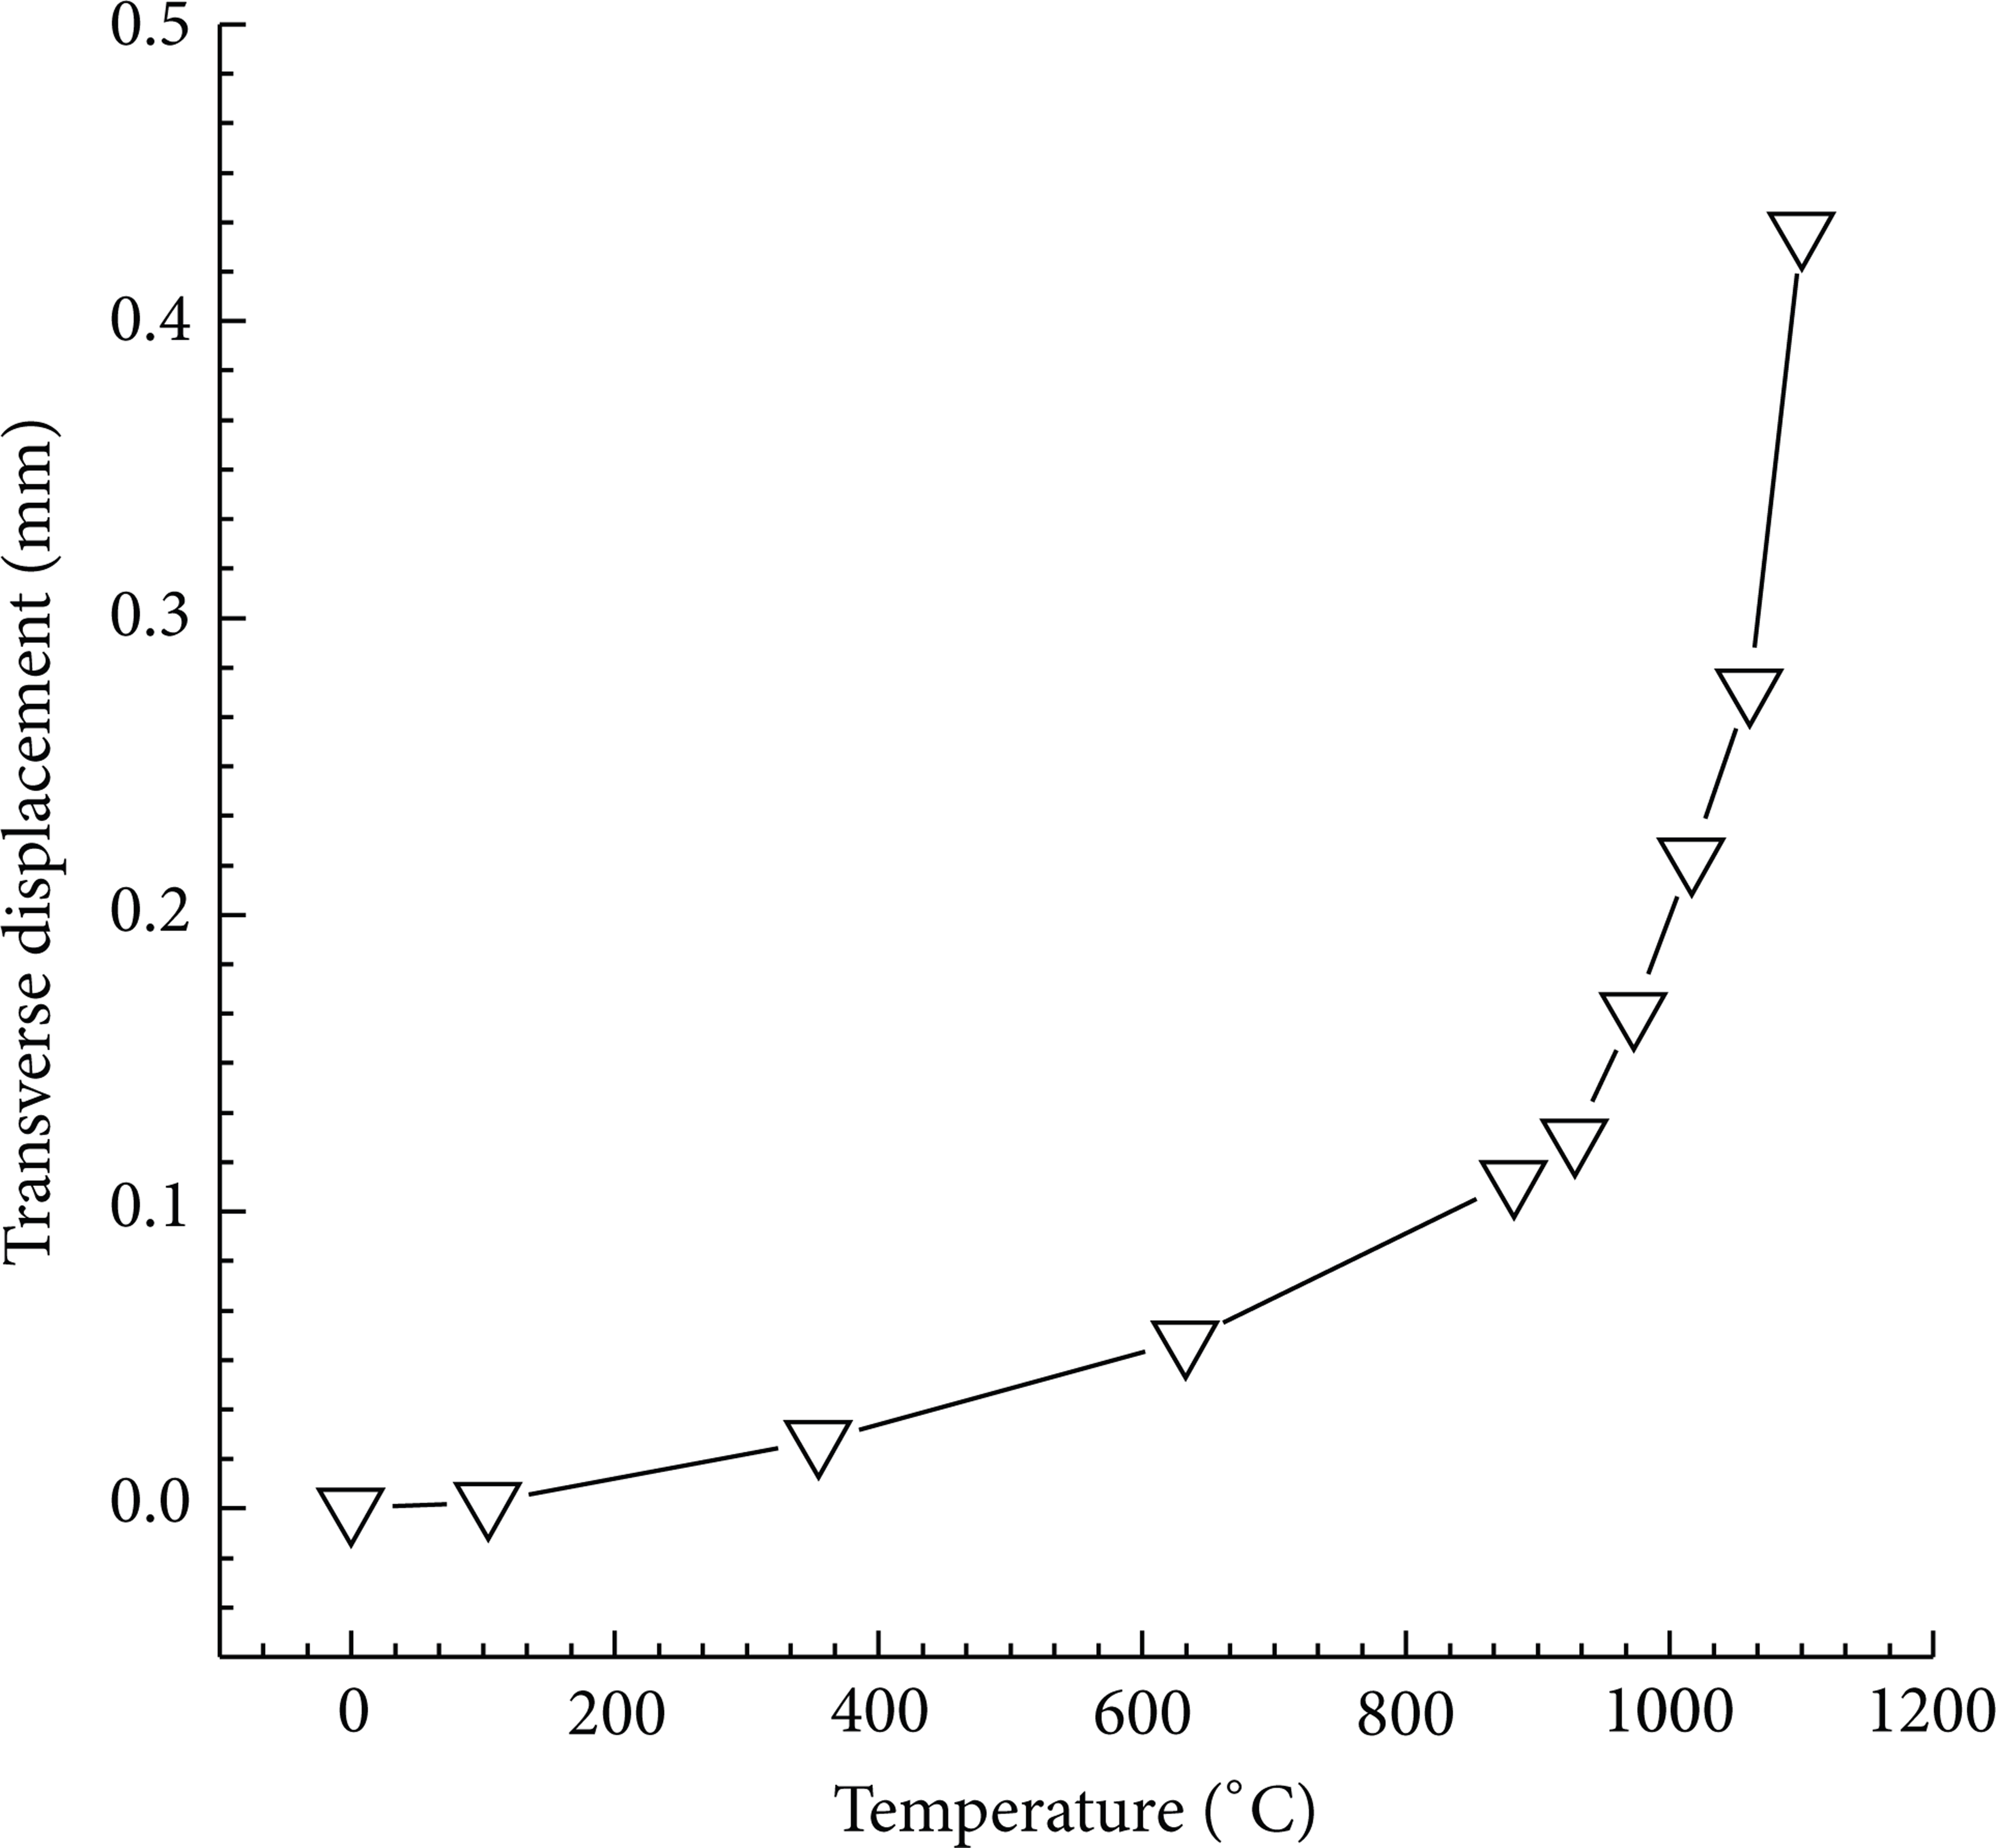
Transverse displacement variation with temperature at the center of the TFS.

Tensile stress variation with temperature at the center of the TFS.
4.4. Random Response Analysis Results
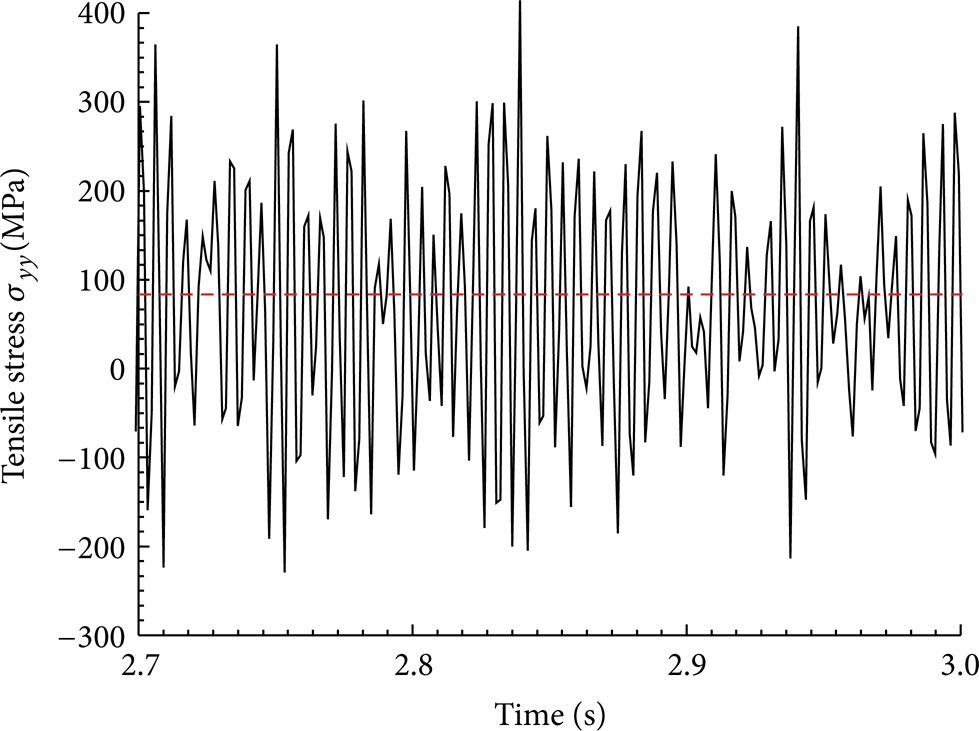
The random response is determined as a linear perturbation step at a specified thermoelastic equilibrium state, which needs the set of eigenmodes extracted from an eigenanalyses step to calculate the corresponding power spectral densities (PSD) of response variables (stresses, strains, displacements, etc.). Eigenanalyses are performed thereby following the nonlinear static thermoelastic analyses. The frequencies variation with temperature associated with the first few modes, which would be the modes most effectively excited by the acoustic loading, is presented in Figure 11 (the duplicated frequencies and modes due to the symmetric feature of the structure have not been shown). It can be seen that the thermal induced prestress results in a thermal softening effect on the TPS structure dynamic characteristics relative to the stress-free initial condition, as indicated by the reduced natural frequencies. The softening mechanism effect on lower frequencies is more significant. Linear random analysis at elevated temperature is performed further using the modal approach incorporating the first 20 extracted modes with a frequency resolution of 0.25 Hz further. It is assumed that the random excitation (OASPL 170 dB in Figure 5) only results in a small amplitude perturbation about a thermally induced deflection; hence linear random response analysis is an appropriate and effective solution procedure. In order to confirm the assumption, a full DoF explicit nonlinear dynamic response analysis under a 170 dB acoustic pressure loading combined with the nonuniform temperature variation along the thickness direction is performed for comparison. The TPS structure is assumed to be initially at rest, and the acoustic loading is applied from the beginning of the simulation, while temperature distribution is linearly ramped up from zero to the target distribution over a period of 0.5 s to minimize the thermally induced transient dynamic response. Figures 12 and 13 present the transverse displacement and tensile stress response at the TFS center node. This is the same element where the value of the static stress reaches the maximum value. The initial 0.5 s of the simulation, during which the thermal loading is linearly ramped up, is removed from Figures 12 and 13 and only the part of the response under the time-invariant temperature distribution is presented. The dashed horizontal lines in Figures 12 and 13 indicate the static displacement and stress, respectively, under the combined static thermal loading. The transverse displacement in Figure 12 is seen to oscillate around a deflection of 0.421 mm, consistent with the value from Figure 10. It is also observed that the dynamic tensile stress response oscillates around 75.0 MPa, that is, which agrees with the value obtained from the static analysis.

The frequencies variation with the temperature.

Transverse displacement response of the TFS center node under combined loading.
Tensile stress response of the TFS center node under combined loading.
To further confirm the linear small amplitude vibration assumption, the transverse displacement and tensile stress PSDs of the TFS center node obtained using linear random analysis procedure and full order physical DoFs solution obtained by a nonlinear explicit analysis, respectively, are presented in Figures 14 and 15. Fairly good agreement between these two solutions is seen across the frequency range, and the differences between resonant frequencies obtained through Abaqus explicit solver and the eigenvalues appear less than 5%. All the peaks present in the excitation bandwidth are relatively well-defined and do not exhibit significant broadening. The results validate the assumption that although the thermal loading introduces sufficiently large nonlinear deflection, the random acoustic excitation only causes a small amplitude perturbation about a large thermally induced deformation and the stress/strain PSD solutions obtained from the linear random response capture the essential characteristic.

Transverse displacement PSD of the TFS center node under the combined loading.

Tensile stress PSD of the TFS center node under the combined loading.
The tensile stress σ yy and transverse displacement root-mean-square (RMS) fields under the acoustic loading as the TFS reached 1100°C are given from the random response analysis. The results indicate that the maximum RMS of the transverse deflection and normal tensile stress are both located at the center of the TFS. The maximum RMS of the transverse deflection is 0.48 mm and less than 2% of the TPS structure thickness, which confirms that the OASPL of 170 dB acoustic excitation effectively results in a small amplitude perturbation about a thermoelastic equilibrium state.
Since the center of the TFS exhibits the highest thermal induced static stress and RMS of stress excited by the acoustic loading, its fatigue life will dictate the fatigue life of the present TPS configuration. Thus the power spectral density (PSD) of the tensile stress σ yy at the center node on the TFS with different thermoelastic equilibrium states under different heat exposure times is presented in Figure 16, which will be used for the sonic fatigue damage intensity evaluation and life prediction. Note that only response components with symmetric transverse displacements, consistent with the symmetry of the structure configuration and the loadings, are excited. The first peak of the PSD moves toward the lower frequency and the value of the peak increases significantly with the temperature due to softening effect and material properties variation. However the combined effects of the thermal load and the material properties variation on the higher frequency response are insignificant. As the indicator of the sonic fatigue amplitude, the RMS of the tensile stresses σ yy variation with the TFS temperature at the center node on the TFS is shown in Figure 17. The results showed that the combined effects of softening characteristics due to the thermally induced static loads and the material properties temperature-dependence lead to the RMS of the stress variation nonmonotonically. It decreases insignificantly with temperature as the temperature of the TFS is less than 882°C. With increasing temperature continuously, the RMS of the stress increase dramatically. The maximum RMS stress of 113.2 MPa reached as the temperature of TFS is 1100°C.

The PSD of the tensile stress σ yy at the center of the TFS.

The RMS of the tensile stress σ yy variation with the temperature.
The variations of the tensile stress RMS and the thermal tensile stress of the center node on the TFS show that as the temperature is less than 882°C in the case, the RMS stress induced by the acoustic load dominates the fatigue damage since the static stress is insignificant. As the temperature is higher than 882°C, the static thermal stress and the RMS stress both increase dramatically and dominate the damage of the TFS significantly. Accordingly, the contribution of the mean stress induced by the thermal stress and the nondeterministic stress amplitude induced by the acoustic load has to be taken into account in the following thermoacoustic fatigue damage evaluation for the material, which the fatigue damage is sensitive to the static stress as well as the fatigue stress amplitude.
4.5. Sonic Fatigue Life Prediction Analysis Results
The sonic fatigue life analysis is made at the location of the center of the ceramic TFS since it experiences the highest thermal induced static stress and the highest stress RMS. However some simplified assumptions have been made for current fatigue life estimation. (1) The material is assumed defect-free; (2) the temperature and test frequency f effects on S-N properties have not been considered in the current analysis.
For nonzero mean conditions, the stress amplitude σ a and mean stress σ m may be expressed as
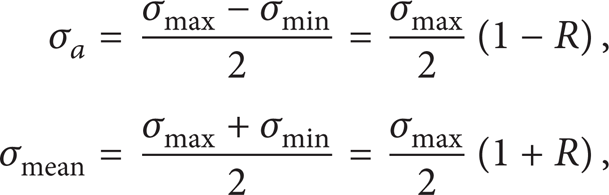
where the stress ratio R is given by

For the zero-mean condition, R = − 1 and σ a = σmax.
In order to study the effect of nonzero mean stress variation due to the nonuniform temperature distribution on the sonic fatigue damage evaluation, the archetypal two-dimensional diagram of stress ranges is shown in Figure 18. Only half of the matrix is populated because the minimum stress can never be greater than the maximum stress. Lines are drawn along constant values of the stress ratio R to give insight into the distribution of ranges. Constant amplitude conditions, when σmax − σ min = constant, are found along diagonals of positive slope. Constant mean stress ranges, when σmax + σ min = constant, are found along diagonals of negative slope.
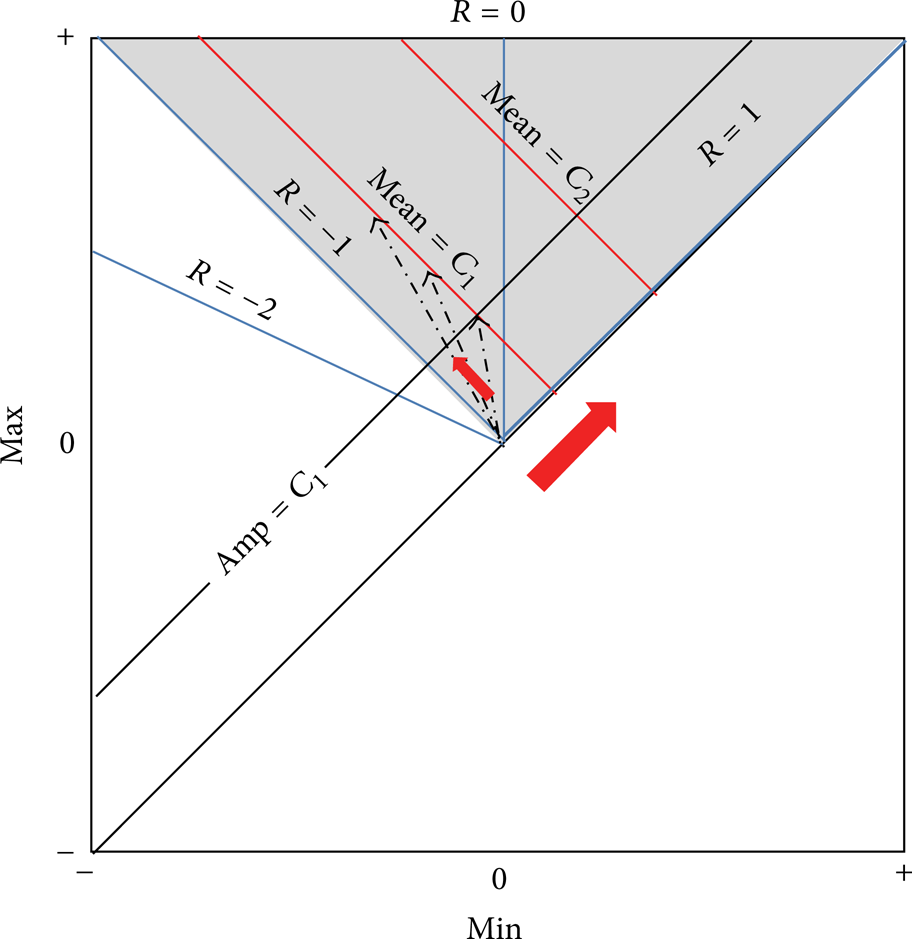
Two-dimensional stress range diagram.
For sonic fatigue analysis of the TPS structure in the combined environment, the tensile mean stress induced by the thermal stress is a deterministic positive constant and increases with the temperature variation; therefore fatigue cycles move towards the upper right as shown in Figure 18, which leads to increasing R values if the fatigue stress amplitude is constant. The sonic fatigue stress amplitude varies nonmonotonously and increases dramatically after the temperature of the TFS is higher than 882°C, as shown the normal stress RMS in Figure 17, hence more fatigue cycles move toward upper left statistically, which leads to decreasing R values if the mean stress keeps constant. Experimental results have demonstrated that, for the C/SiC ceramic composite material used in the TFS of the TPS structure, high mean stress also contributed to the damage due to creep damage mechanism in addition to fatigue stress amplitude [25–28]; therefore sonic fatigue damage variation depends on both the deterministic mean stress and nondeterministic stress amplitude in the current investigation.
It is necessary and valuable to illustrate the proposed sonic fatigue analysis step in the analysis procedures (Figure 6) viable with known S − N properties for a specific material of the TFS. In order to gain the confidence of the methodology and understand the insight of the sonic fatigue damage variation under combined thermal and acoustic loadings, stress fatigue model of the TFS is given for the constant stress ratio R = 0.1 case:

with K = 224 MPa, β = − 5.0 for the nonzero mean stress case in (18). Thermal-acoustic fatigue damage, induced by both mean stress and stress amplitude, is governed by the maximum stress variation and the damage due to variable R values is neglected in the evaluation model for simplification:

Then the damage per time unit is defined as damage intensity and given with the stress fatigue model as: where p(σ) is the probability density function of stress range dσ, which is given by the rainflow matrix in tensile stress time response or Bendat and Dirlik models.
Figures 19 and 20 provide the rainflow matrix (RFM) and the rainflow damage (RFD) at the center node of TFS for the TPS structure at ambient and maximum temperature conditions using the fatigue model (see (18)). For the 23.5°C/170 dB loading condition, the sonic fatigue cycles counts are evenly distributed about R = − 1 with zero mean stress. For the 1100°C/170 dB loading condition, the effect of thermal stress shifts the stress cycle towards increasing R zone and fatigue cycle counts are evenly distributed about a constant mean stress 74.6 MPa. Also a broader band stress time history can be characterized by the RFM in the combined loading condition and fatigue cycle counts distributed in a wider region. Since higher maximum stress is expected for the TPS structure in the combined loading, much more damage is accumulated for higher stress amplitude with higher mean stress compared with the damage at ambient temperature.

The distribution of rainflow matrix (RFM) at the center of the TFS.

The distribution of rainflow damage (RFD) at the center of the TFS.
Table 3 and Figure 21 give the evaluation of the damage variation at the center node of TFS due to nonuniform temperature distribution. Time domain approach is based on simulating a sampled stress history, extraction RFM and RFD, and estimation damage intensity [29, 30]. For each temperature snapshot, the structure is under thermal static steady-state and the acoustic excitation induces the small amplitude linear vibration about the thermoelastic equilibrium state. Since the temperature variation during the flight of hypersonic vehicle is much slower and it is reasonable to assume that, during the simulation of a sampled dynamic stress history in the time domain, the temperature distribution keeps unchanged for such a short simulation time. If the time history of the stress is taken as an “ergodic stationary Gaussian random process,” it is found that the phase is purely random between − π and + π radians. With an ergodic stationary random process, therefore, a single sampled time history of the normal stress is taken from the process, and it is assumed safely that this sampled history contains all the required statistical properties of the parent process. Accordingly the stress process σ yy (t) is simulated with approximately 105 nonnegligible cycles for the given spectrum PSD (Figure 18) as the temperature of TFS reaches 1100°C, and a sampling frequency f = 100f0 is used, which provides 107 observations for the chosen duration time T. Five sample paths of stress processes have been simulated and the damage intensity is calculated accordingly. The results in the last 5 columns of Table 3 show that the difference of the damage intensity d from 5 simulations is not more than 3% for the random process, which means the sampling frequency of the simulation is appropriate and the results from the time domain approach are stable and can give the robust damage intensity. In addition, the damage intensity is calculated based on the frequency domain fatigue analysis approach for comparison. Both Bendat and Dirlik solutions for the probability density function (PDF) of stress amplitude for the random stress process are applied to evaluate the average damage intensity in (19). Figure 21 shows the fatigue damage intensity variation with the temperature of the TFS from several fatigue analysis techniques, where the average damage intensity is given through rainflow counting in time domain.
The damage intensity at the center node of the TFS in the combined loading condition.


Damage intensity variation at the center node of TFS with temperature.
The comparison results show that the damage intensity, which is induced by the deterministic thermal mean stress and nondeterministic stress amplitude due to acoustic load, varies nonmonotonously with temperature. The trend is governed by the combination of the thermal stress and the RMS stress variation in Figures 10 and 17, respectively. As the temperature of TFS is less than 882°C for the current TPS structure, the damage intensity is insignificant and varies slowly since the deterministic mean stress and the RMS of normal stress are both small, and once the temperature is higher than 882°C, the damage intensity increases with temperature dramatically, which agrees with the trends of the mean stress and RMS of normal stress. The overall trend of the thermal-acoustic fatigue damage density can be predicted through the static thermoelastic analysis and linear random analysis solutions, but the specific values of the fatigue damage density and the life are determined by the fatigue stress model (see (18) in the present case) and the damage cumulative law, which are material-related strongly. The result of the thermal-acoustic fatigue damage intensity variation with TFS temperature in Figure 21 demonstrates that both static stress induced by the thermal load and the nondeterministic stress amplitude induced by the acoustic load dominate the fatigue damage intensity and the integrity of the TPS structure. The temperature distribution is a very important issue to govern the fatigue damage of the TPS system since it controls the static thermoelastic behavior, material property degradation, and dynamic response. A critical transition temperature might occur and be determined under the combined effects of the TPS configuration and thermal and acoustic load in the design stage of the TPS system.
The total damage, D, induced by the thermal-acoustic loading history can be given through the numerical integration of the damage intensity on Figure 21 over the heat exposure time and the total life is the reciprocal of the total damage (Equations (4) and (5)). As an illustrative fatigue life methodology, the specific value of the thermal-acoustic fatigue life in the current case does not provide insight of the effects of the heat flux or acoustic load on the fatigue life of the complex TPS system and is not given.
The comparison among three sonic fatigue analysis techniques demonstrates that, as the temperature is less than 882°C, the stress time history exhibits a typical narrow band feature (also shown from Figure 19) and the solutions from three fatigue analysis techniques give a good agreement and Bendat solution provides the most conservative damage intensity results. As the temperature is higher than 882°C with a much broader band stress time history, Dirlik approach is remarkably robust, compared with the results from the time domain approach. However the Dirlik solution always gives lower damage intensity and less conservative fatigue life and the discrepancy between the Dirlik solution and the time domain approach also increases with the temperature and reaches 12.3%. Accordingly, it is suggested that a correction to the Dirlik solution model of the stress PDF is necessary for the life prediction and will give more conservative results for the TPS structure in the combined thermal and acoustic loading. The rainflow cycle counting procedure based on the stress time history simulation should give a conservative life prediction of the TPS structure in the combined thermal and acoustic loading.
5. Concluding Remarks
An analysis procedure to investigate the response of a complex TPS structure under a combined thermal and acoustic loading is presented and the thermal-acoustic fatigue damage intensity is estimated by two fatigue analysis techniques. The core of the procedure consists of a heat transfer problem followed by a linear random response analysis and a sonic fatigue analysis. All static and dynamic response analyses can be carried out using the FE commercial code Abaqus. With the linear random response known, which is given by the stress PSD, the damage intensity due to the combined loading at each specific loading scenario and the total damage accumulated during the total loading history can be estimated based on linear damage accumulation assumption. The analysis procedure provided is very general and can be used to others complex structures under combined deterministic and nondeterministic loading for random fatigue damage evaluation as long as the dynamic response is linear. The method also indicates that the thermal induced membrane force and immovable in-plane boundaries give the opportunity for thermoelastic instability and thermal postbuckling deflections of the panel-type structure; therefore the nonlinear static analysis is necessary to take into account the membrane force contribution to the stiffness of the structure although the static deflection is small.
The novelty of the work includes that it is the first attempt to understand the dynamic characteristic such as frequencies, nondeterministic displacement, stress, and the sonic fatigue intensity variation induced by the combined loading with nonuniform temperature distribution for a typical multilayer TPS structure; the material properties variation with temperature and nonlinear static thermoelasticity analysis has been taken into account in the procedure with the linear dynamic response assumption; secondly, it is the first attempt to estimate the sonic fatigue intensity through two different random fatigue analysis techniques in the time domain and the frequency domain, respectively. The comparison result is provided accordingly. Finally, it is proposed to apply the maximum stress fatigue model to evaluate the sonic fatigue intensity to consider to deterministic mean stress contribution to the damage, although the damage intensity could be overestimated because of low constant stress ratio assumption.
The limitations of the given method include that the random response is determined under the linear dynamic response assumption, hence for very thin panel under the combined loading condition with immovable in-plane boundaries, nonlinear dynamic response induced by the large deflection snap-through postbuckling behavior between two thermal equilibrium states can occur, which also cause serious sonic fatigue damage at elevated temperature. The given method is not appropriate and the nonlinear explicit dynamic analysis (in Figure 6) or the reduced order method has to be used. However the thickness of the multilayer TPS structure and the thermal moment development due to the nonuniform temperature distribution assure the linear dynamic response, for which the given method based on the modal approach is very efficient to solve this practical issue. In addition, the frequency of the acoustic noise is higher than 1500 Hz; the given method using the modal approach is very inefficient due to the compact modals at high frequency; therefore statistical energy analysis of the random response could be one option to solve the issue, but statistical energy analysis is not the best choice for the sonic fatigue estimation since it cannot provide the response at the specific location of the structure.
The typical multilayer TPS structure is studied using the proposed procedure. It shows that the contribution of the applied thermal loading to the thermally induced stresses for the TFS of the structure is insignificant due to free expansion mechanism as the temperature of the TFS is less than 882°C, which can be determined as a critical transition temperature. With further increasing temperature, the dramatic increasing of the deformation and stress occurs because of the aggravation of the thermal moment. The thermal stresses result in a softening of the TPS structure, as indicated by lower fundamental frequencies relative to the initial thermal stress-free condition. Random acoustic excitation results in relatively small oscillations about the thermally deflected configuration, which substantiates applicability of the linear random response in the following analysis procedure. The combined effects of softening characteristics due to the thermally induced static loads and the material properties temperature-dependence lead to the nonmonotonic RMS stress variation induced by the acoustic load. As the temperature is higher than the transition temperature, the static thermal stress and the RMS stress both increase dramatically and dominate the damage of the TFS significantly. The contribution of the static mean stress and the nondeterministic stress amplitude induced by the acoustic load has to be taken into account in the thermoacoustic fatigue damage evaluation.
The variation of the damage intensity showed significant nonmonotonic behavior with the temperature due to the variation of the static thermal stress, structural dynamic characteristic, and material properties at elevated temperature. The effects of both thermally induced deterministic mean stress and nondeterministic dynamic stress history due to the acoustic loading have been considered in the damage intensity estimation with maximum stress fatigue model. The stress time process characteristic shifts from a narrow band to a broad band due to the nonuniform temperature variation, which leads to that Bendat's narrow band solution gives much more conservative fatigue intensity estimation with temperature increasing. The rainflow cycle counting procedure based on the fatigue analysis in time domain is suggested to estimate the fatigue damage intensity for the TPS structure under an extremely combined loading environment since Dirlik's solution always underestimates the damage intensity and the underestimation is increased with the temperature.
Conflict of Interests
The authors declare that there is no conflict of interests regarding the publication of this paper.
Footnotes
Acknowledgments
Dr. Liu Liu was supported by the National Natural Science Foundation of China under Grant no. 11002020 and the Program for New Century Excellent Talents at Chinese Universities and Southeast University, Jiangsu Key Laboratory of Engineering Mechanics.