
Abstract
Both experimental and numerical studies are simultaneously performed for fully developed water and surfactant solution channel flow. The comparison aims at the surfactant solution flow in experiment with mass concentration of 25 ppm at Re = 1000 and Giesekus model with Weissenberg numbers of 10 and 40 at Reτ = 150. Big differences are found between the experimental and DNS results by comparing the distributions of velocity fluctuations, Reynolds shear stress, and so on. Although large drag reduction appears in DNS, Giesekus model has some limitations in describing the fluid characteristics and viscoelasticity of the surfactant solution.
1. Introduction
If a small amount of polymer or surfactant is added into the turbulent water flow, the friction of the fluid will decrease to a large degree, which is named “Toms effect” [1]. The ultimate drag reduction of 80% was found in the very dilute aqueous solution of cetyltrimethylammonium chloride (CTAC) at the small mass concentration of 30 ppm [2, 3].
During some past decades, a lot of studies were performed by experiments and simulations in order to clarify the mechanism of drag reduction. Gyr and Tsinober once concluded that the small scale part of time and space was suppressed in the drag reducing flow, and the fluctuations of streamwise velocity remained approximately at the same level of the water flow; however the transverse component was strongly reduced [4]. Kawaguchi et al. investigated the surfactant solution channel flow by PIV and found that the turbulent characteristics were changed and dependent on the Reynolds number [5, 6]. Especially, Li et al. found the phenomenon of the decreasing inclination angle of the low-momentum and the reduction of turbulent burst frequency [7, 8]. Turbulence transport in surfactant channel flow was investigated by Gu et al., and the phenomenon of zero Reynolds shear stress found in experiments was explained by quadrants analysis [9, 10].
Direct numerical simulation (DNS) was also used to quantitatively analyze the turbulence transport mechanism in drag reducing flow. The extensional viscosity models [11] and viscoelastic models such as finitely extensible nonlinear elastic-Peterlin (FENE-P) and Giesekus [12] have been used in DNS. In order to perform simulations with a high-resolution scheme, the second-order accurate MINMOD scheme was used for the DNS study when Giesekus model is used. The high drag reduction rate was obtained in the simulation for the channel fluids, and a lot of turbulence characteristics were observed by DNS in a similar way to the finding in experiments. Weissenberg number was one important parameter in describing the viscoelasticity of Giesekus model, and its effect on the flow structure was studied by Yu and Kawaguchi [13]. Although the increase of Weissenberg number would enhance the drag reduction, the validity of the parameter in describing the whole property of surfactant solution should be proved by the experimental results because of its difficult rheology. Then, DNSs and experiments were performed simultaneously for the fully developed turbulence flow in a channel by Yu et al. [14]. They studied the alteration of the energy redistribution by surfactant additives and found numerical results were in qualitative agreement with the experimental data. However, some difference also appeared in the paper if the DNS and experimental results were compared.
As we know, surfactant additives added into the water would form the cross-linked micellar networks under a proper shear stress [15] which will play the role in altering the turbulent structures. This process or the rheology is usually difficult to be described absolutely by one simple model. It is necessary to compare the simulation with the experimental data and improve the model. In this study, both experimental and numerical studies are also simultaneously performed for the turbulent channel flow in order to find and reveal the difference of the turbulence characteristics between experiments and DNSs using Giesekus model.
2. Experimental Facility
Drag reducing fluids in two-dimensional rectangle channel are investigated by particle image velocimetry (PIV) where the experimental facility is shown in Figure 1. The fluid is circulated in a closed-circuit water loop mainly containing a channel, water tank, an electromagnetic flow meter, and one pump controlled by the frequency converters. The channel is made of transparent acrylic resin with 0.04 m in width and 0.5 m in height. The PIV testing location is positioned in the horizontal plan at the vertical centre of the channel and 6 m downstream from the entrance. The fluid flux is tested by an electromagnetic flowmeter installed upstream of the channel with uncertainty of ± 0.01 m3/min. The wall shear stress is estimated from the static pressure gradient between two pressure tabs located on the vertical side-wall of the channel and with 1.5 m distance. The surrounding temperature is 25°C during the experiments.

Schematic diagram of experimental facility.
PIV consists of a pair of Nd-YAG lasers, laser sheet optics, CCD camera, timing circuit, image-sampling computer, and so on. The CCD camera has a resolution of 2048 × 2048 pixels. The tracers seeded in the flow are white water-based synthetic resins coatings with a diameter less than 1 μm. The two-dimensional vector frame is generated by one image pair which covers the full width of the channel with about 58 mm and 42 mm in x (streamwise) and y (wall-normal) directions.
The surfactant additive is cetyltrimethylammonium chloride (CTAC). And sodium salicylate (NaSal) is also added to the solution with the same mass concentration of CTAC for providing counterions. The mass concentration of CTAC is selected of 25 ppm in this study.
3. DNS Procedure
In order to compare the behavior of Giesekus model in simulation with the experimental characteristics of the fluids, direct numerical simulation (DNS) is carried out aiming at the similar geometric model shown in Figure 2. The dimensions of the computational domain are 10h × 2h × 5h in x, y, and z directions, where h is the half width of the channel. The periodic boundary conditions are imposed for both the streamwise (x) and spanwise (z) directions, while a nonslip wall condition is adopted in wall-normal (y) direction.

The geometric model in DNS.
The nondimensional governing equations are shown as follows:
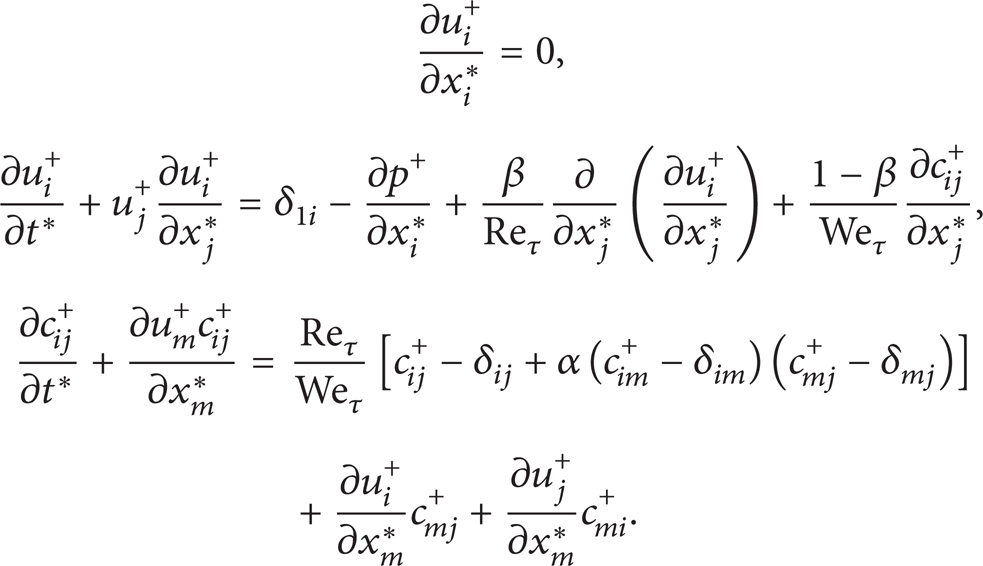
The above-mentioned constitutive equation is Giesekus model, one type of viscoelastic model, in order to calculate the extra stress due to the surfactant additives. In the equations, u is velocity, t is time, p is pressure, c is the conformation tensor, and α is the mobility factor. The Reynolds number and Weissenberg number are defined as Reτ = ρuτh/(μ + η) and Weτ = λρuτ2/(μ + η), where ρ, uτ, h are the fluid density, friction velocity, half width of the channel; μ, η are solvent and additive contributions to the zero-shear rate solution viscosity; and β = μ/(μ + η) is the ratio between the two viscosities. The superscript of “+” represents the normalization by ρ, uτ, h, and “*” represents the normalization by h.
As introduced by Yu and Kawaguchi in [12], the mesh of 64 × 64 × 64 grid points was proved enough to sustain the turbulence; consequently the same grid system is adopted in this paper which contains uniform grids used in the streamwise, spanwise directions, and the same nonuniform grids in the wall-normal direction. In addition, MINMOD scheme is adopted in discretizing the convective term in the constitutive equation. At the same time, in order to avoid a zigzag pressure field, staggered grids were employed in which pressure and conformation components are stored at the cell center while velocity components are located at the cell borders. Moreover multigrid method is also applied to speed up the iterative convergence.
In this simulation, the nondimensional Reynolds number (Reτ) is chosen as 150. Two Weissenberg numbers are chosen as 10 and 40. The viscosity ratio (β) is 0.8 and the mobility factor (α) is 0.001.
4. Results and Discussion
In order to save the simulation time, the grids number is limited in this paper, so the Reynolds number can not be very big in DNS. As shown in Table 1, Reτ is chosen to be 150 in DNS which is similar to the selection in [12, 16]. According to the relationship of Re = 2ReτU+, the mean Reynolds number of Re will be smaller than 10000 in all cases of DNS. At the same time, Re will not be less than 10000 in present experimental facility, which indicates that the Reynolds number in experiments is a little larger than that in DNS. However, it is necessary to emphasize that the average Reynolds number is calculated by Re = 2ρUh/μ, where the viscosity contributed by additives, η, is ignored because it is difficult to be determined for its variable distribution versus the shear rate in the wall-normal direction within the channel. Especially, η is associated with the concentration of additives and will be several times larger than μ at the location with zero-shear rate. Then the real Re will be small and close to the average Reynolds number in DNS. In this study, Re is chosen to be 10000 and the surfactant mass concentration is 25 ppm in experiments, whose drag reduction is similar when Weτ is 40 and Reτ is 150 in DNS. The drag reduction ratio is defined as DR = (f w − f C )/f w × 100%, where f w and f C are the friction confections in water and drag reducing fluids, respectively. In addition, the fluids with small drag reduction are also studied for the comparison such as the case of Exp_CRe1 and DNS_We = 10 when DR is about 11% in experiment and 5% in DNS, respectively.
The setup and corresponding U+ and DR in experiments and DNS.

The statistical calculation is performed by 500 two-dimensional frames of velocity vectors in experiments and 100 three-dimensional velocity fields in DNS.
Figure 3 shows the profiles of U+ distributed in different positions in wall-normal direction. Two log low equations, U+ = 2.5lny+ + 5.0 and U+ = 11.7lny+ − 17.0, where y+ = yρuτ/(μ + η), are contained in the figure which gives the relationship between U+ and y+ in the turbulent channel flow for Newtonian fluid and the polymeric solution fluid with ultimate drag reduction suggested by Virk et al. in 1970 [17].

The profiles of nondimensional mean streamwise velocity (U+) distributed versus y+.
In Figure 3, U+ of water in both experiment and DNS is distributed well with the log low equation for Newtonian turbulent flow. And the profiles of the DNS results at Weτ = 10 and experimental results at Re = 35000 are also distributed near this line because of the low drag reduction. When DR reaches more than 50% for DNS results at Weτ = 40, the profile is near the Virk's ultimate log law line. Meanwhile the velocities in experiment at Re = 10000 are distributed below but parallel to the log law line.
Root mean square (RMS) of velocity fluctuations is defined as

The profiles of RMS of velocity fluctuations distributed versus y*.
For the wall-normal component as shown in Figure 4(b), both of RMS profiles in experiment and DNS with high DR are distributed below the profiles of water, but their distributions are different when y* increases. If the fluid is in the high drag reduction state, RMS-v+ is small in the whole channel in experiment, while RMS-v+ in DNS increases and becomes near the water at last when y* increases. At the same time, when DR degradation happens such as the cases of Re = 35000 in experiment, RMS-v+ becomes large in the area near the wall but keeps the same low level in the channel center, while the profile in DNS is simply near the profile of water during DR degradation.
In turbulent channel flow, the cross-correlation between u+ and v+ is regarded as the Reynolds shear stress. Figure 5 shows the notable difference between DNS and experiments is that the Reynolds shear stress is almost zero in the whole width of the channel when high DR appears in experiment at Re = 10000, but this phenomenon will not appear in DNS. Even when Weissenberg number is 40 in DNS, DR is very large, but the Reynolds shear stress is distributed almost near the water case.

The profiles of Reynolds shear stress distributed versus y*.
As we know, the structures formed by additives will damp turbulence burst and transportation, and the suppression to turbulence will lead to the drag reduction and the decrease of friction velocity. In this case, wall-normal velocity fluctuations are reduced; both of streamwise velocity and fluctuations become large under the same pressure drop. Comparing the results between DNS and experiment, the distributions of Reynolds shear stress and RMS-v+ are quite different. Firstly, Reynolds shear stress reaches zero in experiments but is distributed near Newtonian fluid level in DNS. Secondly, although wall-normal velocity fluctuations decrease while DR increases, the fluctuations in DNS will be gradually restored to the Newtonian fluid level when y* increases.
In order to understand turbulence transportation, fluid motions are classified into four quadrants according to the plus or minus of two velocity fluctuations, u+ and v+, which were introduced by Gu in [18] as follows: u > 0 and v > 0 in quadrant 1 (Q1), u < 0 and v > 0 in quadrant 2 (Q2), u < 0 and v < 0 in quadrant 3 (Q3), and u > 0 and v < 0 in quadrant 4 (Q4) [18]. According to this categorization, the turbulent burst accompanying jump motion is categorized into Q2 and sweep motion into Q4.
Figure 6 shows the distributions of Reynolds shear stress contributed by the fluctuations categorized in each quadrant. Figures 6(a) and 6(b) indicate that the fluctuations in Newtonian fluids are mainly distributed in Q2 and Q4 because the fluctuations produced by turbulent events are usually categorized into the two quadrants. If DR becomes large as shown in Figures 6(e) and 6(f), the fluctuations are also distributed in Q2 and Q4 in DNS, but the distribution in experiment is changed to the symmetric distribution which leads to the total Reynolds shear stress reaching the value of zero.

The distributions of Reynolds shear stress which are categorized in four quadrants.
Because the deformation rate will cause the elastic tension damping the fluctuations and store energy in Giesekus model, the reduction of wall-normal velocity fluctuations of DNS only happens in the areas near the wall where the shear rate is high. However, when the deformation is small in the center region of the channel, the fluctuations increase again and reach the Newtonian fluid level. It is indicated by DNS that the flow near the wall exhibits the drag reducing state, but it still keeps the turbulent state in the channel center region. When Reτ and friction velocity uτ are identical in DNS, the bulk velocity will increase so that similar dissipation and friction are obtained like the water. Consequently, although high DR takes place, the turbulent burst and transport are not obviously weakened which leads to the still high fluctuations in Q2, Q4, and the Reynolds shear stress reaching the level of the Newtonian fluid.
At the same time, the surfactant drag reducing fluid in experiment exhibits the very small wall-normal velocity fluctuations and zero Reynolds shear stress within the whole width of the channel. Especially, the fluctuations in Q2 and Q4 are suppressed to similar level in Q1 and Q3, which indicates the quite depression of the turbulent burst and transport. In addition, comparing Figures 6(b) and 6(d), when Re = 35000 and drag reduction is degraded, the cross-correlation between u+ and v+ of all quadrants also reduces to zero like the case of Re = 10000 in Figure 6(f) where y* = 1. As we know, the rheology of CTAC solution is complicated that the apparent viscosity of the solution will become large when the shear rate decreases. It is implied that elastic or viscous dissipation will also take place to damp the turbulence generation in the channel center area. In DNS, the ratio of the stress controlled by Giesekus model (1 − β) is only 0.2; the viscosity of zero-shear rate is only 1/β times larger than the Newtonian fluid. Especially, Weτ is identical in DNS, but it seems that the real viscosity and relaxation time (λ) will not be identical when shear rate varies.
In addition, when the shear rate becomes large and the structures formed by additives are broken in surfactant solution flow, the drag reduction degradation will take place starting from the wall. Then turbulent state will appear in the areas near the wall, at the same time the drag reducing state is still kept in the center region of the channel. It is just opposite to the distribution in DNS. Moreover, Giesekus model can not describe the viscoelasticity degradation when shear rate is high.
5. Conclusions
Experimental study and DNS using Giesekus model are simultaneously performed aiming at the drag reducing fluids in the rectangle channel. The mass concentration of surfactant in experiment is 25 ppm and the Reynolds numbers are 10000 and 35000, respectively; at the same time DNS is performed when nondimensional Reynolds number is 150 and Weissenberg numbers are 10 and 40. It is found that big differences appear between the experimental and DNS results.
Main differences appear in the distribution of wall-normal velocity fluctuations and Reynolds shear stress. The wall-normal velocity fluctuations in DNS are reduced only in the areas near the wall and will increase again to the Newtonian fluid level when y* increases. Moreover, the Reynolds shear stress also reaches the level of Newtonian fluid in DNS. However in experiment, the wall-normal velocity fluctuations are small and Reynolds shear stress reaches zero in the whole width of the channel.
These differences found by the comparison indicate that Giesekus model will play the role damping the turbulence when shear rate is high in the area near the wall, but its effect will be reduced in the channel central region where the turbulence characteristics are similar to the Newtonian fluid. In the real drag reducing flow, the additives will depress the turbulence leading to the low transverse velocity fluctuations and Reynolds shear stress. Even if the Reynolds number is high and structures formed by additives are broken near the wall, the low turbulence will be kept in the channel central area. As a result, although large drag reduction appears in DNS, Giesekus model still has some limitations in describing the viscoelasticity of surfactant solution.
Conflict of Interests
The authors declare that there is no conflict of interests regarding the publication of this paper.
Footnotes
Acknowledgment
This research is supported by the National Natural Science Foundation of China (no. 51106095).