
Abstract
The study of commuting behaviour has always been one significant focus of people to reach comprehensive knowledge of transport-related scenarios. Similarly, commuting behaviour, as one of the four major physical activities people engaged in during daily life, gained much attention in aspect of health fields. This paper, with the sample data collected by The Australian Diabetes, Obesity and Lifestyle (AusDiab) study, discusses the process of how to utilize data obtained from GPS and inclinometer device, along with basic information about participants to conduct travel survey, and reconstructing participant's commuting behaviour. In the analyses of the sample, the procedure of datasets integration through DELPHI programming and protocols established to determine corresponding commuting behaviour are discussed. The details of commuting behaviour illustrated in this study included travel mode, travel duration, allocation of trip stages, and corresponding level of physical activities. This paper discusses a promise for applying advanced technologies in travel survey instead of traditional ones in terms of accuracy and reliability; it discusses the feasibility to discover the coherent relationship between health outcome and commuting behaviour from travel-tracking technologies.
1. Introduction
A travel survey (or travel diary or travel behaviour inventory) is a survey of individual travel behaviour. Most surveys collect information about an individual, their household, their vehicle (age, make, and model), and a diary of their journeys on a given day (their start and end location, start and end time, mode of travel, accompaniment, and purpose of travel). However, traditional travel survey methods are limited by accuracy of recall, subjective recall burden, reliability, compliance, and so forth. For the recent decades, advanced, portable device has been studied to validate a new way to conduct monitoring of transport-based physical activity, identifying and determining participants’ commuting behaviours (route choice, travel mode, duration, trip frequency, etc.), such as GPS. These technologies present an enormous promise for improving our understanding of the space-time activities of individuals and how they continue their daily free-living activity in terms of commuting.
Transportation, as one of the most possible chances of physical activities people may be exposed to, may have great influence on people's physical behaviour to a great extent. Thus, studies have been conducted to establish the relation between health and transport-related behaviours. Evidence from several large-scale studies has revealed that the energy expenditure during travel stages can be determined and checked whether or not the health standards are being met [1]. The intensity of physical activity for each specific activity undertaken can be represented, for instance, by a metabolic equivalence of task (MET) which accounts for the energy consumption expressed as a ratio of the resting or sitting metabolic rate. Moreover, the energy expenditure for different travel modes has been explored and utilized in health-transport study. In a word, increases in active transport are likely to have significant direct health benefits. By reconstructing participant's travel behaviour successfully, afterwards, it is feasible to assess his/her level of physical activity in terms of transport, revealing underestimated influence of transport on health and providing suggestions for his/her future travel behaviours.
As it is discussed above, the purpose of this study is to reconstruct people's commuting behavior (trip stage, trip duration, and travel mode) from combing application of advanced monitoring technologies, GPS device and inclinometer device, discovering a new way to conduct travel survey, and identify travel-based physical activities from inclinometer database to assess people's commuting behavior on health outcome.
The remainder of this paper is organized as follows. The following section provides an overview of measuring tools and data description. In Section 3, an overall description of the methodology is given. Section 4 presents the results and discusses the key findings. Finally, conclusions and future directions are discussed.
2. Measuring Tools and Data Description
2.1. Measuring Tools
2.1.1. GPS Receiver
The global positioning system (GPS) is satellite-based system for navigation. This system, along with the application of signal receiver unit, makes it possible to pinpoint a subject's location (usually as longitude and latitude indicating), speed of movement at each instant, time record, heading, data quality measures, and so forth.
The GPS receiver used in this study is data logging GPS receiver—BTT08, developed by ITLS (Institute for Transport and Logistics Studies, the University of Sydney, Australia) (Figure 1).

GPS receiver BTT08.
Data stream collected from data logging GPS receiver—BTT08 and corresponding illustrations for each parameter are illustrated in Table 1.
Data stream logged from GPS receiver-BTT08.

Number of satellites is the number of visible satellites and reflects signal strength from satellites.
HDOP reflects the effect of geometry of the satellites on position error. The lower value represents a better GPS positional precision.
Time interval refers to the time gap for each recording, usually as 1 s, 3 s, or other, depending on the study.
2.1.2. Inclinometer Device
Inclinometer device, as a type of unobtrusive technology, was developed to accurately describe posture allocation and free-living activity during the day. Data from inclinometer device rebuild a much more explicit scene when subject is sedentary (sitting), upright (standing), and stepping. So the combination of inclinometer device and other advanced technologies is highly recommended when conducting real-time behaviour recording, such as travel survey. The inclinometer used in this study is activPAL (Figure 2).

Inclinometer unit and wear illustration.
By using proprietary algorithms, activPAL classifies an individual's free-living activity into periods spent sitting, standing, and walking by detecting the posture (horizontal: sitting, vertical: standing, and oscillating: walking). This information can be used to estimate daily energy expenditure and record changes in the free-living activities for health-related supervision. The activPAL is attached directly to participant's thigh (Figure 2).
Data streams obtained from activPAL are shown in Table 2.
Data stream logged from activPAL.

Recorded in each time interval separately.
MET.s is the metabolic equivalent tasks that reveals the intensity of activity.
Time interval refers to the time gap for each recording, usually as 15 s, depending on the study.
2.2. Data Description
2.2.1. Data Source
The Australian Diabetes, Obesity and Lifestyle (AusDiab) study is a national, population-based cohort study of Australian adults examining the prevalence of diabetes and related risk factors. A stratified cluster sampling method was used for the study. Six census collector districts (CCDs—the smallest geographic unit defined by the Australian Bureau of Statistics) were selected from each state in Australia (six states and northern territory). Participants were then randomly chosen from each of 42 CCD clusters. A further data collection (AusDiab3) was conducted in 2011/12, in which 3,633 adults participated, which is applied in this study.
2.2.2. Data Collection
A study involving GPS was carried out for a subsample of the AusDiab3 study. GPS data were collected between November 2011 and March 2012 in 13 CCD clusters in New South Wales (Auburn, Berkley Vale, and West Pennant Hills), Queensland (Chapel Hill, Currumbin, Nambour, and Toowoomba), and South Australia (Glenelg, Millicent, Netley, Parafield Gardens, Port Lincoln, and Unley). Participants were asked to visit a data collection centre setup at each study area for data collection, including interviews and biomedical examinations (anthropometric measurements, fasting blood sample collection, etc.). Every fifth participants attending the data collection centres for the above 13 CCD clusters was asked to participate in the GPS substudy. Participants of the GPS substudy were asked to carry a GPS receiver for 7 consecutive days whenever they go out. GPS receivers used for the NSW participants were GPS-BTT08M (as described in Section 2.1.1), and those used for the QLD and SA participants were GlobalSat DG100. Both receivers use the same GPS features (satellite band and frequency); thus, they are considered to produce similarly accurate location coordinates. In total, 263 participants agreed to take part in the GPS substudy. Those who agreed to participate signed the consent form. The study was approved by the Alfred Health Human Ethics Committee.
2.2.3. Data Extraction and Derivation
Participants of the GPS substudy also wore an activity monitoring device, activPAL (PAL Technologies) (as described in Section 2.1.2), for seven-day period (possibly longer or less). Data from the GPS receiver and inclinometer were synchronised to identify time spent sitting, standing, and walking while outdoors. More specifically, GPS provides information about when participants are outdoors (e.g., between home and work, errands, and lunch break). For each outdoor period identified by GPS, posture information from inclinometer was applied to divide the period between sitting, standing, and walking. The daily average time spent sitting, standing, and walking outdoors was calculated for each participant.
2.2.4. Target Sample Analysed in This Paper
Among the total 263 participants in this study, we choose one typical sample to mainly discuss the procedure of analyses. Details of the sample are shown in Table 3.
Details about the sample participant in this paper.

3. Methodology and Procedures for the Sample Analyses
3.1. Convert Format and Synchronize Datasets
3.1.1. Convert Format
As the test procedure discussed before, GPS devices are carried by participants for a period of days and then returned to field staff. After the returning, the device is connected to PC via the USB connector, and the GPS data stored in the device need to be downloaded by specific GPS data logger software—8 Meg GPS data logger control software (Figure 3). The format of output file is automatically set as comma separate values (.csv).
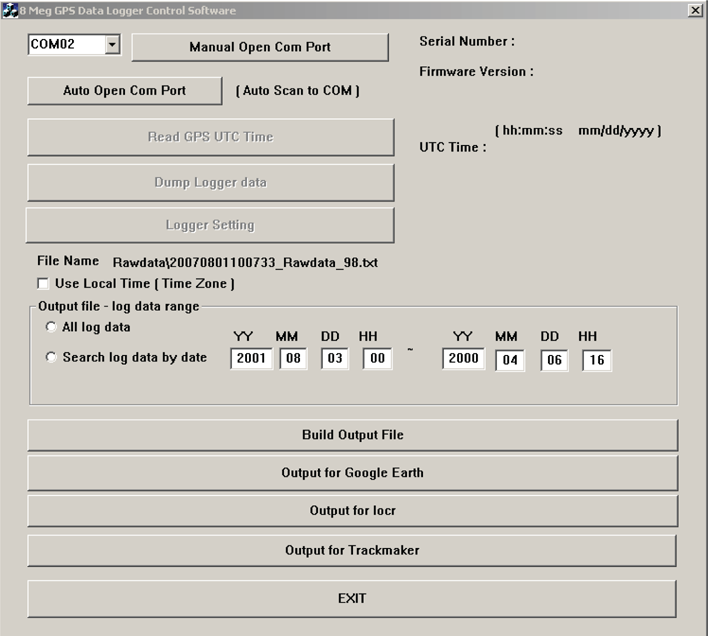
Interface of 8 Meg GPS data logger control software.
The general output files are like that shown in Table 4.
Raw GPS data output in CSV format.

Similarly, the data stored in the inclinometer device will also be downloaded by corresponding software in the chosen format as csv. The output file of the inclinometer data in csv format is shown in Table 5.
Raw inclinometer data output in CSV format.

3.1.2. Synchronize Datasets
In AusDiab study, all the participants are marked by three IDs. One is for the GPS device in use; one is referred to the inclinometer unit; and the third one is referred as participant ID, used for storing health-related information. This integration of datasets is recorded in EXCEL file (Table 6).
Datasets integration in EXCEL files during preprocessing.

After matching the two units to one target participant, the data stored in each unit need to be synchronized by its date and time details. Each logged record in GPS and inclinometer units contains the details of date and time. For GPS records, the details are shown as “DD/MM/YYYY” and “HH:MM:SS” in two separate columns. In inclinometer csv files, the time details are displayed as “#YYYY/MM/DD HH:MM:SS#” in one single column. The following synchronizing procedure is achieved by DELPHI programming. In the programme, GPS csv file and inclinometer csv file marked as records for one target participant are read in. Each line of records of both files is read in as unrecognized characters. After converting each character into meaningful integer indicating typical date and time details, each line of records is then identified by date and time details up-to-the-second.
3.2. Output Visualized Graphs
It is dull and time-consuming to look into the two datasets in separate csv files for obtaining related and available information, and figures themselves in the files fail to portrait an explicit scene of behaviour reconstructed by subject's movements message (indicated by inclinometer data) and location/speed information (obtained from GPS unit), even if the records are synchronized. Thus, a visualized way is developed to illustrate the data, building the platform for future research.
By DELPHI programming, all the data information from two separate datasets (GPS and inclinometer data) are integrated into one graph (Figure 4), with the premise of completed synchronizing procedure. Graph illustration is briefly induced in Table 7.
Output graph illustration.

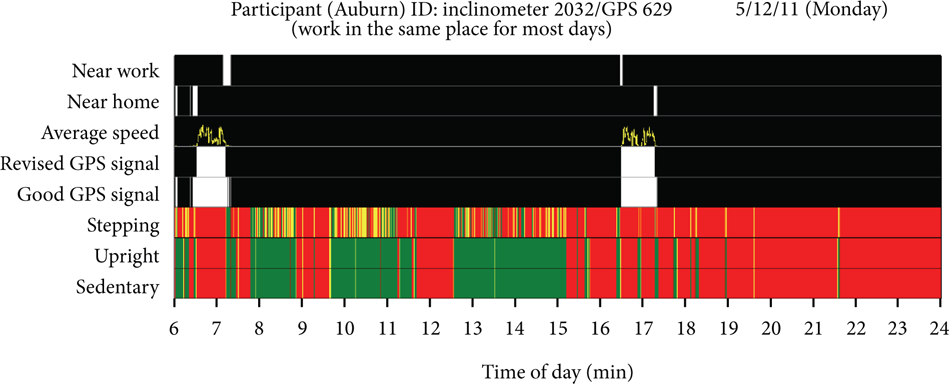
Data integration through DELPHI-programmed graph output.
Further instructions for the graph are as follows.
(1) Near Home/Near Work. Each participant's home address and work address (if any) are obtained during the initial stage of recruitment by filling consent form. The addresses are then geocoded by longitude and latitude, such as (−34.94013, 138.502219). In DELPHI programming, algorithm of determining distances between two locations with known longitude and latitude is established. If the distance between instant location and home/work is less than 30 m/150 m, the Boolean variable “near home/near work” is set false.
Specially, if participant do not work or have not fixed work location, the longitude and latitude of work location are set (0, 0).
(2) Average Speed. In this study, time interval of GPS recording is set as 3 seconds. In order to reduce complexity and dimensionality of the dataset, average speed is calculated within 1 minute, with maximum 20 records in total. The equation is defined as

(3) Good GPS Signal. In each GPS recording, one recorded parameter is “number of satellites” (Table 1), which indicates the signal strength from satellites. To enhance the accuracy of the research, only the records with more than 5 (including 5) are discussed and considered to be eligible, marked as “Good GPS signal” in the programme. Similarly, “Good GPS signal” is marked for each one minute. If there exists one recording with more than 5 satellites, the whole minute that contains this record is considered to be with “Good GPS signal.”
(4) Revised GPS Signal. In the programming, it follows the data extraction rule as the flow chart shown in Figure 5.

Flow chart for Good GPS data extraction.
(5) Stepping. When participant is stepping, the inclinometer unit senses vibration, recording instant movement as “stepping.” Inclinometer data is recorded every 15 s, including records of stepping time during this period (Table 2). In DELPHI programming, four records are integrated as one to be read as one-minute record. Thus, stepping time is summed up in every one minute (t). If
40 s < t ≤ 60 s, then “stepping” appears green;
20 s < t ≤ 40 s, then “stepping” appears yellow;
0 s ≤ t ≤ 20 s, then “stepping” appears red.
(6) Upright. When participant keeps standing without stepping, inclinometer unit detects vertical posture, recording instant movement as “upright.” Similarly, in DELPHI programming, four records are integrated as one to be read as one-minute record. Thus, upright time is summed up in every one minute (t). If
40 s < t ≤ 60 s, then “upright” appears green;
20 s < t ≤ 40 s, then “upright” appears yellow;
0 s ≤ t ≤ 20 s, then “upright” appears red.
(7) Sedentary. When participant is sitting, inclinometer unit detects horizontal posture, recording instant movement as “sedentary.” Similarly, sedentary time is summed up in every one minute (t). If
40 s < t ≤ 60 s, then “sedentary” appears red;
20 s < t ≤ 40 s, then “sedentary” appears yellow;
0 s ≤ t ≤ 20 s, then “sedentary” appears green.
(8) Horizontal Axis (Time of the Day). In this study, commuting behaviour is preconsidered to be around 6 am–24 pm in one single day (exceptions exist and need additional discussion). The horizontal axis shows the consecutive time range for 18 hours (1080 minutes), unit minute.
3.3. Identify Valid Integrated Data for Future Discussion
Many factors contribute to the invalid data collection; possible factors are summarized as shown in Table 8. The procedure of identifying valid integrated data is done on the basis of the completed graph output. Through the visible graphical identification, it is much easier and simpler to figure out invalid data collection. One example of invalid data collection caused by incorrect wear of inclinometer unit is identified by graph, shown in Figure 6.
Summary of potential error causes during data collection.


Example of invalid data collection caused by incorrect wear of inclinometer unit.
In this paper, the target sample participant is up to the mustard after excluding all the possible error causes. Thus, the next analyses of this sample data are feasible and significative.
3.4. Trip Identification
3.4.1. GPS Data Filter
To identify trip during commuting, two acknowledges are agreed and applied in this study.
Trips take place outdoors (mainly refer to be out of concrete buildings);
trips take place along with consecutive and nonignorable speed.
However, exceptions exist for these two assumptions, such as
for modes like public transportation, especially underground metro, it is quite possible that GPS signals are blocked and interrupted by concrete cover structure without detecting, whereas trips do take place during this period;
some indoor activities may occur accompanied by significant speed, like shopping by continuously walking.
Due to complexity and diversity of unpredicted exceptions that may emerge, not all the exceptions are listed here. For these circumstances, further discussion and more targeted analyses are needed.
In AusDiab study, since residential address and work address are recorded for the consideration of future study, two potential trip destinations have been prelogged with reliable accuracy for investigating of commuting behaviour. Thus, once the participant is recorded as near home/near work via GPS logged data indication, one trip end as home/work is identified.
The sample participant discussed in this part is a working person, and the analysed day of this person is Monday, which indicates that home and work location are probably two ends of the whole-day trips.
In DELPHI programming, “near home”/“near work” indication is given when the subject is within the scope of 30 m/150 m away from home/work address. Therefore, a buffer zone is incidentally created around home/work location, which cannot explicitly display the exact start/end point of the commuting trip.
Also, there is a great chance that GPS signal is detected when the participant is still at home or stay in the workplace. For example, if the building is single-deck, GPS signals could reach the receiver even if the participant is staying indoors. To distinguish outdoor and indoor activities, finding out the exact division point of these two activities, information of speed is applied to address this issue. It is supposed that those activities taken places at home/work location are completed by walking or sitting, keeping average speed less than 3 km/h. Thus, signals detected as “near home”/“near work” but with average speed > 3 km/h are processed as outdoor signals, being potential components of actual trips for further discussion.
By GPS data filter, location data marked as “near home” or “near work” is processed first. But the exact starting/end point of the trip can still not be recognized with precision due to exceptions mentioned above. Take the example of home-around GPS data filter, two possible results of error after this procedure are shown in Figure 7.
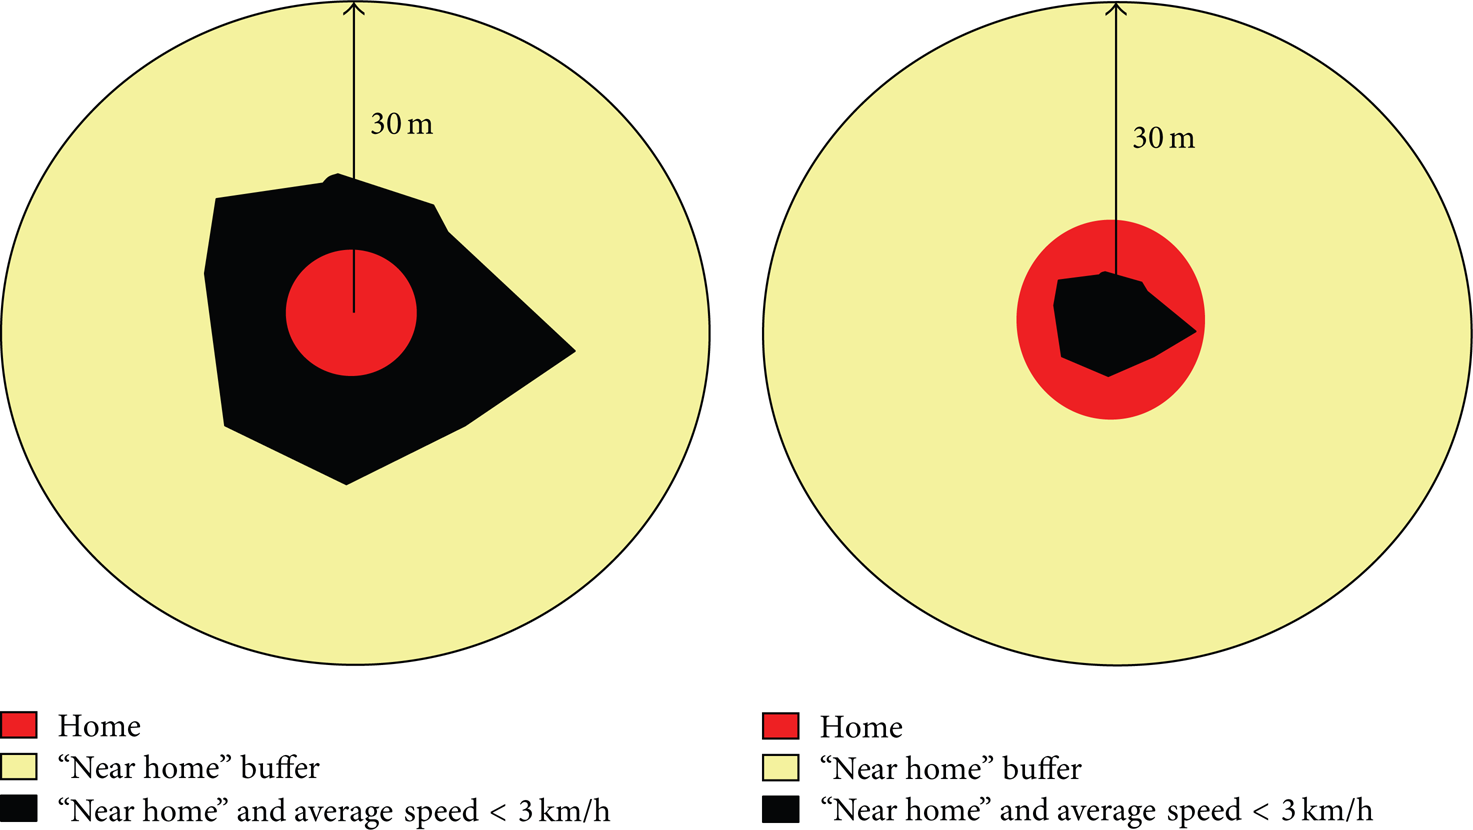
Two possible results of GPS data filter for “Near home” data extraction.
For other signals not marked as “near home” or “near work,” they are all treated as signals during the trips in present stage for future verifying and discussion.
The two steps discussed above are just the “Good GPS signal” extraction procedures, which are run in the DELPHI programming to obtain “revised GPS signal.” Procedures in detail have clarified in Section 3.4.1.
Up to this point, the first step of identifying trip has been completed solely based on GPS data. Errors and imprecision still exist due to the lack of indications. Thus, the next stage of trip identification process is conducted using inclinometer dataset, aimed at improving precision of identification further.
3.4.2. Amendment of Trip Identification by Inclinometer Data
After GPS data filter, primeval step has been conducted to detect potential trips, which is implied by the signals indicating subject's away from home/work and being outdoors. However, these trips have not been divided into meaningful ones, trip segments, which represent some typical travel mode or totally different trips during the day. Briefly, trip segmentation is required to detect exact trip ends and classify trips by different properties (trip mode, along with possible trip purpose).
There is strong justification to believe that the change points of the trip, ends of each segmented trips, are associated with some particular posture change or changes of properties for one keeping posture. In detail, this detecting approach is derived from the following common sense knowledge of the real world and is justified in the past study [2]:
Walking should be a transition between different transportation modes. In other words, the start point and end point of a trip have a very high probability to be the points of walking or just stopping walking.
Typically, if one travel mode is walking, even if the next transition period for another travel mode is also walking, there exists difference in velocities of different periods of walking.
In a word, to detect the exact ends of one trip segmentation, focusing on the incident posture changes is considerable. This is just where the intention of application of inclinometer device lies in. As outlined above, with the purpose of detecting participant's free-living physical activities, inclinometer unit is applied in this study. In practical terms, inclinometer unit offers a more explicit indication about people's postures (sitting, standing, and stepping) during the tested day. Two of the parameters inclinometer logged are “sedentary to upright movements” and “upright to sedentary movements,” which refer to the number of corresponding posture changes during every recording time interval (Table 2).
For instance, when “sedentary to upright movements” is recorded as “1” during one subject minute, this indicates that the participant changes his/her posture from sitting to standing at that moment. If the following period is recorded as continuously stepping, the minute marked with one change of posture from “sedentary” to “upright” is considered to be one potential end of some trip segmentation.
For the sample data analysed in this paper, DELPHI is run to search for the exact time point of posture change minutes marked with positive integer (1, 2, 3, …) of “sedentary to upright movements”/“upright to sedentary movements” parameter. Obviously, not all the posture change points refer to the start/end point of one trip. Thus, this result is then combined with the GPS data which are selected by “GPS data filter” procedure (Section 3.4.1) to determine trips in partitioned segments.
3.4.3. Establish Initial Trip Lists and Validate through the Visualized Map
After two procedures of determining segmented trips (GPS data filter and amendment by inclinometer data), an initial trip list is created through DELPHI, with partitioning trips into potential different trip modes or trip purpose.
To simplify and standardize analyses, different trip segmentations obtained from previous study are classified by trip purpose.
For the sample participant discussed in this paper, he/she had typical commuting behaviour as a working person (Table 3) during the tested day. Thus, trip purposes for him/her during the day can be summarized as work and home, for trip segmentations in the morning and in the afternoon, respectively (Figure 8).

Tree diagram of trip classification for the sample participant.
For each segmented trip, location coordinates (longitude and latitude) are extracted through DELPHI and saved as csv (Comma Separated Value) file format. This format of file cannot be opened and read in any map visualization software. Thus, an online file converter is adopted to convert csv file into KML file format, which is supported by most of the GIS-related operating software.
In this study, Google Earth is applied to read the converted KML files, displaying the geographic data in the browser (Figure 9).

GPS data visualization in Google Earth.
Through the procedure of visualizing GPS data into the map, invalid data can be figured out, such as abnormal trip route with incredible high speed, and the initial trip lists are checked. During this procedure, raw GPS data indicating routes deviating from normal ones are corrected manually (Figure 10).
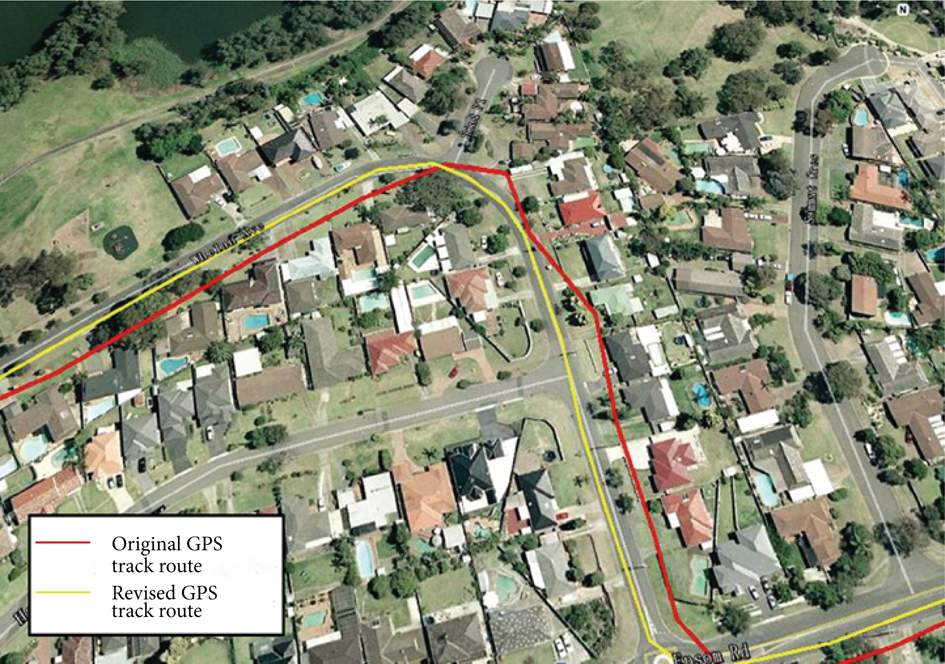
Correct abnormal GPS route manually.
Also, the partition of the trips can be validated through the visualized map, checking whether each end of the trip determined by previous procedures makes sense, such as whether these ends indicating bus stop, parking lot, or activity-based locations like shopping mall.
Up to this point, trip list has been checked and revised manually through the application of GIS technology (results shown in Table 11). The following analyses are based on each segmented trip, determining travel modes and time duration of postures (sitting/standing/stepping) during each period.
3.5. Mode Detection
In Australia, four categories of transportation gain the most concern when it comes to determining travel modes. They are concluded as walking, cycling, public transportation (bus, tram, train, and ferry), and personal cars. However, each of the travel mode has a set of sophisticated GPS-logged data features, including average speed, acceleration, stop rate, heading change rate, which makes it harder to infer the exact travel mode only based on GPS records. Thus, a new detection procedure and method is proposed in this paper with the integrated data source from both GPS and inclinometer unit.
For the four modes outlined above, two categories are established as active transportation and nonactive transportation from them. In particular, active transportation refers to nonmotorized travel mode: walking and cycling; nonactive transportation includes public transportation and personal car. Under normal circumstances, active transportation (walking or cycling) has the indication of stepping posture via inclinometer unit recording; whereas, nonactive ones (public transportation or personal car) are supposed to be achieved in sedentary (sitting) status.
Verified by two volunteers with travel diary and the application of two units, walking and cycling will be recorded as consistent “upright,” along with sporadic “stepping” period in inclinometer data. Thus, the distinction between “active transportation” and “nonactive transportation” period can be achieved from inclinometer data indication in every one-minute epoch, as shown in Table 9.
Inclinometer data indication of mode detection by PA intensity.
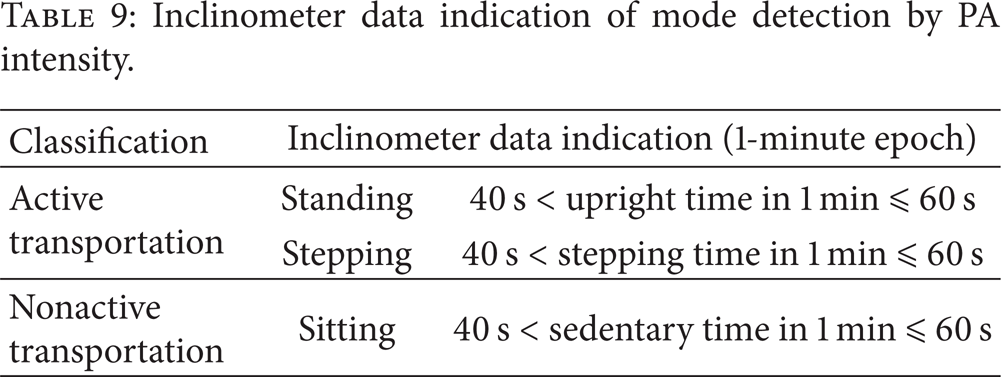
For trip segments detected as “active transportation” period, which means travel mode is one of walking and cycling, procedure of GPS-logged speed feature extraction is followed. If the average speed was less than 6 km/h with the maximum speed not greater than 10 km/h, travel mode of this trip segment is determined as walking. Naturally, travel mode for the rest segments noted as “nonactive transportation” is cycling.
As illustrated above, nonactive transportations include public transportation (PT) and personal car. Considering the regular routes and stops typically for public transportation, first to be identified are trips by public transport. This procedure is conducted with the application of a GIS street layer. Usually, the beginning and possibly the end for the identified PT trip should be on a PT line, and there may be evidence of periodic stops that not necessarily coincide with intersections, if the device was able to retain position while in use on a bus, train, or tram. In particular, as the empirical value indicated [2], if the average speed of one PT period ranges from 10 km/h to 40 km/h, the trip is probably a bus trip. If it is a higher speed and the starting and/or ending point is on a rail line, then the trip is probably a train trip. In particular, train and tram routes are recognisable from the network layer in Google Earth, which provides a more explicit suggestion if the logging points are recorded along the line. At this point, after detecting PT modes from “nonactive transportation” periods, all remaining trips that have not been assigned a mode should be trips by personal car.
3.6. Health-Related Analyses
Based on the results of trip identification, physical activities during the testing day can be classified into trip-based and non-trip-based ones, along with incident time allocation of different postures (sitting, standing, and stepping).
Sedentary (sitting) time is the primary concern, with the potential adverse impact on people's health. Thus, the proportion of sedentary time is calculated among trip time, nontrip time, and total day. Meanwhile, metabolic equivalence of task (MET) which accounts for the energy consumption expressed as a ratio of the resting or sitting metabolic rate is calculated in one-minute epoch based on the raw data source. Activity score is obtained from inclinometer data collection (Table 7) to illustrate the energy expenditure during the testing day. The formula for calculating METs for one-minute epoch is shown as
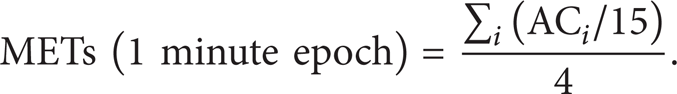
METs (1 minute epoch): average MET value in one minute, unit: MET; AC i : activity score obtained from raw inclinometer data, recorded in every 15 seconds, unit: METs; and i: positive integer, indicating sequence of inclinometer records in one minute, from 1 to 4.
Results of the subject's physical activity (PA) intensity for each one minute are then classified into four categories: light, moderate, hard, and very hard, according to the established empirical reference value (Table 10). Assessment is proposed based on checking whether the health guidance is achieved by the subject during one-day period, and suggestions are proposed for his/her future commuting behaviour.
Reference value for PA intensity classification (20).

Initial and final trip list for the sample participant.

4. Results
4.1. Trip Identification and Trip Mode Detection
Initial and final trip lists obtained from previous procedures (trip identification) are shown in Table 11.
For reconstructing a comprehensive behaviour during the testing day, all the GPS logged data (including nontrip GPS data, eliminated by DELPHI programming) are processed in GIS, mapping the GPS trajectory. Figure 11 shows the complete scenario depicted by GPS data logged in the morning as Trip 1, constituted by two data sources.

Trip 1 reconstruction.
Partial view of trip start point and transition point between Trip 1a and Trip 1b are shown in Figures 12 and 13.

Partial view of Trip 1—start point of Trip 1a.

Partial view of Trip 1a and Trip 1b.
Trip 1b is derived from the rest of raw GPS logged data, which has been eliminated by DELPHI programming in previous procedures. According to Figure 13, it is explicit that the transition point between Trip 1a and Trip 1b occurred in the parking lot. Thus, there is strong justification to make the hypothesis that the participant drove directly to the parking lot near the work location and then walked to the office inside the building. GPS data recorded as Trip 1b is preassumed as “near work” and the “average speed” is calculated as less than 3 km/h by GPS data filter procedure, and no distinct posture change is detected through inclinometer data amendment procedure. Thus, these data are eliminated according to the protocol established previously.
Similarly, Trip 2 is also mapped via GIS, with four separate trip segments. Global view is shown in Figure 14.

Trip 2 reconstruction.
In the course of Trip 2, one linked trip is detected as Trip 2b. This period is distinct from Trip 2a and Trip 2c in terms of its consistent low speed and posture recorded as walking, rather than sitting. According to previously established trip identification and mode detection principle, this trip stage is figured out. Partial view of Trip 2b is shown in Figure 15.

Partial view of Trip 2b.
It is obtained from DELPHI location coordinates output and GIS analyses that the path length of Trip 2b is approximately 150 meters and it lasts for six minutes as walking. Based on the results from separate technologies above Figure 15 can be interpreted that the participant stopped in one parking lot during halfway home and engaged in some unknown-purpose activity based on walking around the parking lot for about six minutes.
Similar to Trip 1 analyses, one undetected trip stage, Trip 2d is portrayed based on the rest raw GPS data in Trip 2 analyses. Details are shown in Figure 16.

Partial view of Trip 2d.
GPS data corresponding with Trip 2d are eliminated previously on account of their indications as “near home,” “average speed” of being less than 3 km/h, and no distinct posture change points detected. Since the movements along with continuous low speed of walking around home location could be anything marked as leisure household activities, it is rational to treat this part of logged GPS and inclinometer data as home-based activity records, excluding from trip-related datasets.
4.2. Outcomes of Health-Related Analysis
As outlined above, the proportion of sedentary time is calculated among trip time, nontrip time, and total time of commuting (6 am–24 pm). Results are shown in Figure 17. Moreover, allocation of intensity of physical activity measured by MET during the day (6 am–24 pm) and the total trip is shown in Figures 18 and 19.

Sedentary time proportion and allocation.

Energy expenditure during the day (6 am–24 pm).

Duration of PA by intensity from the whole day trip (Trip 1 and Trip 2).
According to the chart of Figure 17(a), sedentary behaviour occupies a high proportion of time (84.49%) during the total trip in the testing day, which lasts for about 1 h 24 min (83.66 minutes). This sedentary period is contributed by the trips in personal car. Specially, 41.87 minutes account for the continuous sedentary behaviour taken place in Trip 1 course; 41.79 minutes account for two separate stages of sedentary car trip in total (Trip 2a and Trip 2c).
During Trip 2, sedentary behaviour taken place in Trip 2a and Trip 2c is interrupted by one linked trip (Trip 2b), substituted by six-minute walking behaviour. Studies have shown evidence that breaking up consistent sedentary time with short bouts of activity (like light to moderate intensity walking) has beneficial associations with health [3]. Thus, for avoiding long-time, uninterrupted sedentary behaviour during the trip, it is highly recommended to engage in some active physical activities, such as shopping and pick-up, instead of sedentary ones.
As shown in Figure 17(b), only an insignificant fraction of active postures (upright/stepping) is achieved during trip period, calculated as (3.79%). In terms of physical activity intensity measured by MET value as shown in Figures 18 and 19, transport (Trip1 and Trip2) only achieves a little amount of moderate intensity PA (4%), with most of light PA (96%).
This result illustrates the fact of participant's relatively inactive physical activities from transportation. From the view of health, multimodes of transportation, especially active ones like walking or cycling, are recommended to be integrated into the whole trip of commuting for the subject.
5. Discussion and Future Avenue
In this study, procedures and methods are proposed to conduct travel survey instead of conventional ones based on GPS, inclinometer, and GIS technologies. Moreover, with the abundant data source from inclinometer unit, health-related messages are interpreted and suggestions for future transportation behaviour are proposed to reduce adverse transport-related health outcomes.
Despite the innovation and possible promising application in the future for this study field, limitations still exist for present research mentioned in this paper. From the macroscopic view, these limitations can be classified into two aspects: unconfirmed integrity and validity of GPS datasets and empirical assumption for detecting different travel mode segments from posture change time points. Detailed illustrations are presented as follows.
The GPS data mining process is accomplished by GPS data filter procedure in this study. The purpose of GPS data filter is to extract GPS data indicating subject's being away from home (30 m*) and work location (150 m*) from raw datasets. Then ignore all the brief GPS signal drops which are less than 3* minutes and eliminate single signals which are less than 1* minute. The threshold figures (*) mentioned above are constant variables in DELPHI programming, whereas they are empirical ones and may vary in accordance with different individuals. Moreover, no procedure is implemented in this stage to check GPS data validity and integrity. In particular, the possibility of common place signal loss and misrecorded data is not taken into consideration. Thus the extracted data obtained from this procedure may be incomplete and partly incorrect to reconstruct the subject's commuting behaviour.
In this study, apart from GPS unit, inclinometer unit is in use as one auxiliary technology of GPS, aimed at improving the precision of monitoring. Thus, the amendment procedure by inclinometer data is conducted after GPS data filter (Section 3.4.1). In short, the amendment procedure is to find out explicit posture change point from inclinometer data, with the preassumed agreement that ends of any segmented trip are accompanied by obvious posture change. The detection of posture change for the sample in this paper is achieved by indication of nonzero “sedentary to upright movements”/“upright to sedentary movements” parameters in specific point of time. However, exceptions exist when the subject keeps consistent posture during transitional period. For instance, if the subject keeps walking in the shopping mall and then walks home, no indication will be revealed for the change of postures during these two separate trip stages, and the automatic DELPHI programme cannot figure these two trip stages out.
In the procedure of mode detection, agreements are reached that travel modes taken into consideration in this study are restricted to four kinds (walking, cycling, public transportation, and personal car). However, this assumption does not coincide with all the possibilities, such as the possible use of motorbike. Further, the first step to distinguish four modes in this study is to classify them into active ones and nonactive ones, with preestablished knowledge that course during nonactive transportation period is in sedentary (sitting) status. Whereas, this hypothesis is questioned and contradictory against some facts. For example, the subject may be standing all the way during his/her trip in bus/tram/train (non-active travel mode), but this course of trip may be marked as active one due to the detection of posture solely. Moreover, to our knowledge, GPS signal is sporadic in the bus trip; almost nonexistent in the train trip and usually good during walking, cycling, and personal car trip. This distinction may cause inevitable detecting bias among these travel modes. Thus, a further manual check of GPS signal integrity and validity for all the modes after identifying in the preliminary stage is required to valid mode detection procedure.
In this study, it successfully developed and tested a procedure of commuting behaviour reconstructing for one target participant, estimating the amount of energy expenditure from commuting trips using GPS and inclinometers. To date, no study has combined GPS data and inclinometer data to investigate commuting behaviour in people's daily life. Despite the limitations outlined above, one cannot negate the promising prospect of this application. To expand the scope of application, making the automatic running programme applicable to more distinct cases, the method and algorithm mentioned in this paper may need further validation and correction.
Conflict of Interests
The authors declare that there is no conflict of interests regarding the publication of this paper.
Footnotes
Acknowledgments
This research is conducted at Monash University, Australia, between February 2013 and May 2013, under the programme “International communication project for the superior undergraduate students” funded by Chinese Scholarship Council. And this research is also supported by the National Key Basic Research Program of China (2012 CB725400) and Natural Science Foundation of China (51378120, 51338003, and 50908052). Fundamental Research Fund for the Central Universities and Foundation for Young Key Teachers of Southeast University are also appreciated.