
Abstract
The measurement performance of the roller tester for the vehicle brake force is evaluated by both proposed dynamic calibration and traditional static calibration to find an effective way for ensuring the vehicle safety. Three static parameters, brake force error of a single bench, difference of the left and right benches, and measurement repeatability, are verified to be eligible in the experiments. However, the experimental results of the dynamic calibration prove that the same brake tester fails on the repeatability with a 10.4% error. The dynamic calibration method improves the measurement performance of the brake tester in practical applications.
1. Introduction
Brake safety of vehicles is the crucial performance for automobile safety and is one of the central issues in the research field of active safety [1–4]. To output the right brake force from vehicle brake system, the brake performance should be inspected by brake tester periodically [5, 6]. The brake balance which is the difference between the brake force values of the left and right wheels is another item which should be considered in brake performance test. The roller brake tester is the widely used equipment to test brake performance of vehicles [7–9]. In the inspection process, a vehicle whose transmission is in neutral position is tested on the rotating rollers with rough surfaces of the tester. The wheels of the vehicle are driven by the rollers which are controlled by electric motors. When the driver steps the brake pedal, brake forces are transferred from the left and right wheels to the rollers and then to the force sensors connected to the rollers. The measurement system detects the brake sensor signals and makes the electric motors stop after receiving the signals to avoid the rough surface of the rollers damaging the wheels. The whole measurement process is completed within several seconds.
Calibration is the effective way to ensure the precision of the brake tester directly and enhance the brake performance of the vehicle indirectly [10–12]. In previous researches, most of the calibration methods are presented according to the static inspection status by which the calibration force is carried out on a static roller [13, 14]. However, the static calibration cannot reflect the real brake procedure as the measurement curve of the dynamic brake force is delayed in the signal transmission process. The problem of the former approaches is that a qualified brake tester calibrated in static status possibly fails in dynamic test since the static calibration is only performed on a few points of the dynamic calibration curve affected by brake vibration. Therefore, the measurement performance of the tester should be calibrated in the entire brake process instead of the static status.
To solve the calibration problem outlined above, a novel method of continuous dynamic loading is proposed in this paper. The calibration instrument with a stepper electric motor is constructed to simulate the loading curve accurately. The dynamic calibration experiments are comparatively performed on the same brake tester with the one for the static calibration experiments. Both of the dynamic and static calibration results are achieved for the comprehensive analysis of the tester measurement performance.
2. Dynamic Calibration Method
Considering the short measurement time, the standard curve of brake force must be exerted precisely onto the roller within several seconds. The calibration instrument is illustrated in Figure 1. The servo force mechanism provides the displacement in vertical direction which is transferred from stepper electric motor and reducer. The force is exerted onto the rollers of brake tester delivered by the buffer, force transferring beam, and measurement mechanism, successively. The pin-type force sensor is installed inside the inner rings of the bears which are used to connect the force transferring beam and the measurement mechanism. For evaluating the proposed method of dynamic calibration, the static experiments and dynamic experiments are executed, respectively.

Dynamic calibration instrument. (1) Servo force mechanism, (2) buffer mechanism, (3) force transferring beam, (4) measurement mechanism, and (5) supporting frame.
3. Static Calibration Results and Discussions
The calibration experiments choose the brake tester FC-10C as the object which inspects about 10000 vehicles every year in Changchun. The rated load of the tester is 10000 kg while the largest inspection force is 30 kN. The static calibration system is described in Figure 2.
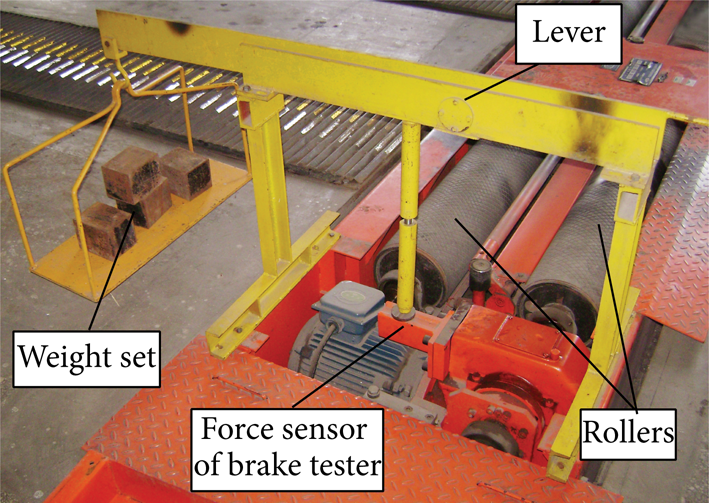
Static calibration method.
The widely used static calibration method consists of weight set which is adopted to simulate the brake force, lever, and frame which are employed to transfer the gravity of the weight set onto the force sensor of the experimental brake tester. The power of the tester motor is turned off for safety. According to the national standard of brake tester, more than five calibration points should be implemented with the sequence of loading weights from light to heavy. Eight calibration points are selected for left and right benches separately. The experiments are repeated three times and the results of left and right benches are recorded in Tables 1 and 2 individually. Note that the simulated brake force P i in the tables is magnified by the lever from the mass m i of the weight set. Then the variables in the tables can be solved by
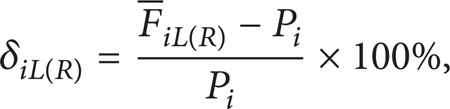
where δiL(R) is the brake force error of left (right) bench,
Brake force measurement errors of the left bench.

Brake force measurement errors of the right bench.

In the national standard of China, the error should be lower than 3% for every bench of the brake tester. Considering the static calibration results in Tables 1 and 2, the largest error is 2.55% which meets the requirement of the national standard. Nevertheless, checking the errors of a separate bench of the tester only is not enough for safety. The difference between the left and right benches also should be calculated by

where δ Pi is the brake force error between the left and right benches of the tester and δiL(R) is the brake force error of left (right) bench. The significance of the value δ Pi is to avoid the side-slip accidents caused by unbalanced brake forces. The experimental results are introduced in Table 3. The maximal value 2.25% is also lower than the national standard of 3% error.
Brake force difference between the left and right benches of the brake tester.

The third characteristic calibrated is measurement repeatability. The parameter is expressed by

where ρiL(R) is the repeatability error of brake tester, FiL(R) max is the maximum value of left (right) bench in three times, FiL(R)min is the minimum value of left (right) bench in three times, and
Measurement repeatability of the brake force of the left bench.

Measurement repeatability of the brake force of the right bench.

4. Dynamic Calibration Results
In the static calibration, the comprehensive calibration experiments are performed on the brake tester for the three important items stipulated by the national standard. The calibration results certify that the brake tester is available according to the static calibration results. However, the response performance of the brake tester cannot be disclosed in static status. To solve this problem, the calibration experiments are achieved on the same brake tester with the presented calibration method as Figure 3 shows.

Static calibration method.
A representative brake curve of real vehicles in Figure 4 with three broken lines is utilized as the input controlling signal. The first broken line from 0 s to 0.7 s simulates the increasing brake force at the beginning stage. The second line segment from 0.7 s to 1.8 s stands for the continued braking process. The third line from 1.8 s to 2.5 s represents the releasing procedure of the brake force. The brake curve is separately exerted onto the left and right benches three times to expose the output curve of the brake tester. The input calibration force curves of the calibration instrument and the output tracking curves of the brake force are shown in Figures 5 and 6. For comparing the calibration curve and tester results with the idealism curve in Figure 4, ten experimental points related to the first broken line are observed in Tables 6 and 7.
Dynamic calibration results of the left bench in the force increasing stage.

Dynamic calibration results of the right bench in the force increasing stage.

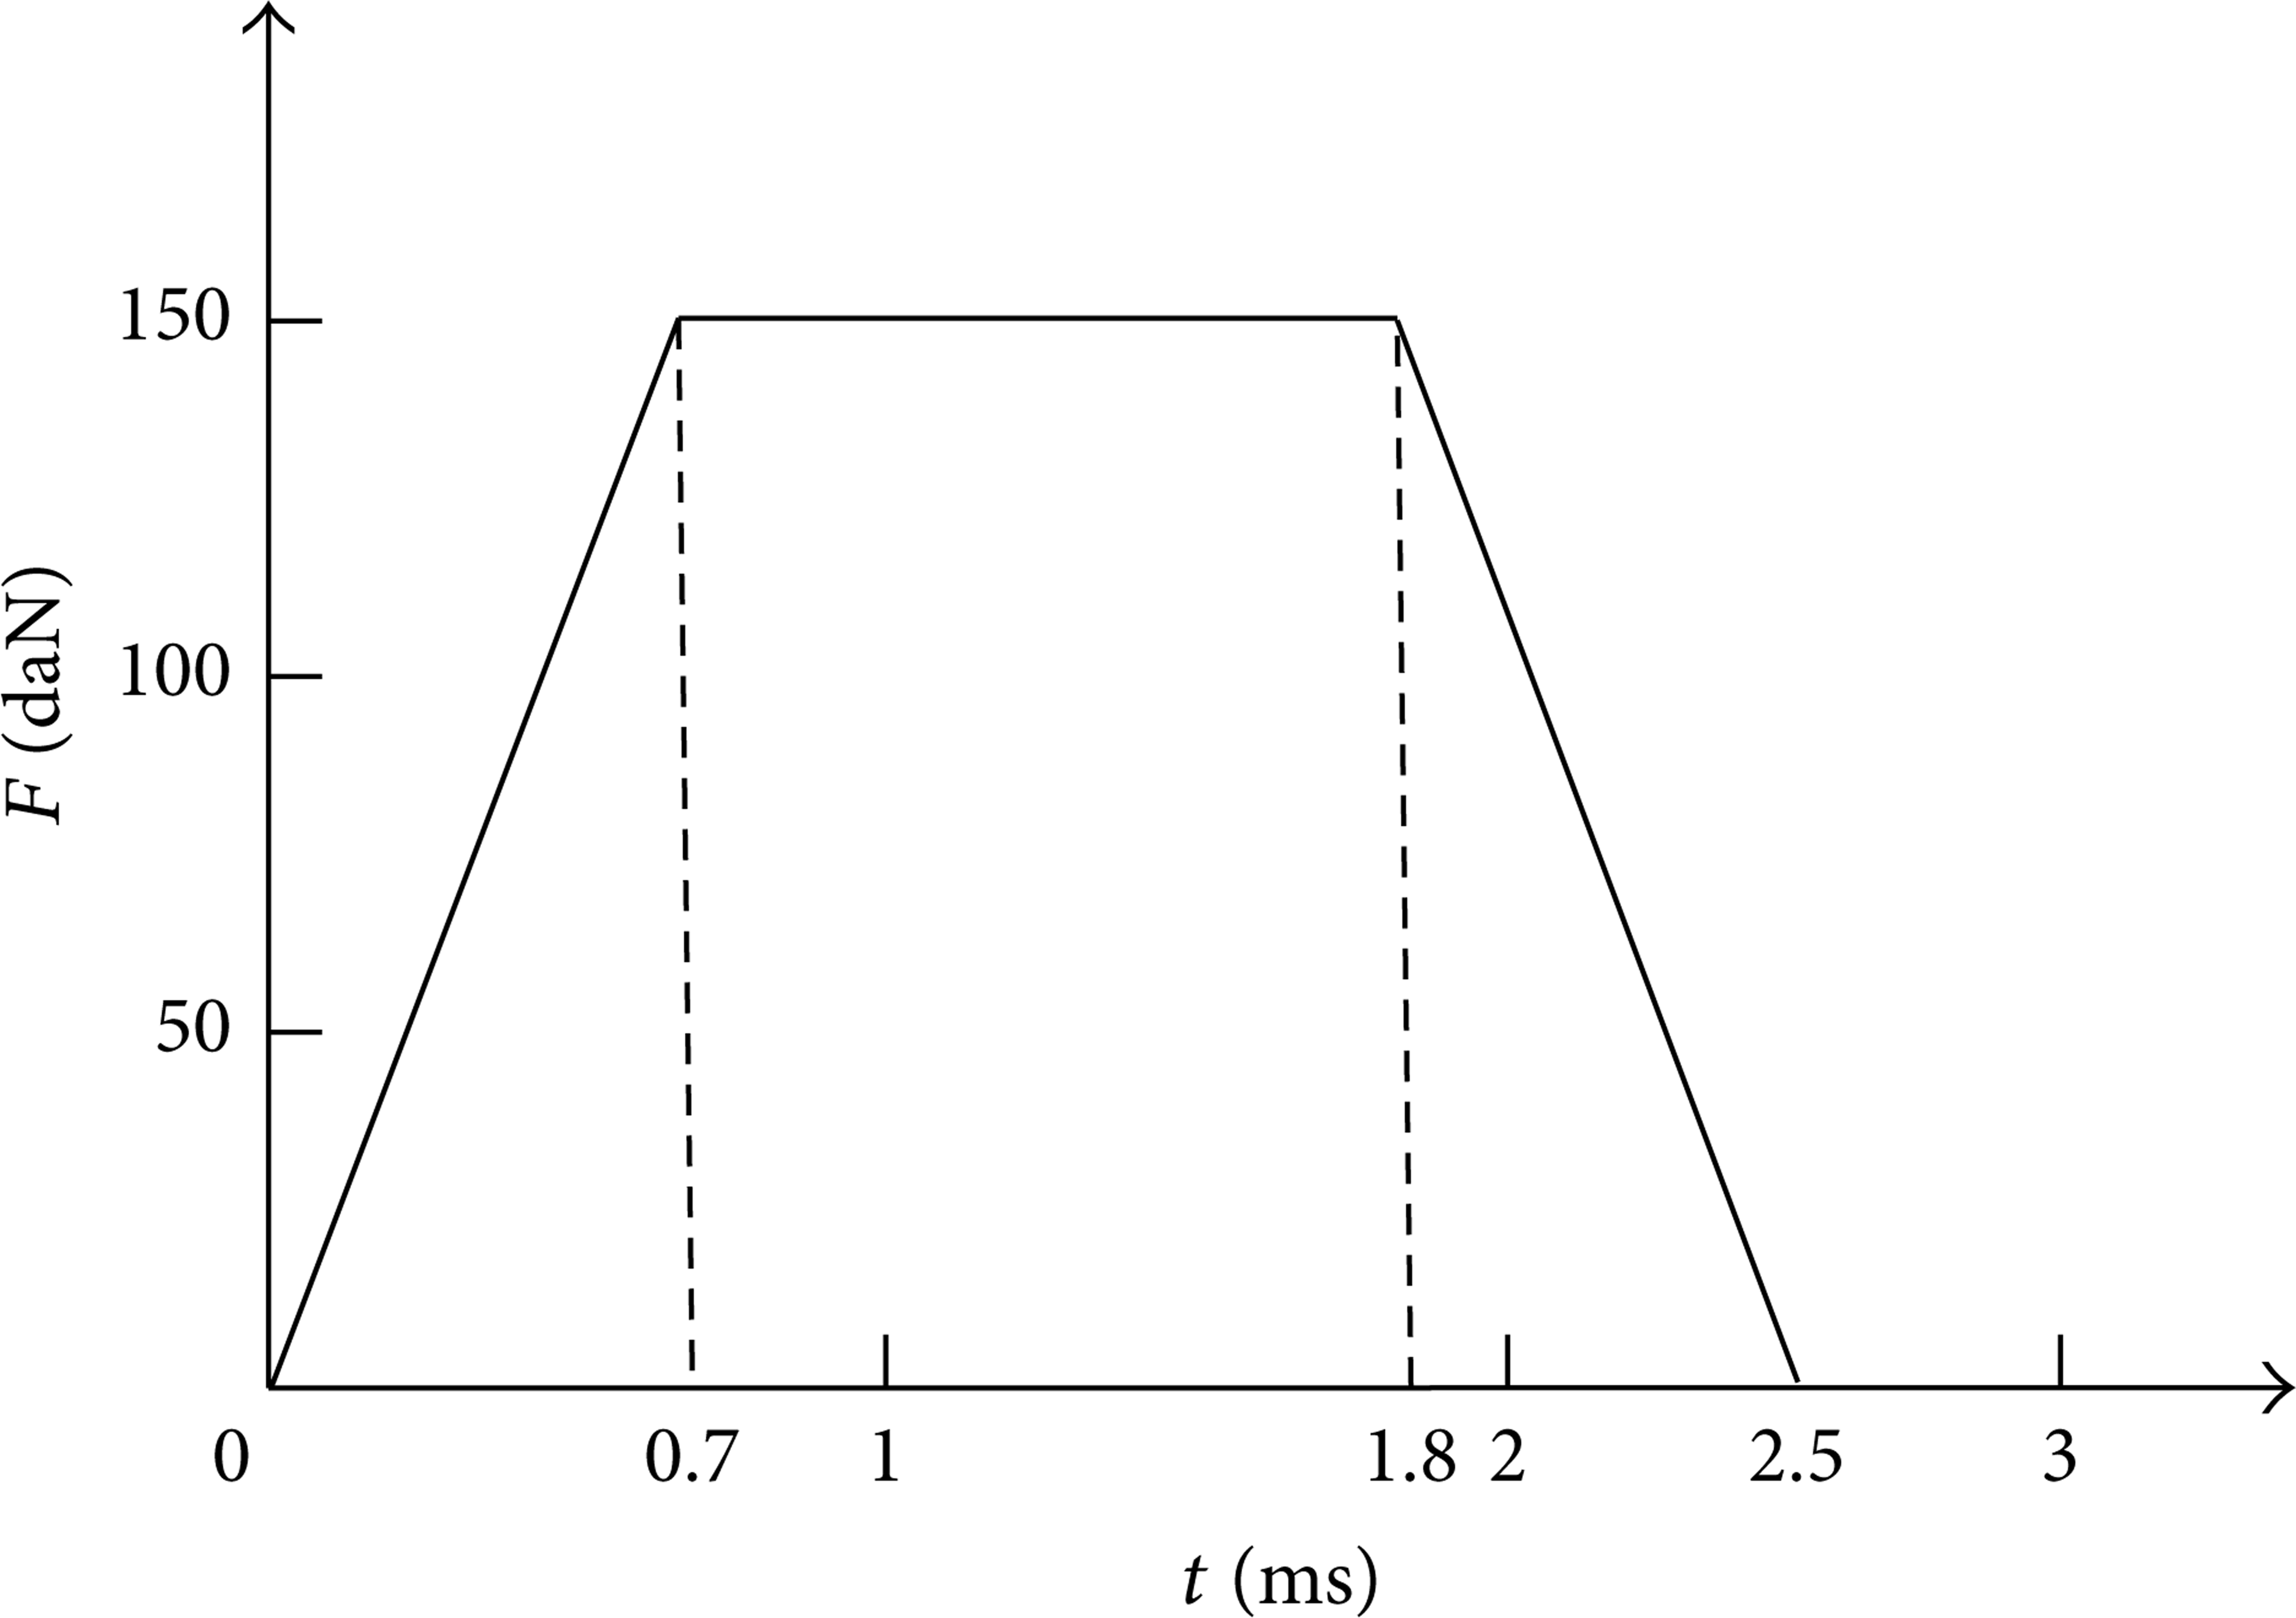
Input brake force curve for the static calibration instrument.
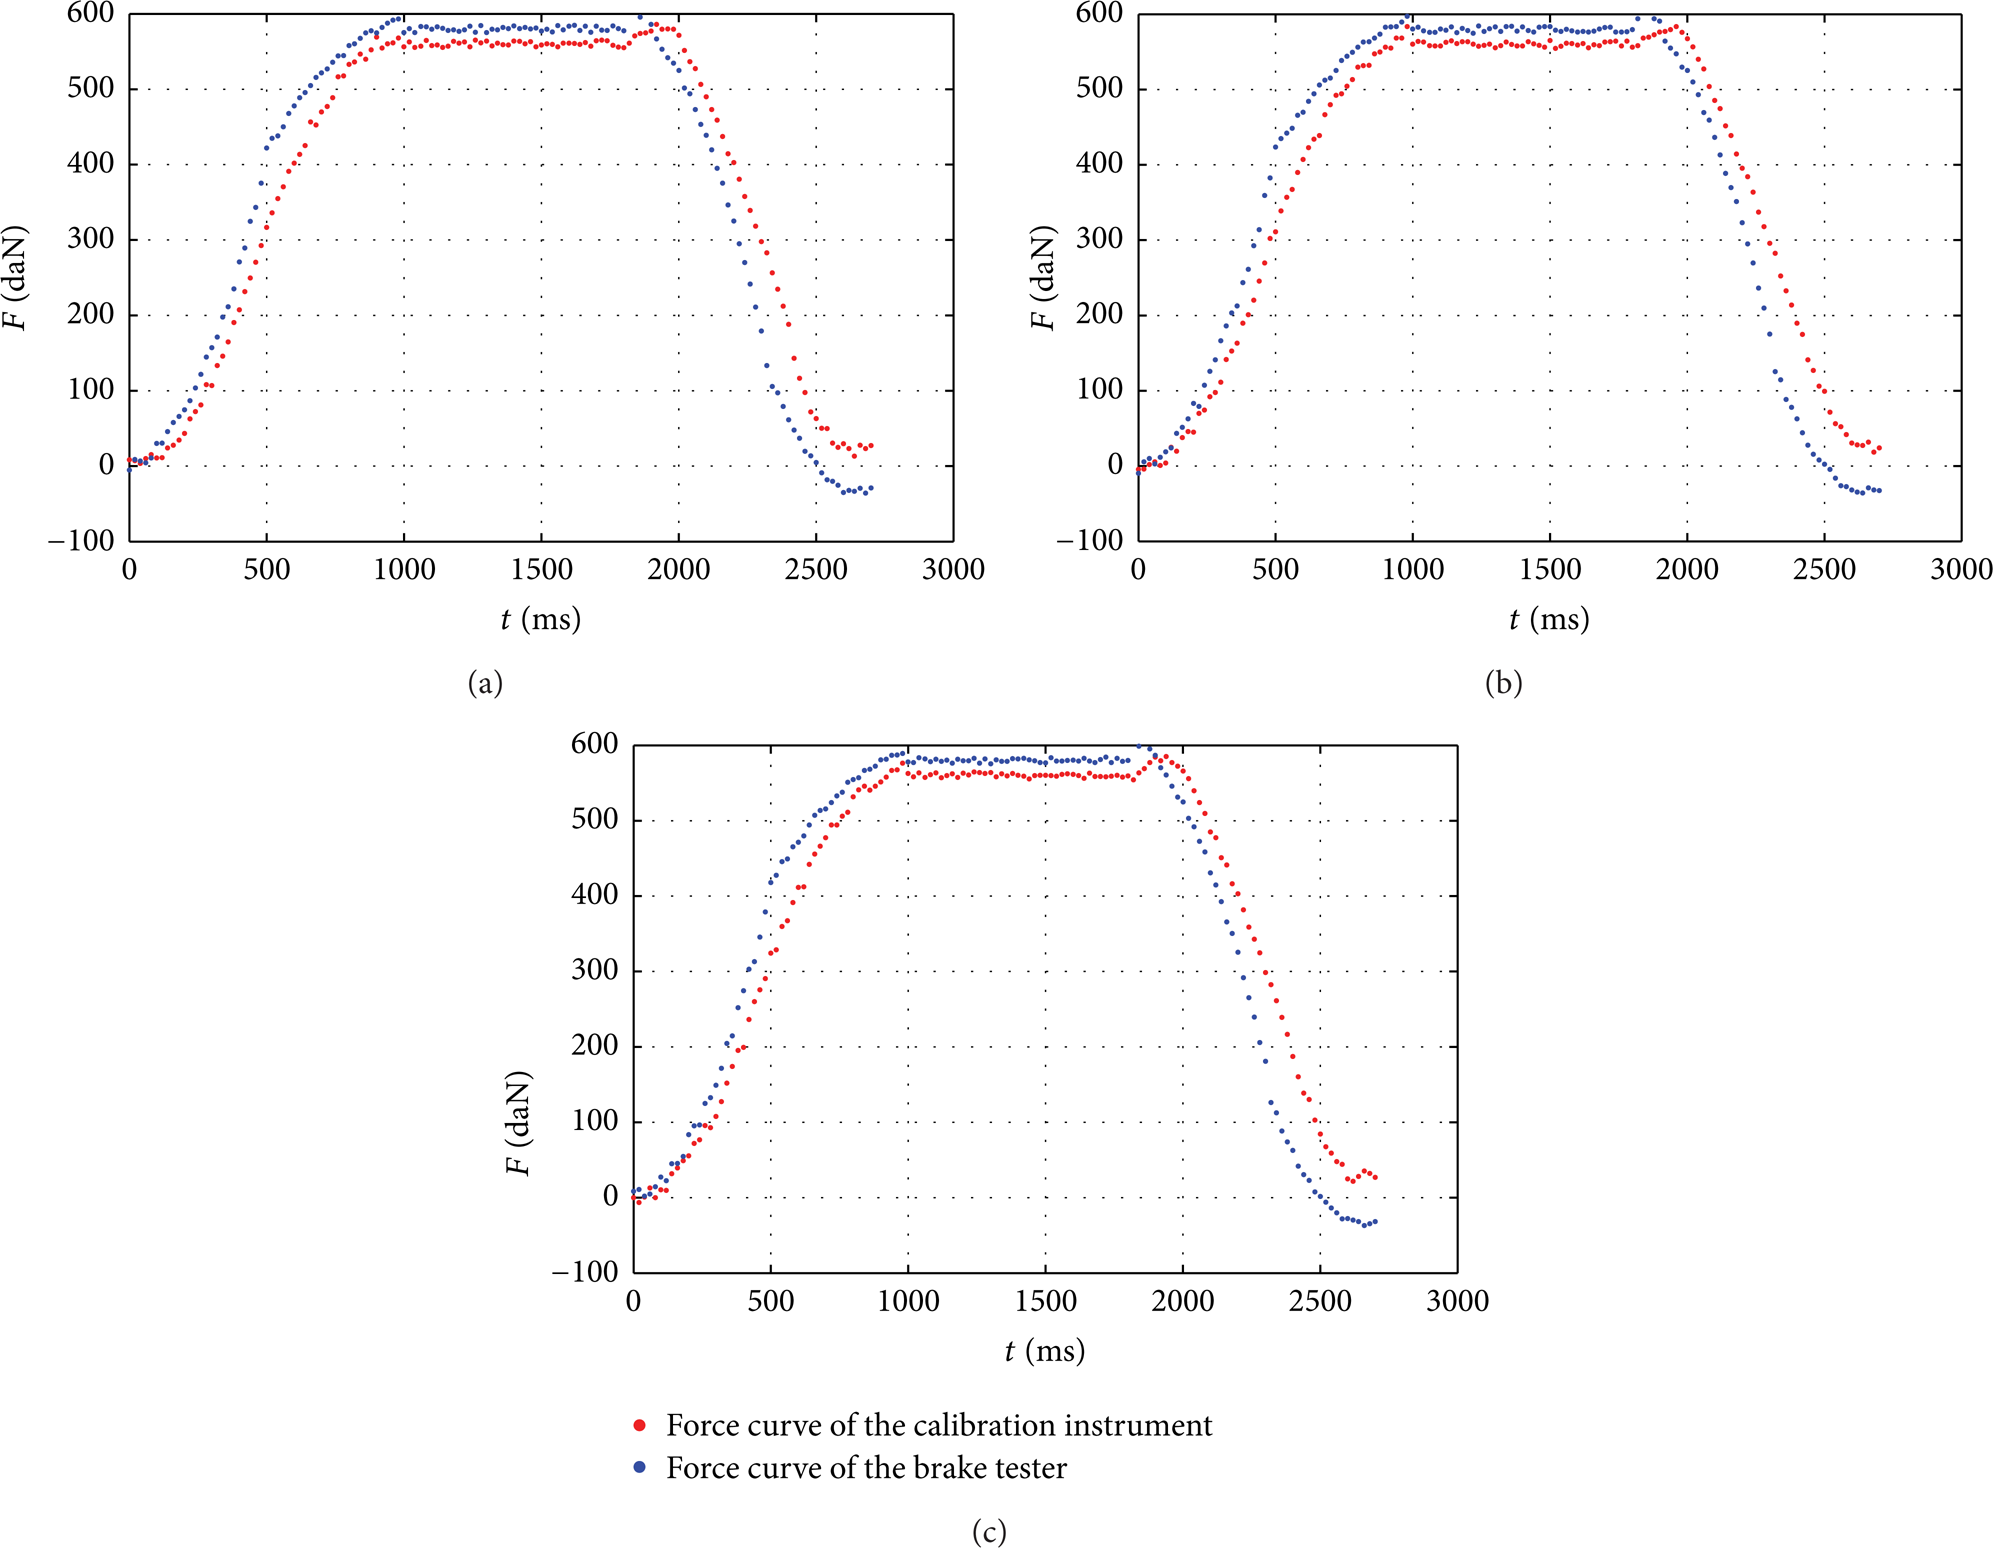
Experimental results of the left bench. (a) Force curve of the calibration instrument and force curve of the brake tester at the first time. (b) Force curve of the calibration instrument and force curve of the brake tester at the second time. (c) Force curve of the calibration instrument and force curve of the brake tester at the third time.

Experimental results of the right bench. (a) Force curve of the calibration instrument and force curve of the brake tester at the first time. (b) Force curve of the calibration instrument and force curve of the brake tester at the second time. (c) Force curve of the calibration instrument and force curve of the brake tester at the third time.
The calibration curve tracks the benchmark curve in Figure 4 in three braking stages well while the tester curve shows the obvious delay on the increasing part and decreasing part. The tester curve maintains a constant lower value with the calibration curve in the middle stage which is an approximate static calibration because the input brake force is a constant. Considering the tester repeatability, the data describe maximum errors of 8.9% for the left bench and 10.4% for the right bench in the force increasing stage. Furthermore, the larger errors exist in the beginning of the brake process when the inertia of the mechanical system including rollers and vehicle body should be overcome. The dynamic calibration results prove that the brake tester which agrees with the static calibration standard is unavailable according to the dynamic calibration.
5. Dynamic Calibration Discussions
Vehicle brake process is a typical dynamic process. The brake force curve of an on-road vehicle wheel consists of three phases which correspond to the initial growing phase of brake force, continuous braking in the middle, and the final decreasing stage of break force, respectively. In a brake force test, a vehicle wheel rotates on two test rollers. The active roller drives the wheel to rotate at a constant speed of 5 km/h. When the driver presses the brake pedal, the wheel brake force is transferred to the active roller which is connected to a floating reducer, a floating electric motor, and a floating measurement lever. The measurement lever presses on a stationary force sensor which sends the force signal to an independent tester meter. A measured standard force curve which is used to simulate the brake process can be added onto the reducer through the calibration instrument directly. The errors between calibration curve and the brake tester curve describe the dynamic error of the brake tester. The total time of brake process is often within 3 s. Therefore, the long transmission chain mentioned above affects the measurement curve. When the wheel brake force transfers to the active roller, the active roller receives a force which is opposite to the rotational direction and stops rotating quickly. However, the total inertia of the roller, the reducer, the electric motor, and the measurement lever puts off the force delivery process which is from the roller to the force sensor. The roller vibration also has effects on the measurement curve. The measurement mechanism of the calibration instrument is connected onto the reducer of the brake tester directly. When the measured signal transfers from the force sensor to the meter, the signal is filtered and smoothed to obtain the final brake force curve. This process is the factor to cause the lower test value than the calibration curve. The consequence of the static method is that a qualified vehicle with normal brake force may fail in a brake test because the tester provides a lower value of brake force.
6. Conclusions
To evaluate the measurement performance of roller tester for brake force, a comparing research is conducted to verify the credibility of the static calibration with the dynamic calibration method. The novel calibration instrument with high response ability is created to reproduce and track the input force curve promptly. Three essential tester parameters of the brake force error of a single bench, the brake force error between the left and right benches, and the measurement repeatability of the brake tester are estimated in the static calibration experiments following the national standard requirements. The results of the inspected brake tester provide a maximal error of 2.55% for a single bench, 2.25% for the difference of left and right benches, and 1.5% for the repeatability. All three parameters are in line with the national standard which is based on the static calibration.
For exploring the dynamic performances of the brake tester, a typical brake curve with three sections, the first line segment rising from 0 s to 0.7 s which imitates the initial increasing brake, the middle level part from 0.7 s to 1.8 s to simulate the retaining process of the brake force, and the final line from 1.8 s to 2.5 s indicating the reducing procedure of the brake force, is applied to the same brake tester for the static calibration. The experiment results show that the force curve of the calibration instrument synchronizes with the standard force curve well. The output curve of the tester is delayed in the first and the final brake stages. The highest error up to 10.4% is observed in the repeatability experiment to drive the inertia of the mechanism. The experiments prove that it is important to perform the dynamic calibration on the brake tester to enhance the dynamic measurement performance in practical applications.
Conflict of Interests
The authors declare that there is no conflict of interests regarding the publication of this paper.
Footnotes
Acknowledgments
Appreciation is presented to the National Natural Science Foundation of China under Grant no. 51205164, China Postdoctoral Science Foundations with Grant no. 2013M530139, Jilin Province Science Foundation for Youths, under Grant no. 20130522154JH, and Training Plan of Jilin University for National Science Foundation for Excellent Youths.