
Abstract
Pressure fluctuations are the main factors that can give rise to reliability problems in centrifugal pumps. The periodically unsteady pressure characteristics caused by rotor-stator interaction have been investigated by CFD calculation in a residual heat removal pump. Side chamber flow effect is also considered for the simulation to accurately predict the flow in whole flow passage. The pressure fluctuation results in time and frequency domains were considered for several typical monitoring points in impeller and diffuser channels. In addition, the pressure fluctuation intensity coefficient (PFIC) based on standard deviation was defined on each grid node for entire space and impeller revolution period. The results show that strong pressure fluctuation intensity can be found in the gap between impeller and diffuser. As a source, the fluctuation can spread to the upstream and downstream flow channels as well as the side chamber channels. Meanwhile, strong pressure fluctuation intensity can be found in the discharge tube of the circular casing. In addition, the obvious influence of operational flow rate on the PFIC distribution can be found. The analysis indicates that the pressure fluctuations in the aspects of both frequency and intensity can be used to comprehensively evaluate the unsteady pressure characteristics in centrifugal pumps.
1. Introduction
Centrifugal pumps, as essential energy-conversion and fluid-transporting devices, have been widely used in industry, agriculture, ship propulsion, and daily life [1]. Owing to the rotor-stator interaction between the asymmetric structure of the volute and the high-speed rotating impeller as well as a highly viscous fluid, the operation of centrifugal pumps can generate instability and pressure fluctuations [2]. When the power of centrifugal pump becomes higher and higher, the severer stability problems of centrifugal pump caused by unsteady pressure phenomenon should be noticed, especially in the application field of high risk industry.
Generally, pressure fluctuations cannot be avoided entirely even at the design operating condition. The rotor-stator interaction in a centrifugal pump usually causes pressure fluctuations in the flow passage, which excites mechanical vibrations of the pump. At off-design operating conditions, further phenomena are superposed to the rotor-stator interaction effects and increase vibration levels which may adversely affect the machine's operational safety [3]. In the past, many analytical and experimental investigations have been carried out, and the fast Fourier transform (FFT) method has been the most powerful tool used to unveil the frequency characteristics of pressure fluctuations. Toussaint et al. [4] experimentally investigated the unsteady flow in a centrifugal pump at off-design operating conditions and concluded that the pressure fluctuations took place at rotation frequency, blade passing frequency, and their harmonics. Wang and Tsukamoto [5] conducted an experimental and numerical study on the unsteady phenomena at the off-design conditions of a diffuser pump. The results of unsteady flow at partial discharge range showed an asymmetrical separation bubble near the pressure surface of the impeller vane. The intermittence of the separation bubble may be the main factor to cause the unstable characteristics of the test diffuser pump. And a rotating stall in the impeller passage as well as in the diffuser passage was presented at lower partial discharge range, which can be the main cause of unstable characteristics. Barrio et al. [6] presented a study on the fluid-dynamic pulsations in a centrifugal pump with different radial gap between the impeller and the volute. For a given impeller diameter, the dynamic load increased for off-design conditions, especially for the low range of flow rates, whereas the progressive reduction of the impeller-tongue gap brought about corresponding increments in dynamic load. Cong et al. [7] carried out a numerical simulation about the pressure fluctuations near the volute tongue of a double-suction centrifugal pump and showed that the blade passing frequency dominated the pressure fluctuations near the volute tongue at the design and large flow rate conditions. At small flow rate condition, the frequency which was lower than the blade passing frequency became dominant in the pressure fluctuations. Benra et al. [8] calculated the transient flow in an industrial radial pump stage with all the blades by CFX for design operating point. Experimental work was carried out by Feng et al. [9] to investigate the unsteady flow in a low specific speed radial diffuser pump using LDV and PIV techniques. The phase-averaged velocity field, turbulence field and the blade orientation effects were quantitatively examined in detail. Some other research works [10–20] can be also found for the study of pressure fluctuation caused by periodical unsteady flow in centrifugal pumps.
In reality, especially in some high risk applications in which the stability of centrifugal pump is the most important, the circular casing structure has been adopted to increase the reliability of overall structure of the high power pump. Because of this special circular casing structure, the unsteady flow phenomenon in the whole flow channel, like pressure fluctuation distribution, may become more complex than other centrifugal pumps with volute. In the literature, there is little published about CFD prediction and analysis focusing on the unsteady pressure field to evaluate the transient pressure variation in this kind of high power centrifugal diffuser pump with special circular casing. In this paper, a numerical analysis of the periodically unsteady pressure field was carried out by solving 3D URANS equations in the whole flow passage of the pump. Not only were the pressure fluctuation results in time and frequency domains considered, but also the strength of pressure fluctuations based on standard deviation method was analyzed quantitatively.
2. Pump Model
The model pump investigated is a high power residual heat removal pump (RHRP) which is used to deliver reactor coolant flow through the residual heat exchangers to meet the plant cooling requirements in nuclear power plant. The pump design process should consider the safety, lifespan, and nonoverload performance. Figure 1 shows the 3D modeling of the pump and the structure configuration of the hydraulic components and the relative positions between rotating and stationary components are shown. Figure 2 shows the actual pump impeller and diffuser. The main parameters of the pump are listed in Table 1.
Main geometric parameters of the pump.


3D modeling of the pump.
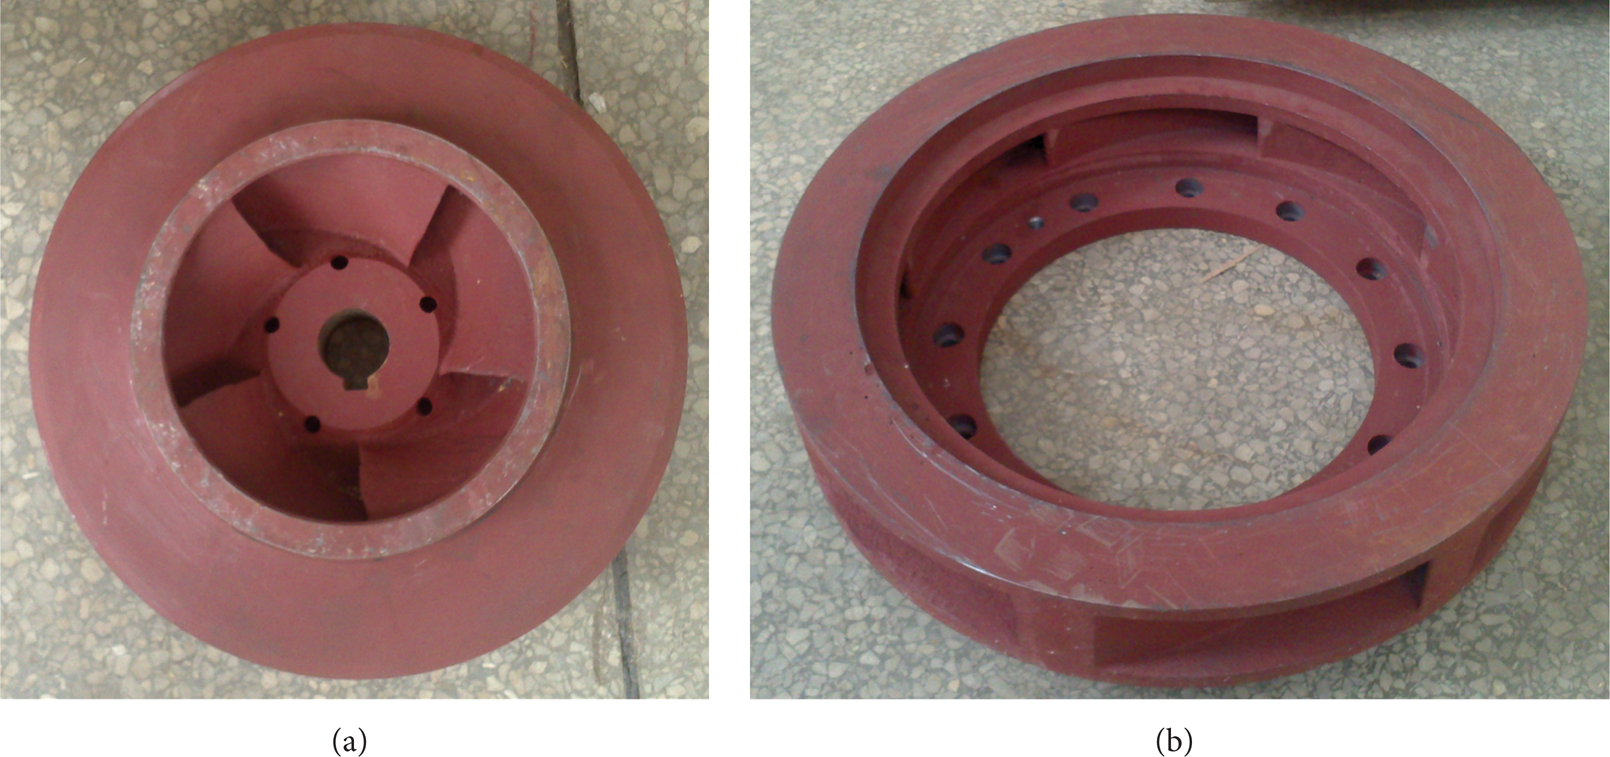
Actual objects of the impeller and diffuser.
3. Numerical Solution Approach
3.1. Mathematical Model
The internal flow of centrifugal pump is a three-dimensional, viscous, and unsteady turbulent flow; therefore, 3D Reynolds averaged Navier-Stokes equations are considered. The mass conservation equation and momentum conservation equation for incompressible fluid are as follows:

where μ is dynamic viscosity, F
i
is source item, and
The shear stress transport (SST) turbulence model by Menter [21] is chosen to enclose the equations. The SST model is a modified k − ω turbulence model and is a hybrid model of k − ω and k − ε turbulence models which can switch automatically in between near-wall area and main flow area. Transport equations for k and ω are as follows:

The turbulence viscosity is calculated by the following equations:
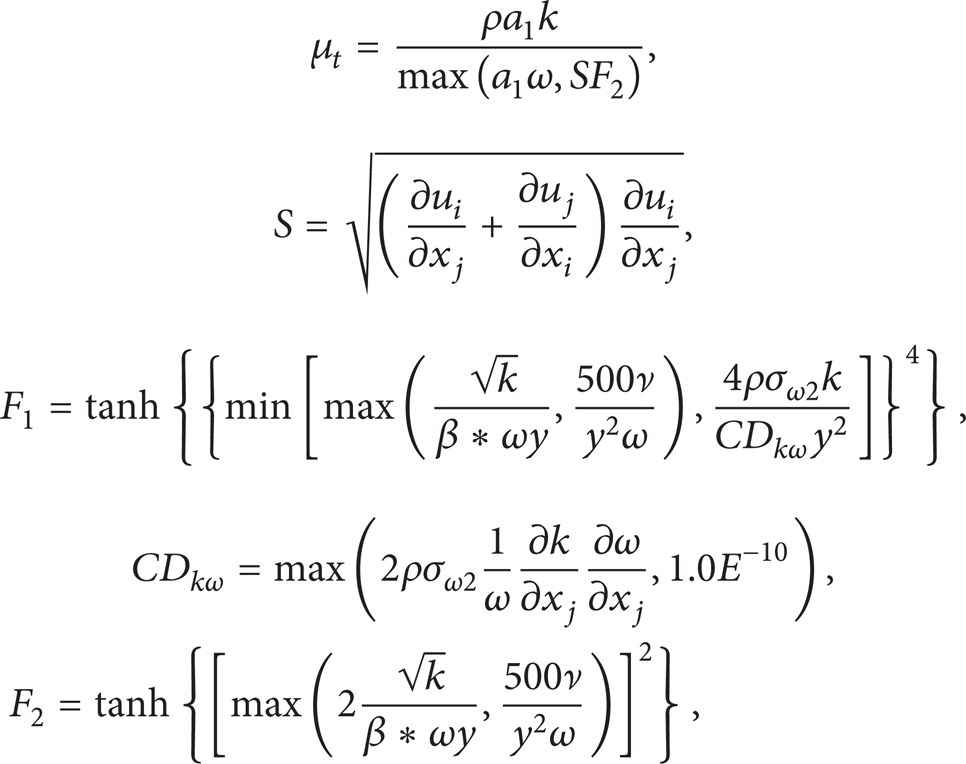
where coefficients are as follows: β* = 0.09, a1 = 5/9, β1 = 3/40, σk1 = 2, σω1 = 2, a2 = 0.44, β2 = 0.0828, σk2 = 1, and σω2 = 0.856.
3.2. Calculation Grid and Conditions
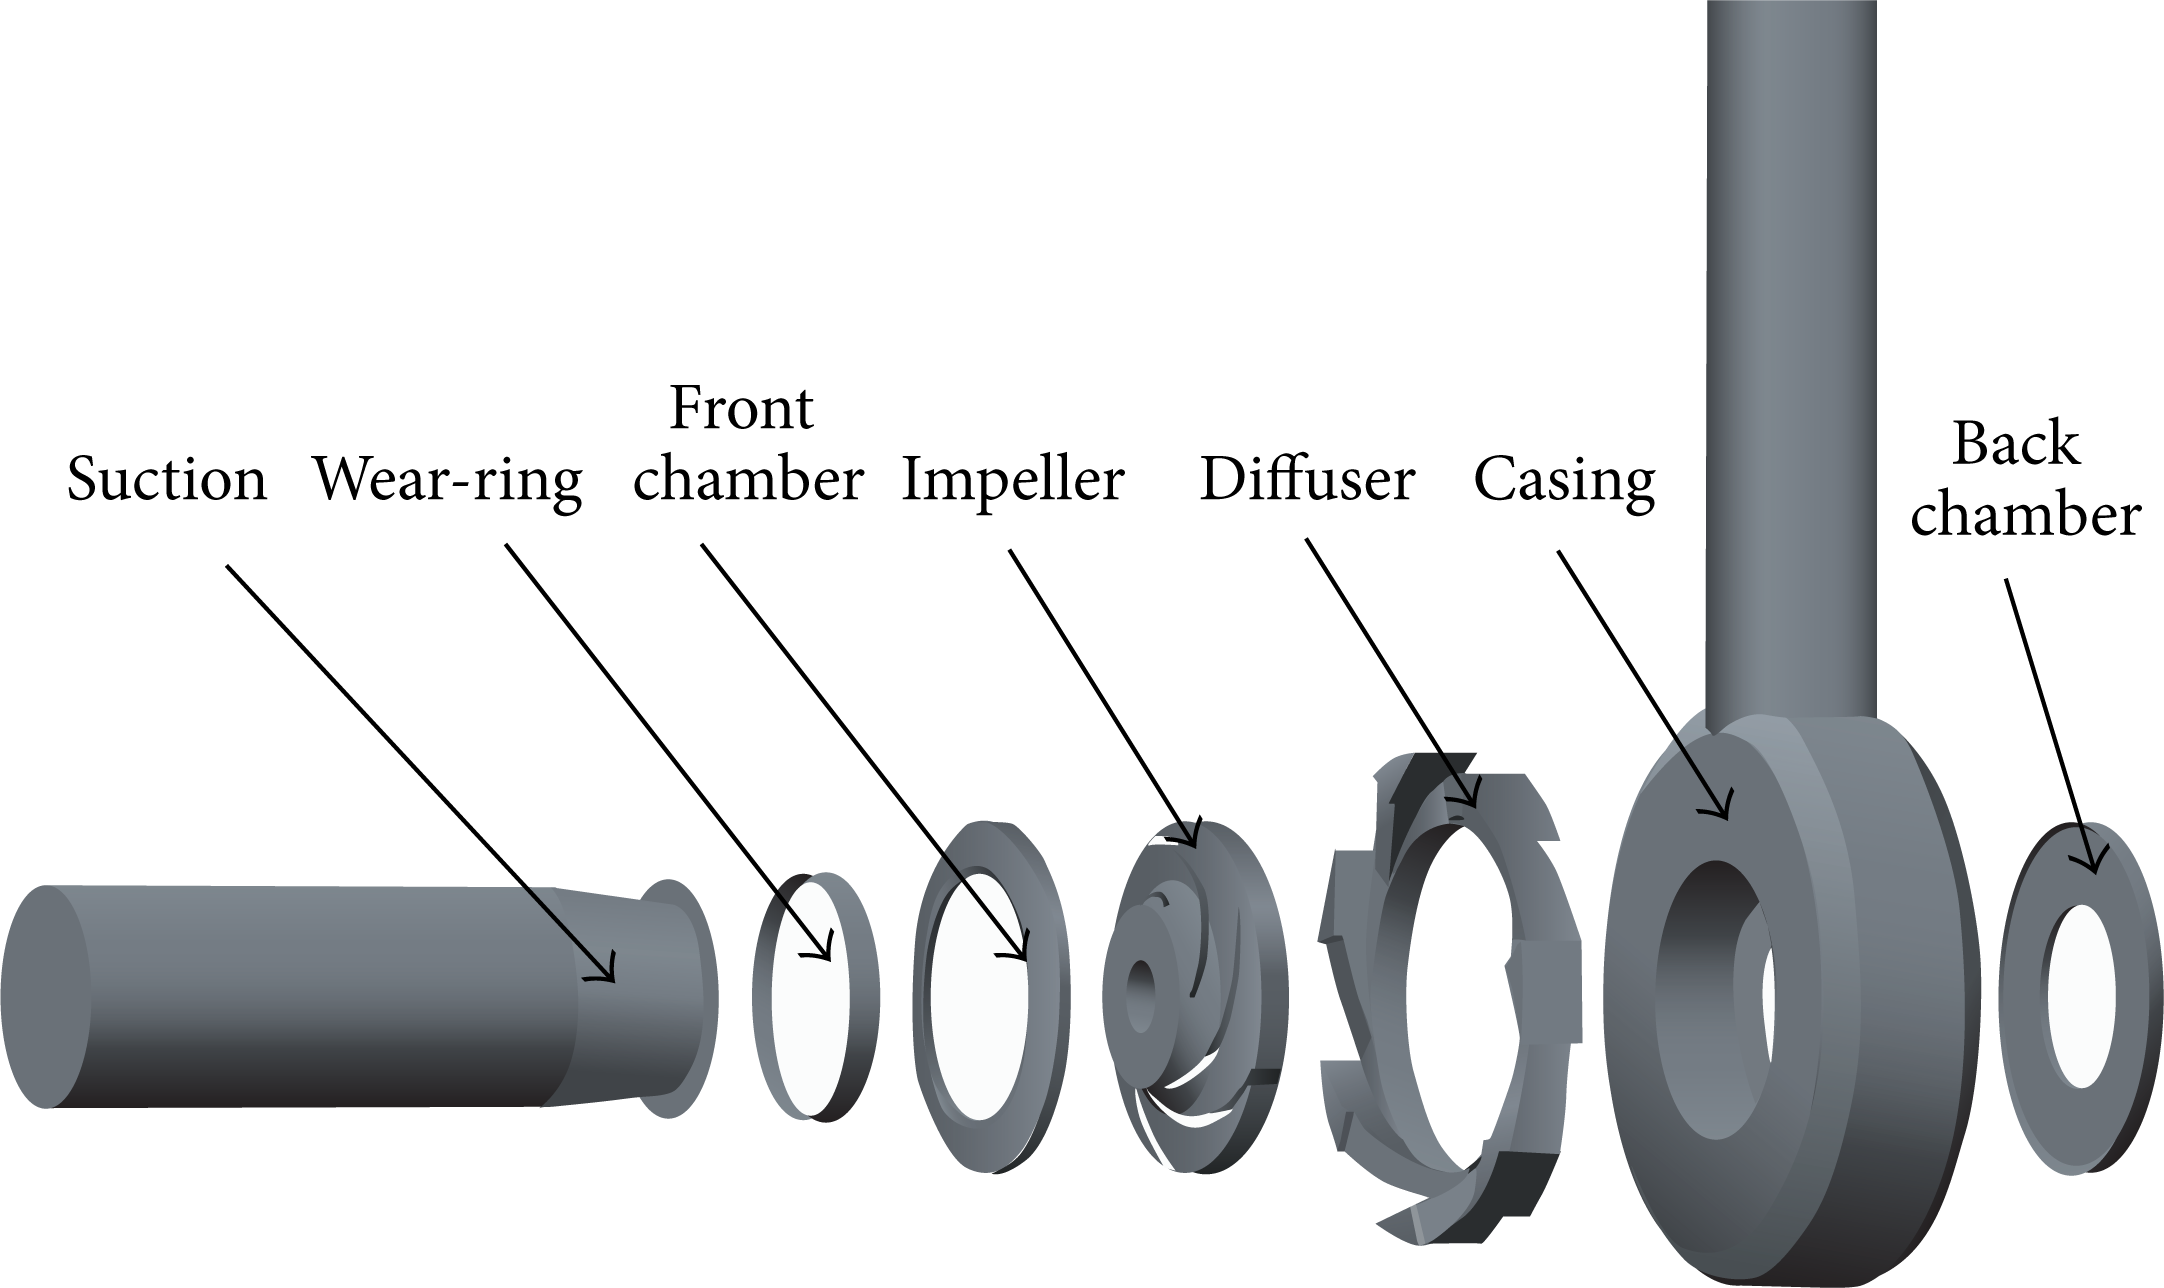
The pump was divided into component parts such as impeller, diffuser, suction inlet, wear-ring, side chamber, and circular casing to build a numerical model for the complete pump, as shown in Figure 3. This process would allow each mesh to be individually generated and tailored to the flow requirements in that particular component. The influence of boundary conditions was investigated to discard any effect on the numerical results and to verify the capabilities of the model.
Calculation domain.
The grids for the computational domains were generated using the grid generation tool ICEM-CFD with blocking method. The grid details in the rotating domain and the casing are partially shown in Figure 4. The independence of the solutions from the number of grid elements was proven by simulating the flow field with different numbers of grid nodes, and the results are shown in Figure 5. Therefore, the resulting pump model consisted of 5.83 million nodes for rotating and stationary domains in total. The maximum nondimensional wall distance y+ < 85 was obtained in the complete flow field, which could satisfy the requirement of all turbulence modeling methods used in this paper. In this case, the numerical uncertainty in the fine-grid solution should be reported as 3.46%. For temporal discretization, the time step size for unsteady flow was set to 3.35571 × 10⁻⁴ seconds, equivalent to the time for the impeller to rotate at 3 degrees. The total simulation time is for the impeller rotating 9 revolutions, and the flow field was statically stable after 5 revolutions. The 9th revolution of the impeller was used for results analysis when the right periodicity of the flow can be shown.

Computational grid.
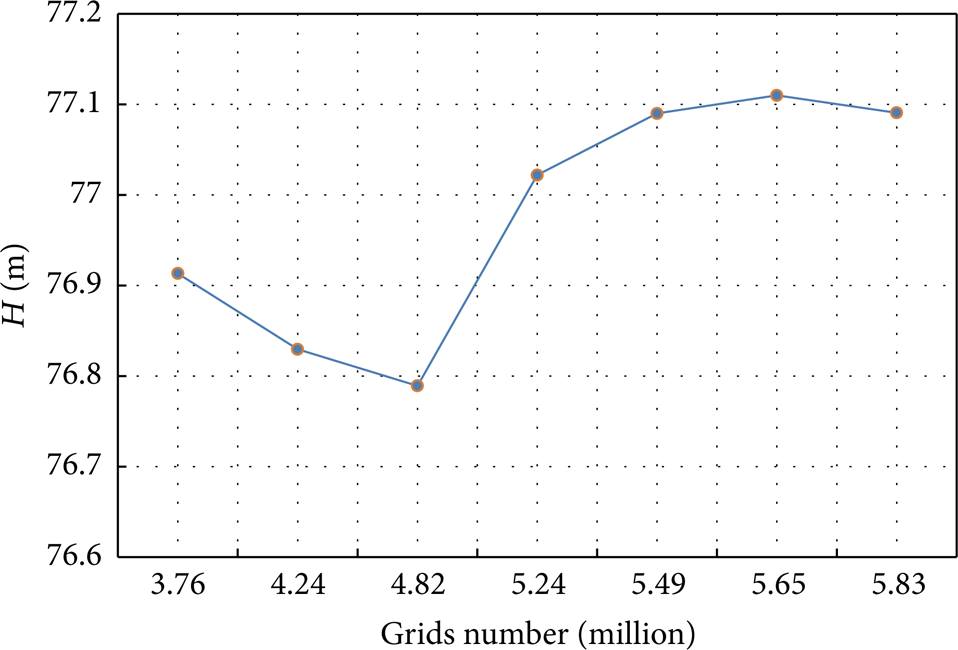
Mesh independence analysis.
3.3. Definition of Pressure Fluctuations
In order to determine the transient pressure variations and the strength of pressure fluctuations in the model pump, several indicator variables need to be selected. In addition, when the results are reported, it is common to present the pressure fluctuations in normalized form to allow the scaling of pressure pulsation data with respect to size and speed. Therefore, nondimensional pressure coefficients are finally defined and adopted for numerical fluctuation results in this paper.
It should be mentioned that, for the transient simulations obtained by URANS equations, the pressure fluctuation components are only the phase-averaged values which are highly periodic on each grid node in the whole computational domain, and no instantaneous fluctuating pressure components are obtained. Therefore, the periodically unsteady pressure p at a grid node can be decomposed into two parts: the time-averaged pressure

Therefore, to determine the magnitude of the pressure fluctuations for an entire revolution period, a nondimensional pressure fluctuation intensity coefficient (PFIC) C P * is defined:

and it is calculated by the standard deviation of the unsteady pressure normalized by the dynamic pressure based on the impeller tip speed U2. Here, N represents the sample number during one revolution period and t0 is the starting time for one period of transient simulation.
Furthermore, a time-dependent nondimensional pressure coefficient C P is also defined to evaluate the periodic pressure as the function of time and impeller rotation position as follows:

3.4. Pump Performance Prediction
The original model pump was tested in the open test rig in the lab, whose testing precision is superior to the national grade 1, as shown in Figure 6, and the performance curve is measured by the relevant measurement requirements. The pressure in the inlet and outlet is measured by the pressure sensor, both of whose precision is 0.1%. The flow rates are measured by the LWGY-200A turbine flow meter with 0.5% measurement error. The way of hydraulic performance calculation can be found in [24], and the calculation results are from unsteady simulation results for accurate prediction.

The open test rig.
Figure 7 shows the comparison between calculated and measured performance curves of the pump, and good agreement can be observed while about 4% deviation can be seen for small flow rate condition.
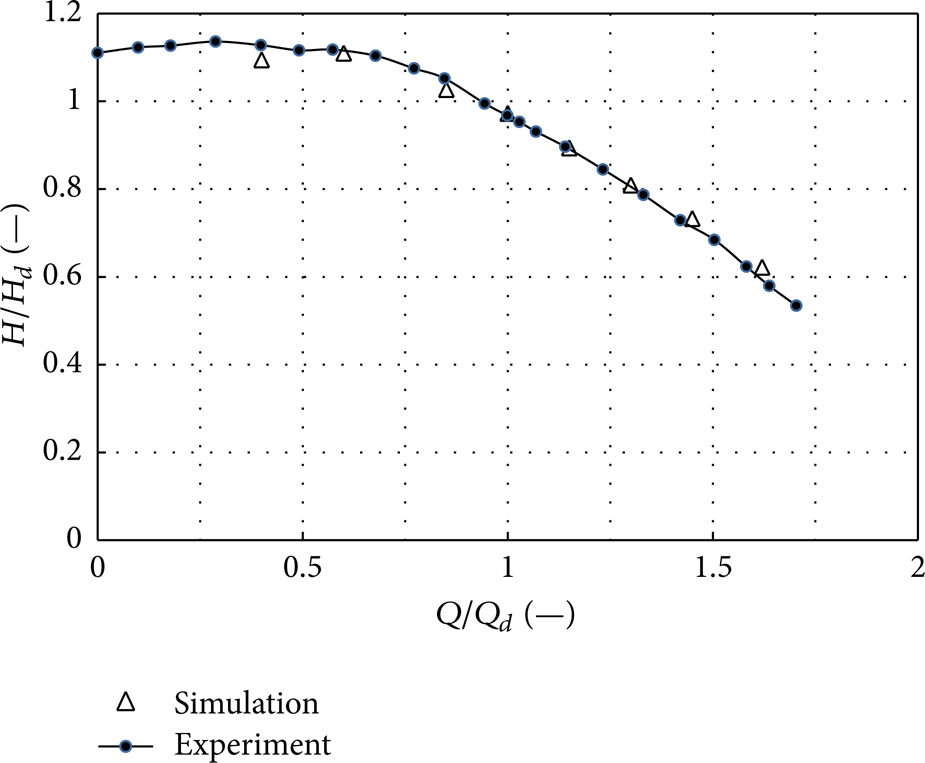
Comparison of predicted and measured performance curves.
4. Results and Discussions
4.1. Unsteady Pressure Distribution due to Impeller Rotating Positions
Time-dependent results of pressure distributions in the model pump are analyzed in this section as the function of impeller rotating position.
Figure 8 shows the pressure distributions in the impeller and diffuser channels at middle height under Q des , and the rotating angle θ was defined to show the impeller rotating positions. Four pressure distribution results were shown from θ = 0° to θ = 54° to indicate the pressure variations for a duration that an impeller blade passes by a diffuser channel. The results show that almost the same pressure distribution laws in the impeller and diffuser channels can be found for every rotating position except the area near blade trailing edge and diffuser vane leading edge. When these two parts are far away from each other as shown in Figures 8(b) and 8(d), relatively large pressure results can be observed around them. When the two parts are close to each other as shown in Figures 8(a) and 8(c), however, obvious low pressure can be obtained in the small gap between blade trailing edge and vane leading edge. Although the above obvious pressure variations can be noticed in the gap between impeller blades and diffuser vanes for different time points, the variation extent cannot be easily indicated quantitatively in this way. Therefore, a new pressure fluctuation intensity analysis method will be used for this case, and the results will be discussed in the next section.
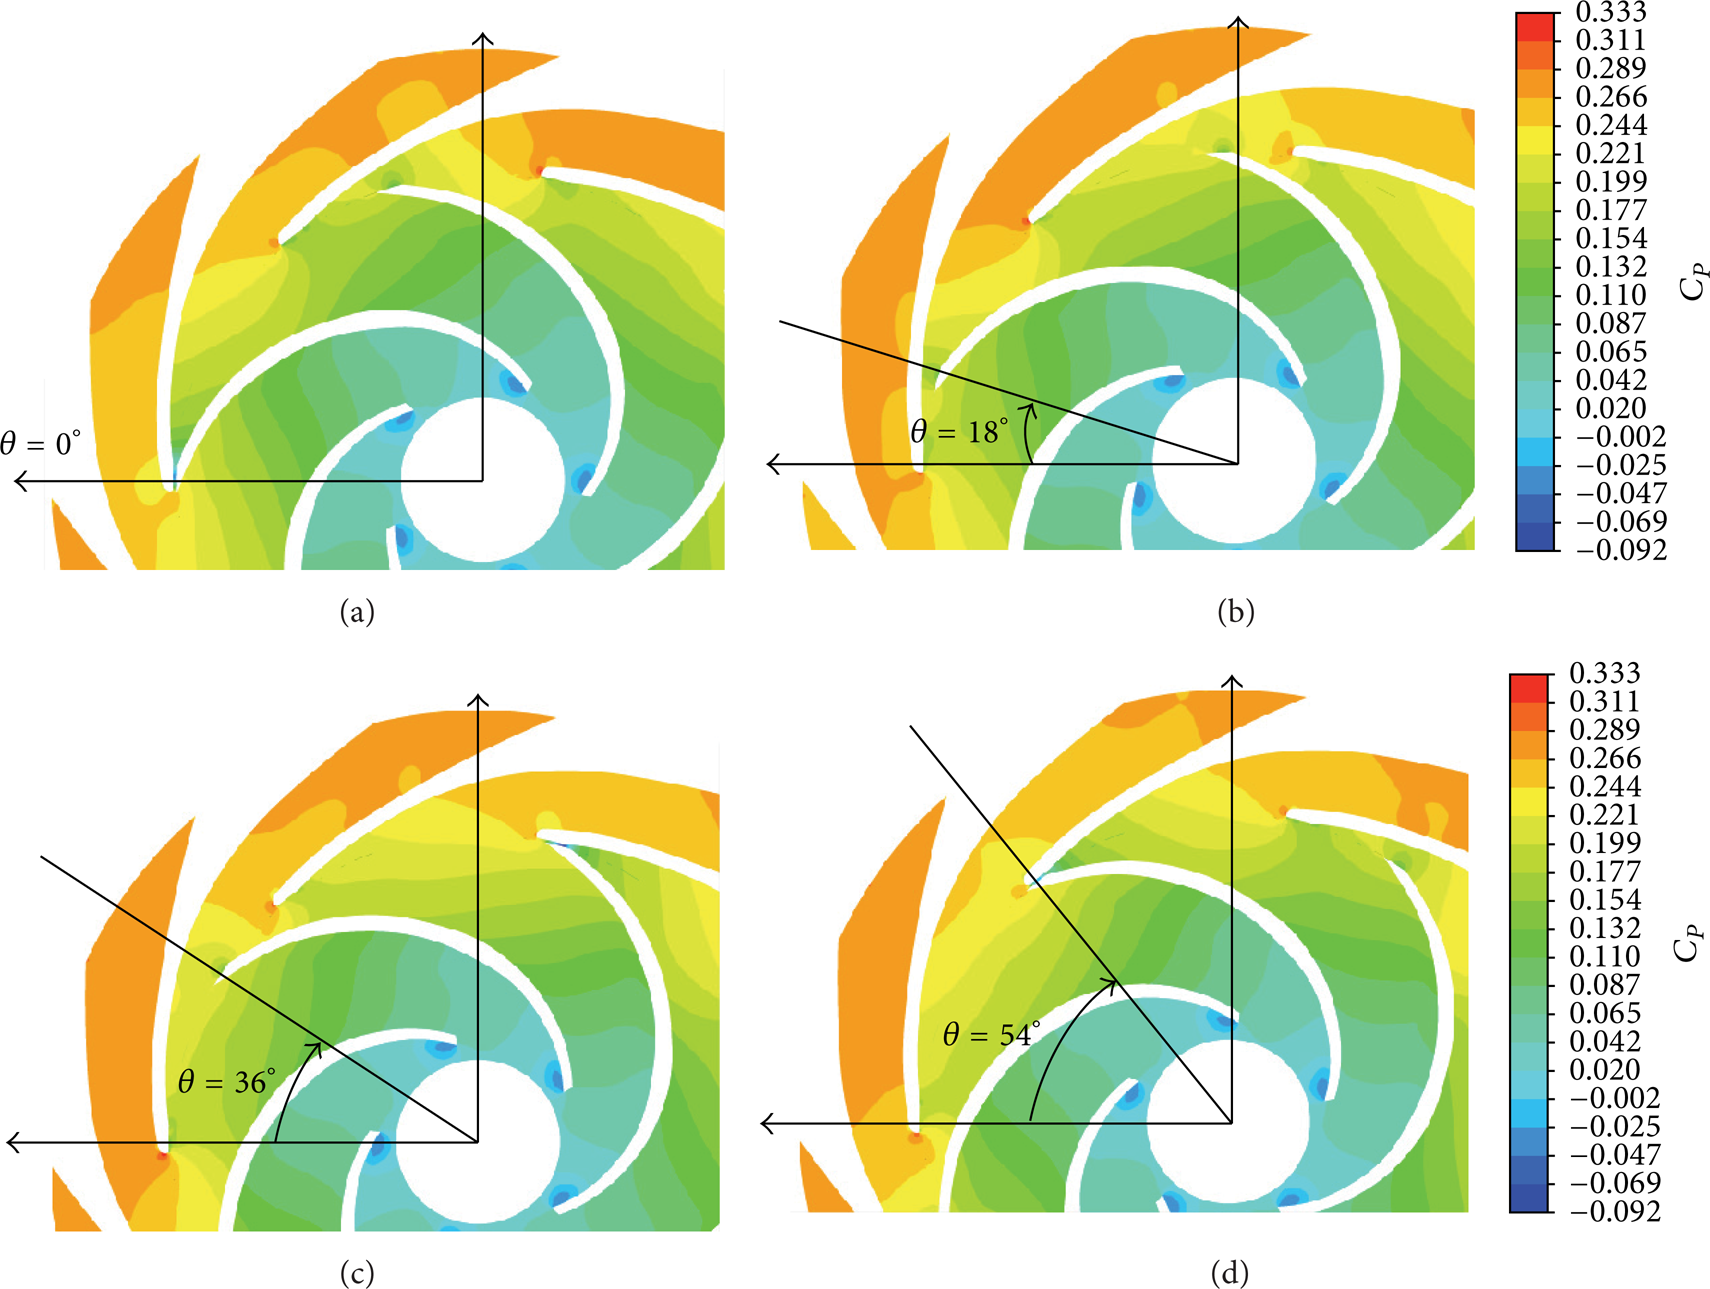
Pressure distributions in the impeller and diffuser channels at middle height for multi-impeller rotating positions under Q des condition: (a) results for θ = 0°, (b) results for θ = 18°, (c) results for θ = 36°, and (d) results for θ = 54°.
For analyzing the pressure fluctuation characteristics in time and frequency domain with strong rotor-stator interaction, several typical monitoring points are defined in the gap and diffuser channel, as shown in Figure 9. P1 and P2 have the same radius and different circumferential positions, while monitoring points P2–P6 are on the middle streamline in the examined diffuser channel, and all the positions of monitoring points are in the absolute coordinate frame.

Monitoring points examined in the gap and diffuser channel.
Figure 10 shows the time-history results of pressure fluctuation on the monitoring points under Q des condition. The obvious periodicity of the fluctuation can be obtained, but the fluctuation extent is different because of the monitoring positions. On the point P1 which is near the vane leading edge, huge fluctuation, of which the peak-valley difference is more than 0.25, can be observed as discussed above. On the point P2, pressure fluctuation is smaller than on P1, and the peak-valley difference is about 0.075; that means, on the same radius in the gap between impeller and diffuser, pressure fluctuation far away from diffuser vane leading edge is much smaller. Monitoring points P3–P6 are in the diffuser channels, and although the averaged pressure values are bigger, the fluctuations of pressure are smaller on these points than on P1 and P2. In addition, the fluctuation is bigger when the monitoring point is closer to the gap area. The phases of pressure fluctuations on P1 and P2 are obviously different, while almost the same phase distributions can be found for monitoring points P3–P6 which are different from P1 and P2.
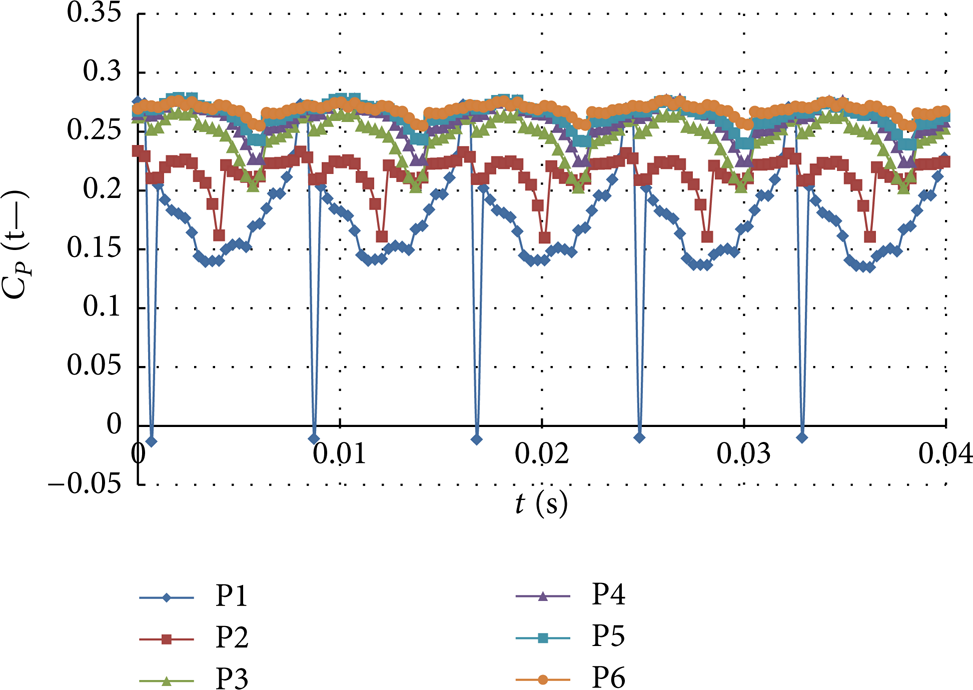
Time-history results of pressure fluctuation on the monitoring points under Q des condition.
To study the flow rate effect on the pressure fluctuation characteristics, the time-history results of pressure fluctuation on P1 point under variable conditions are shown in Figure 11, and dominant design flow rate (Q des ), large flow rate (1.62 Q des ), and small flow rate (0.6 Q des ) were considered. Relatively large pressure fluctuation with a peak-valley difference of 0.5 can be found for large flow rate, while it is not easy to read obvious fluctuation differences between the design condition and small flow rate condition from the results in time domain, because not obvious peak-valley difference can be observed for these two operating conditions. Therefore, to analyze the pressure fluctuation more deeply, the results in the angle of frequency domain should be stated, and the fluctuations with different frequency components can be studied, and then the main contributing fluctuation components can be recognized.
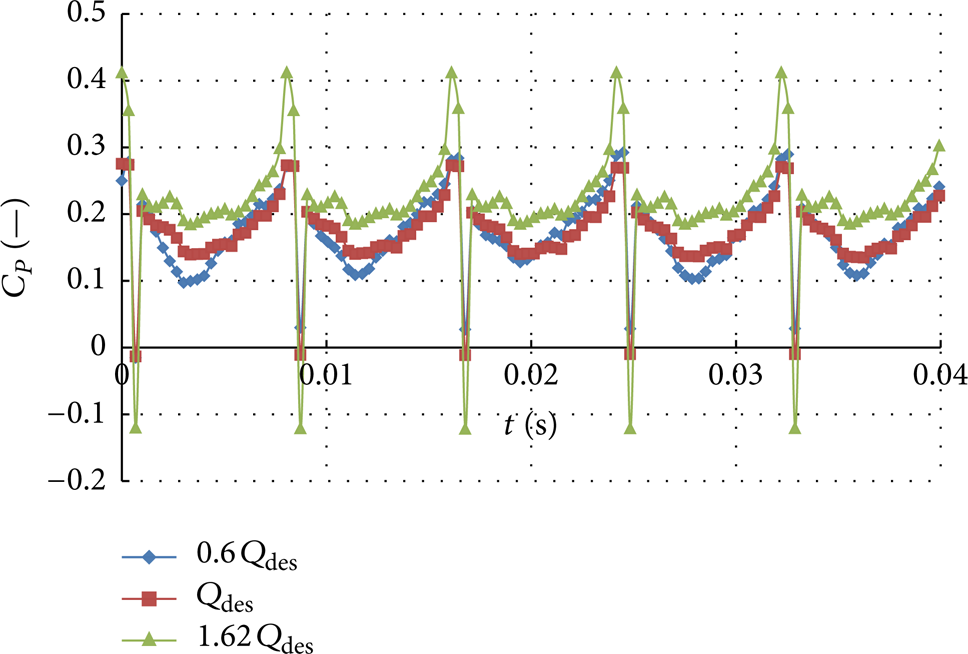
Time-history results of pressure fluctuation on P1 point under variable conditions.
Figure 12 shows the frequency domain results of pressure fluctuation on monitoring points P1, P2, and P3 under three examined operating conditions, and the fast Fourier transform (FFT) method was used to transform the time domain results into frequency domain results. Because of the time step selected in this paper, the frequency domain below 1500 Hz is valid due to the principle of Shannon sampling theorem. To improve the frequency resolution and to accurately analyze the composition of pressure fluctuations, the sampling time of the last 6 calculated impeller revolutions is used which is acceptable in the engineering. On monitoring point P1 shown in Figure 12(a), obvious pressure fluctuation components can be observed on the impeller blade passing frequency (BPF) and its integer harmonics. On the BPF, obvious fluctuation component with the value of 0.037 can be obtained under small flow rate condition, and the amplitude of the components for other flow rates can be found less than 0.025. However, for all other higher integer harmonics of the impeller BPF, the fluctuation components are bigger under large flow rate condition, while the components are smaller under small flow rate condition than under design condition. Some wide band frequency components can be observed for small flow rate which should be caused by other turbulent flow phenomena, and the component amplitudes are less than 0.005 which are not the dominant components on P1. On monitoring point P2 shown in Figure 12(b), the main fluctuation components can still be found on the BPF and its integer harmonics, and the components on the integer harmonics are weaker than on the BPF. All the fluctuation components are smaller than on P1 which means the fluctuation energy is weaker than P1. On the BPF, the component under large flow rate condition is much stronger than other conditions. On the harmonics, the same law can be found except for the 2nd harmonic on which the component under small flow rate condition is bigger. On monitoring point P3 shown in Figure 12(c), although the fluctuation components on the BPF are bigger than P2, the weaker components on the harmonics, especially on the 6th and higher harmonics, make weaker fluctuations than P1 and P2.

Frequency domain results of pressure fluctuation on monitoring points under variable conditions: (a) monitoring point P1, (b) monitoring point P2, and (c) monitoring point P3.
To analyze the pressure fluctuation results at different positions in the flow channel under certain condition, the frequency domain results of pressure fluctuation on 3 monitoring points under each operating condition have been shown in Figure 13. For all the examined operating conditions, the pressure fluctuation on monitoring point P4 is the biggest, because, for BPF and almost all the harmonics, the fluctuation components are the biggest. In addition, the fluctuation components for P5 are bigger than for P6; therefore, the pressure fluctuation is stronger when the position is closer to the gap between impeller and diffuser for all the flow rate conditions.

Frequency domain results of pressure fluctuation on 3 monitoring points under different operating conditions: (a) 0.6 Q des condition, (b) Q des condition (c), and 1.62 Q des condition.
4.2. Pressure Fluctuation Intensity for a Revolution Period
Most of the numerical results analyzed above were only visualized in whole flow channel for limited time points or at limited monitoring positions for a whole impeller revolution. It is not easy to check the pressure fluctuation intensity of the flow considering both whole revolution period and whole flow channel at the same time in such way. Therefore, it is necessary to find a way that can solve this problem and can check the pressure variations directly and comprehensively during the pump design procedure. Consequently, this section focused on the pressure fluctuation intensity results in the pump for an impeller revolution, which can improve the understanding of impeller-diffuser interaction in centrifugal pumps from a brand new angle of view.
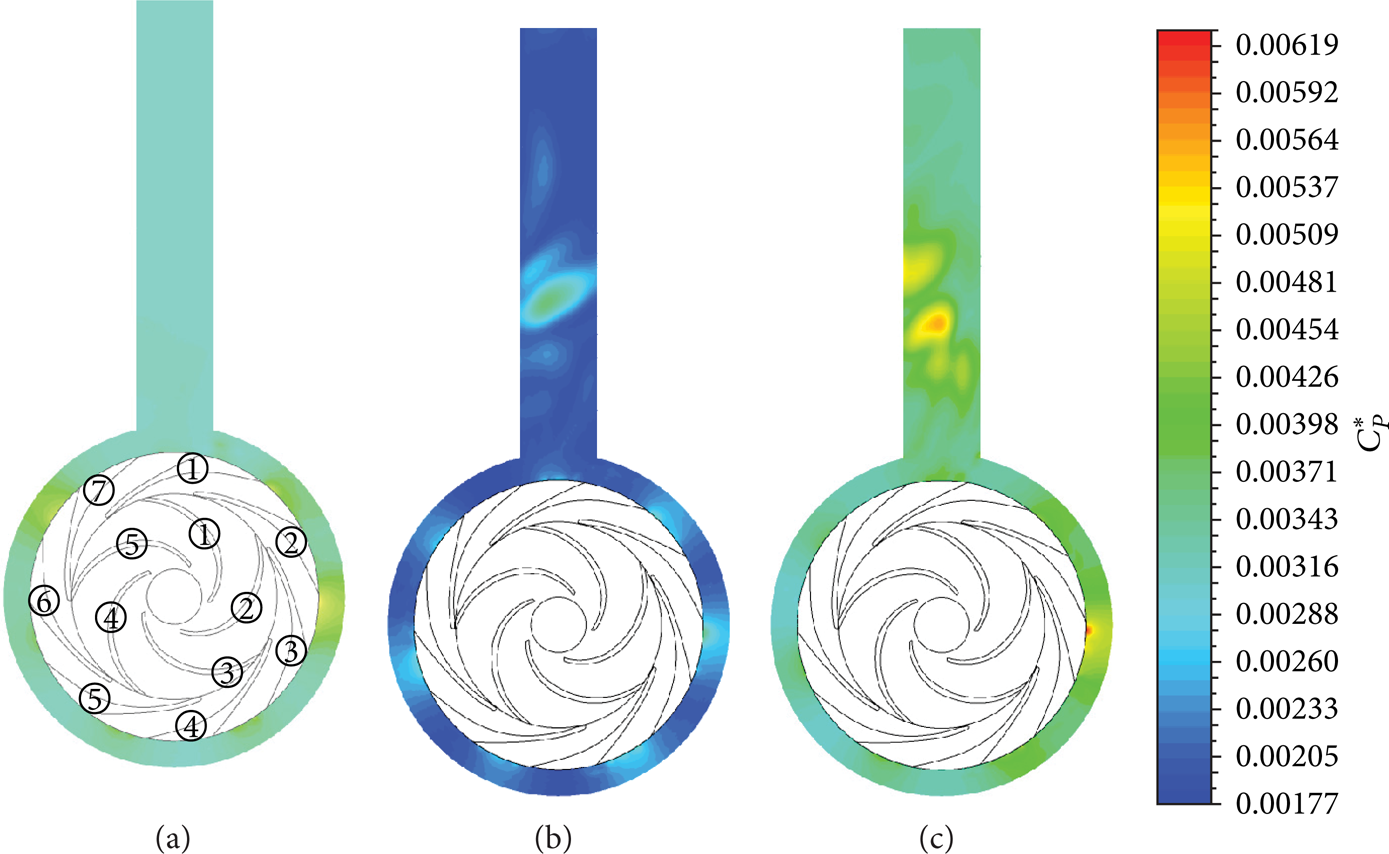
Figure 14 shows the PFIC distributions on the middle section of impeller and diffuser channels under variable conditions. The strong pressure fluctuation intensity can be found in the gap between impeller and diffuser for every flow rate condition, and, as a source, the fluctuations are spreading to the upstream of the impeller channel as well as the downstream of the diffuser channels with certain gradients. The stronger pressure fluctuation intensity and the larger gradient can be found at leading edge of diffuser vane near suction side and at trailing edge of impeller blade near pressure side. In addition, the fluctuation intensity distributions are relatively small under design condition, and, under small flow rate condition, the fluctuation intensity distributions are bigger but smaller than under large flow rate condition. Under large flow rate condition, the area with strong fluctuation is bigger, and bigger spreading distance to the channels downstream and upstream can be obviously obtained.

PFIC distributions on the middle section of impeller and diffuser channels under variable conditions: (a) 0.6 Q des condition, (b) Q des condition, and (c) 1.62 Q des condition.
Impeller blades and diffuser vanes are the most important hydraulic parts in the pump, and pressure fluctuations acting on them have key effects on the pump operational reliability. To study the pressure variations on both impeller blades and diffuser vanes, therefore, the PFIC distribution analysis has been conducted, and the serial numbers of blades and vanes can be read in Figure 19(a). Figure 15 shows the PFIC distributions on the surfaces of 5 blades, for both pressure side and suction side, at middle height under Q des conditions, and the fluctuation intensity is increasing from LE to TE. On the pressure side, the intensity is gradually increasing from LE to 0.6 times of blade length, because as mentioned above, the fluctuation which is spreading to this area is not quite strong. In the range of 0.6 times of the length to TE, sharp increasing of the fluctuation intensity can be obtained because the area is closer to the gap. Almost the same distributions can be observed for all the blades, and only a little difference can be seen for blade 4. For the PFIC distribution on the suction side shown in Figure 15(b), not obvious increasing of the intensity in the range from LE to 0.6 times of blade length can be observed while obvious increasing can be obtained for the rest of the part of blade length.

PFIC distributions on impeller blade surface at middle height under Q des condition: (a) pressure side and (b) suction side.
Figure 16 shows the pressure fluctuation distributions on surfaces of 7 diffuser vanes at middle height under Q des condition. On the pressure side, the fluctuation intensity is decreasing gradually from LE to TE, and almost the same distribution can be found for each vane. On the suction side, the distribution law is quite different from the pressure side, and, in the range from LE to 0.2 times of blade length, the pressure fluctuations are in the high level of about 0.04–0.07 because, in this area, the vane surface is just near the gap according to the vane shape and the mounting position, and strong rotor-stator interaction can be found. In the range from 0.2 to 0.3 times of blade length, sharp decreasing can be obtained, and the intensity value becomes less than 0.02. In the rest of the part of the vane, the intensity on the suction side keeps in a low level.
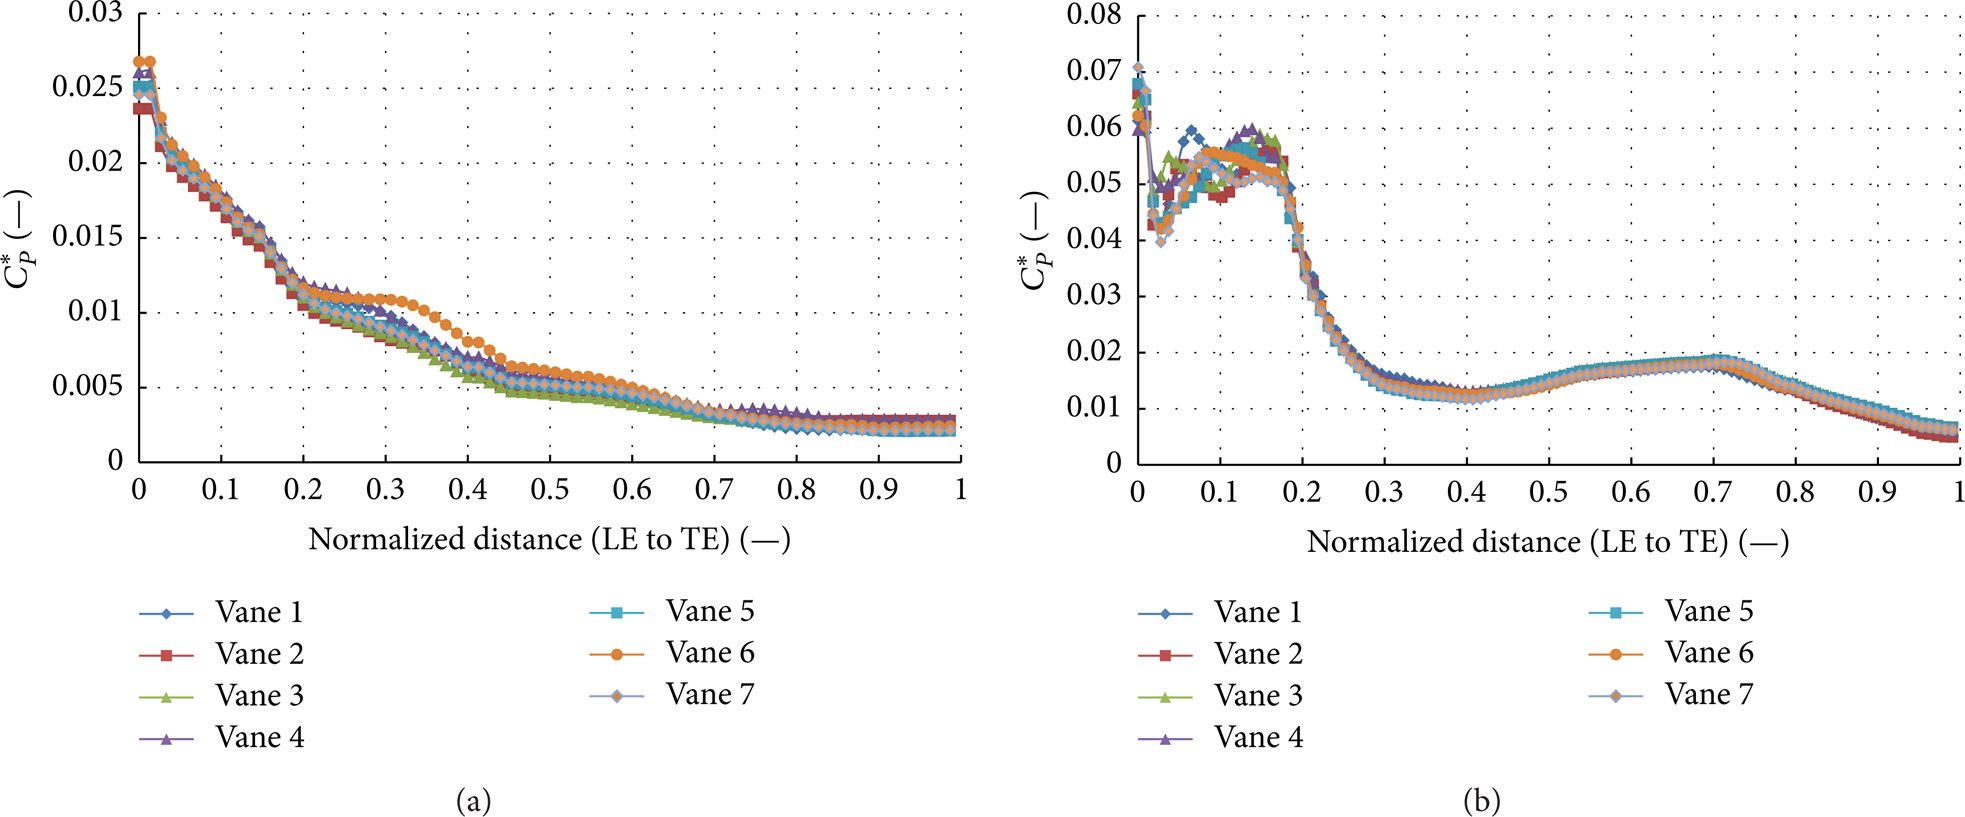
PFIC distributions on diffuser vane surface at middle height under Q des condition: (a) pressure side and (b) suction side.
As mentioned above, the distribution laws for all 5 blades or 7 vanes are almost the same; therefore, to investigate the flow rate effects on the fluctuation intensity on the blade or vane surfaces, the blade 1 and vane 1 have been selected to evaluate in this case. Figure 17 shows the PFIC distributions on impeller blade 1 at middle height under variable conditions. On the pressure side; not huge difference among the results for three flow rates can be obtained in the range from leading edge to 0.7 times of blade length. In the range from 0.7 times of blade length to TE, however, obvious difference of the fluctuation intensity distributions can found between large flow rate and design or small flow rate conditions. A peak value, about 0.085, under large flow rate condition can be observed near 0.9 times of blade length. On the suction side, in the range from LE to 0.6 times of blade length, little difference of fluctuation intensity can be observed for different flow rates, while, in the range from 0.6 times of blade length to TE, the pressure fluctuation intensity increases, and, under large flow rate condition, the intensity increases much faster and can research the maximum value of 0.0225 at TE.

PFIC distributions on impeller blade 1 at middle height under variable conditions: (a) pressure side and (b) suction side.
Figure 18 shows the PFIC distributions on diffuser vane 1 at middle height under variable conditions. On the pressure side, not quite big difference can be found under different conditions, and the intensity is a little smaller for the whole blade length under design condition. On the suction side of the diffuser vane, obvious difference can be seen for large flow rate in the range from LE to 0.5 times of blade length, and the maximum value of 0.1 can be obtained under the condition. In the range from 0.5 times of blade length to TE, almost the same distribution can be found for three flow rates.

PFIC distributions on diffuser vane 1 at middle height under variable conditions: (a) pressure side and (b) suction side.
PFIC distributions on middle section of circular casing under variable conditions: (a) 0.6 Q des condition, (b) Q des condition, and (c) 1.62 Q des condition.
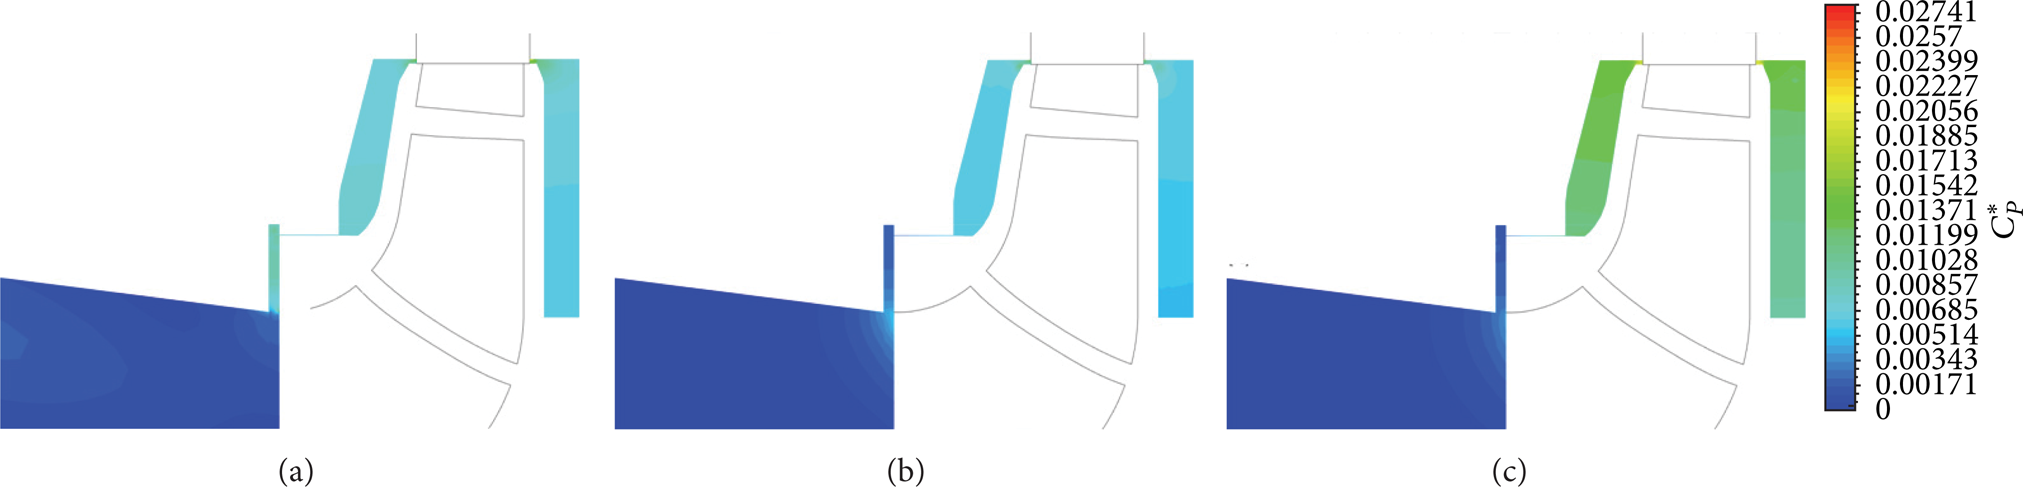
In the same way, the pressure fluctuation intensity distributions in the circular casing have been evaluated and analyzed in Figure 19 for three examined flow rates. The smallest intensity distributions can be observed under design condition, and, in the circular channel, the area corresponding to the diffuser outlet has obvious fluctuation intensity distribution. In addition, strong pressure fluctuation can be also found in the discharge tube for this designed model pump, and this may cause the flow unsteadiness in the downstream pipeline which should be noticed and optimized in the design procedure. Under off-design conditions, stronger fluctuation intensity can be obtained than design condition, and strong intensity can be found in the diffuser outlet area. In addition, strongest fluctuation intensity can be seen in the discharge tube under large flow rate condition. To check the fluctuation intensity in a three-dimensional way in the casing, the PFIC distributions on axial cross-section have been revealed in Figure 20, and the strong intensity area in the discharge tube and near diffuser outlet can be found as a three-dimensional space.
PFIC distributions on axial cross-section of circular casing under variable conditions: (a) 0.6 Q des condition, (b) Q des condition, and (c) 1.62 Q des condition.
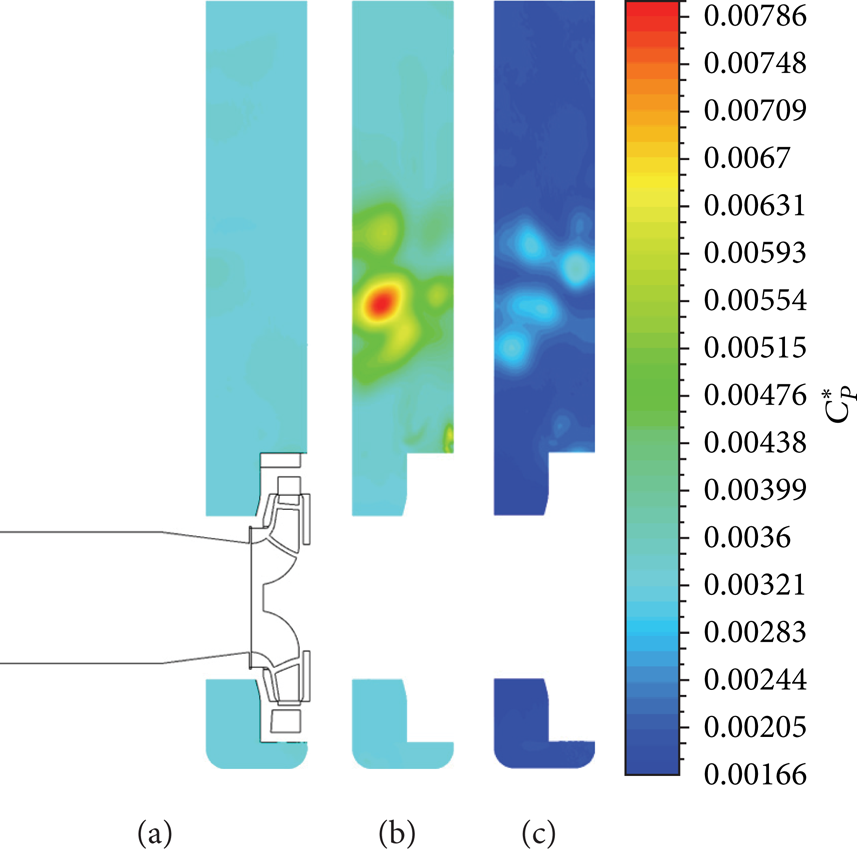
Finally, the pressure fluctuation intensity distributions in the side chamber and wear-ring channels have been evaluated and compared for three operational conditions, as shown in Figure 21. Obvious fluctuation intensity can be found in both the front and back side chamber channels under every operational condition because the fluctuations are spreading from the gap between the impeller and diffuser to the side chamber, and the intensity decreases when the flow is moving far away from the gap. The strongest fluctuation distribution can be obtained under large flow rate condition in the side chamber channel. In addition, the leakage flow also has obvious influence on the pressure fluctuation distribution in the inlet pipe of the pump because intensity distributions with great gradient can be found in the inlet pipe near wear-ring channel.
PFIC distributions on axial cross-section of side chamber and ring channels under variable conditions: (a) 0.6 Q des condition, (b) Q des condition, and (c) 1.62 Q des condition.
5. Conclusions
In this paper, the periodically unsteady pressure characteristics caused by rotor-stator interaction have been investigated numerically by CFD calculation to evaluate the transient pressure variation in a centrifugal diffuser pump with circular casing for multiconditions. Side chamber flow effect is also considered for the simulation to accurately predict the flow in whole flow passage. The pressure fluctuation results in time and frequency domains were considered for several typical monitoring points in the area where relatively strong rotor-stator interaction occurs. In addition, to solve the problem that pressure fluctuation analyzed can be only visualized in whole flow channel for limited time points or at limited monitoring positions for a whole impeller revolution, the pressure fluctuation intensity coefficient (PFIC) based on standard deviation method was defined on each grid node for entire space and impeller revolution period. Therefore, the strength distributions of unsteady pressure based on URANS equations can be analyzed directly and comprehensively.
It is indicated that the PFIC results based on statistical method can supply a new angle of view to evaluate the pressure variation in the RHRP, and it is a good supplement to the traditional unsteady pressure analysis method in time and frequency domain. It was confirmed that strong pressure fluctuation intensity can be found in the gap between impeller and diffuser. As a source, the fluctuation can spread to the upstream and downstream flow channels as well as the side chamber channels.
Footnotes
Nomenclature
Conflict of Interests
The authors declare that they do not have any commercial or associative interests that represent a conflict of interests in connection with the work.
Acknowledgments
This work was supported by the National Natural Science Foundation of China (Grant nos. 51239005 and 51349004), the National Science and Technology Pillar Program (Grant no. 2011BAF14B04), the Natural Science Foundation of Jiangsu Province (Grant no. BK2011504), and Research Foundation for Advanced Talents of Jiangsu University (Grant no. 13JDG084).