
Abstract
This work proposes a method for reducing mechanical stresses induced in thermoelectric (TE) structure to increase the operational life of the device. For this purpose, based on preliminary studies of the deformation and stress contours of existing thermoelectric modules, a new circular arrangement for the thermoelements layout is designed. Numerical simulations for various geometries of TE modules have been done to investigate their thermomechanical/structural behavior under the same operating conditions. Simulation results show a significant reduction in the shear stress, the von Mises stress, and the total deflection relative to the existing rectangular layout design. In order to prove our finite element analysis is correct, two experiments have been done: 1) shear testing for stress analysis; 2) shadow moiré technique for deformation analysis. The result obtained from experiments is then compared with the results from their simulated model in ANSYS. There is pretty good agreement between manual calculation, experiments, and simulation results. In addition to all these, theoretical calculations of the stresses result from the bending moment and transverse shear force have been done. It is concluded that the new layout reduced the maximum stresses and the total deflections, which can greatly influence the operation lifetime of the components of the thermoelectric module.
1. Introduction
Nowadays, owing to rising global energy prices, scientists are interested in generating electricity from waste heat using thermoelectric materials. Nevertheless, the major problem associated with thermoelectric devices in many applications is their low efficiency. Their performance is generally determined by the figure of the merit (ZT) of the constituent materials as defined in (1) [1]. Increasing the figure of merit is one of the most critical means of improving thermoelectric efficiency. Much of the research in thermoelectric materials has focused on increasing S and reducing κ in (1) by manipulating the nanostructures of the materials [2–4]:

where σ is the electrical conductivity, κ is the thermal conductivity, and S is the Seebeck coefficient.
Other than improving electrical performance, extending the lifetime and improving the reliability of the module are also important. Thermal loading is a major issue in electronic systems. Thermal stresses and deformations are the main causes of the limited lifetimes of the electronic devices [5–7]. Local mismatches in coefficients of thermal expansion (CTE) between dissimilar materials can be among other causes responsible for failure. The total stress at the interface of the bonded components is due to the combined actions of the local CTE mismatch of the materials within these regions as well as the global mismatch of the assembly components [8]. Regarding mechanical failure criteria in TE structures [9], some literatures are widely taking von Mises stress as overall stress for failure determination and use finite element method to calculate such stresses [10–14]. And some others highlighted bending and shear stress, caused by bowl-shape deformation, responsible for mechanical failure [5–7, 15]. Therefore some studies have set up bending and shear test to check lifetime of the thermoelectric module in the field conditions [16–19].
To check the mechanical reliability of electronic devices, finite element software is now widely used to save analysis time. Palaniappan and Palanisamy compared the performance of Bi-Te and Pb-Te thermoelectric modules by using finite element method. The geometrical model was developed and analyzed by design modular and thermal-electric mechanical multiphysics solver of ANSYS software. The current and temperature differences between the hot side and the cold sides were varied, to study the characteristics of the thermoelectric module. The coefficient of performance (COP) for the Bi-Te system was higher compared to the Pb-Te under the same operating conditions. The optimal current and voltage increased linearly with an increase in the differential temperature. The heat absorbed by the Bi-Te system was also higher than that by the Pb-Te. It was concluded that even though the figure of merit is higher for the Pb-Te at a very high temperature range, it shows a lower performance compared to the Bi-Te, when it is operated at ambient temperature conditions [20]. Gao et al. investigated the thermal stress distribution, mechanical properties, and thermoelectric properties of a thermoelectric module (TEM) that was based on hot-pressed materials. Using the finite element method, they showed that making a TEM out of hot-pressed material can reduce its shear stress. They found that the output power and conversion efficiency of thermoelectric modules are determined by not only the material properties (Seebeck coefficient, electrical resistivity, and thermal conductivity) but also the mechanical properties of TEMs. Then, by manipulating the structural parameters, they obtained a TEM with better mechanical performance and, therefore, greater thermal stress resistance [21]. Al-Merbati et al. checked the influence of pin geometry on thermoelectric performance, thermal efficiency, and output power, using the finite element method. Thermal stress and temperature distribution analyses were carried out. The results of the analysis show that a reduction in the maximum thermal stress in the pin can improve the expected lifetime [10]. Li et al. studied the effect of geometry on the thermomechanical performance of multistage thermoelectric modules. Three thermoelectric cooler (TEC) modules with copper pads of various thicknesses were modeled and the effects of three temperature differences (ΔT) were examined. The maximum power output and the von Mises stress were determined by using ANSYS. The results reveal that at the same temperature difference, the maximum power output remained almost constant as the pad thickness varied. However, the maximum von Mises stress increased with the thickness of the pads, and ΔT increased. The maximum stress occurred at the corners of the copper pads [11]. Turenne et al. performed finite element thermomechanical modeling of large-areathermoelectric generators, based on bismuth telluride alloys. They checked the level of stress and deflection in a multistage TE module that was subjected to a temperature gradient under various operating conditions and different leg lengths. The results were validated by making measurements using an optical profiler. They found that plastic deformation in the soldering alloys and longer legs have a significant role in releasing the stress in the connections. Furthermore, the maximum stress occurred in the legs close to the edges and the maximum deformation happened at the corners of the module [12]. Sakamoto et al. designed and built a n-Mg2Si TEG with an unconventional structure, in order to mitigate the stress in the TEG due to external forces. A TEG structure, comprising inclined TE chips, was modeled and analyzed with the aid of FEM analysis ANSYS code. Several inclinations of the TE chips were considered to find the geometry that best mitigated the stress in the chips under horizontal external load. The best geometrical configuration was assembled then. And P max , power density, heat flux, and TE efficiency at P max were measured. The results indicated improving the thermal conductivity and TE output power [22]. Erturun and Mossi investigated stress and deflection analysis of thermoelectric modules with varying geometry. For this purpose, six different TEM models with various thermoelectric leg geometries were designed in order to perform a thermal stress analysis using ANSYS Workbench. Significant decrease in thermal stresses and leg deformations were observed with some models, particularly in the cylindrical TE leg geometry [14].
Looking up to the past literatures, most of the relevant studies have discussed the effects of changing parameters on mechanical and electrical performance. However, few of them have provided a practical way to reduce the imposed mechanical and thermal stresses on the entire structure. Therefore, the purpose of this work is to reduce the overall imposed stresses and deflections in order to increase working lifetime of the TE modules.
2. Methodology
To predict the failure of a structure, a considerable number of failure theories have been proposed. However, the most commonly used ones are maximum shear stress and von Mises stress. These theories are dependent on the nature of the material and have their own applicability. For example, maximum principle stress is applicable for brittle materials and maximum shear stress and von Mises (shear strain energy) are commonly used for ductile materials [9, 23–25].
Many literatures are taking von Mises stress as overall stress for failure determination in TE structure [10–14]. And some others highlighted bending and shear stresses responsible for mechanical failure [5–7, 15]. Numerical modeling techniques are then effectively used in early design stage to provide important information about the structural strength.
From this point of view, this work begins by modeling the existing rectangular TE modules by using three-dimensional (3D) computer-aided design software. The model is then analyzed with the finite element analysis software, ANSYS Workbench. Pure temperature analysis has been done. A temperature gradient equal to 20°C is applied to both sides of the ceramic substrate to obtain a stress distribution. Based on an understanding of the stress distribution and the deformation of the whole module, different arrangement circular geometries are recommended for reducing the stress. Finally, the new designs are modeled and analyzed using the same software and the same operating conditions mentioned above.
Needless to say, for finite element analysis, the effects like plastic deformation and temperature dependency of the material properties are considered [18, 21, 26]. In addition, primary finite element analysis confirms that solder joints are the only component of the structure that suffer from plastic deformation and nonlinear effects [27–29]. Therefore, in numerical simulation bilinear kinematic hardening material model is used and yield strength and tangent modulus are defined [12, 26].
Later then, in order to prove the accuracy of finite element analysis, the result obtained from a shear test done on existing TE module is compared with those obtained from the simulation model in ANSYS Workbench. There was pretty good agreement between the manual calculation and simulation result. In addition to all these, theoretical calculations of imposed shear stress and normal bending stress on thermoelements for each of these two layouts have been done.
2.1. Design of Thermoelectric Modules
Based on preliminary studies of the deformation and stress contours of the existing thermoelectric module, new layouts of thermoelements are proposed. Initially, TE modules with various geometries were numerically simulated to determine their thermomechanical behavior under the same operating conditions. Based on the obtained results, a new orientation (arrangement) model for thermoelements in the module is proposed to reduce overall thermal stresses and thereby improve the lifetime. The 3D models of both the original and new designs were made to compute the stresses (von Mises and shear) and total deflection. For comparison purpose numerical simulation has been used. The initial analyzed results showed that the changing in the orientation of P-N thermoelements can dramatically have an effect on the von Mises stress, shear stress, and total deflection.
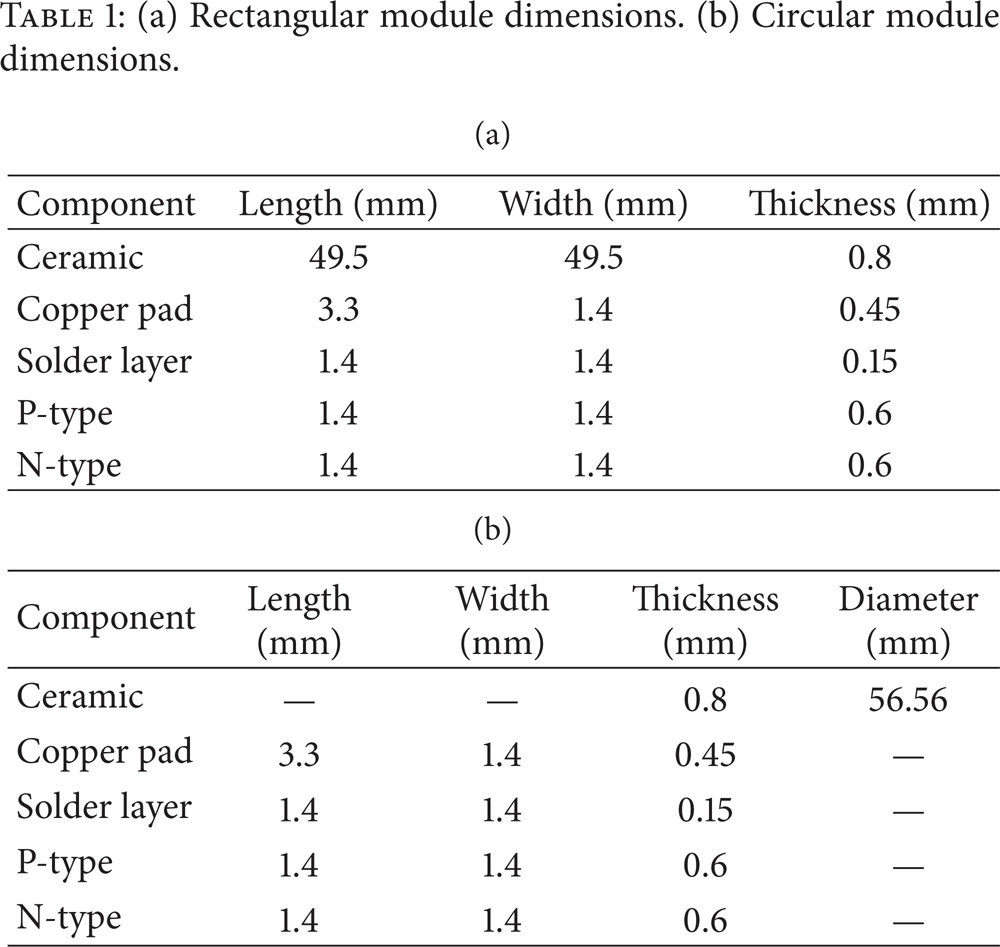
Two rectangular and four circular geometries of modules are then simulated in this work. All of these modules contain 272 pairs of P-N-type thermal elements covering a 2,450.25 mm2 surface area for the rectangular type and a 2,513 mm2 surface area for the circular type. The P- or N-type semiconductors on each of the pairs have a height of 0.6 mm and a square cross-sectional area of 1.4 × 1.4 mm2; the distance between the adjacent pairs of rows or columns is 0.5 mm in rectangular TE modules and 0.5 mm on average in circular modules. Tables 1(a) and 1(b) present the dimensions of the components of both kinds of TE modules.
(a) Rectangular module dimensions. (b) Circular module dimensions.
In reality, a thin layer of diffusion barrier made of nickel is usually metalized between the TE materials and solders. It is neglected in the simulation [12].
The line density and area density of these two groups (circular and rectangular) of modules are equal (approximately 0.2 pair/mm and 0.1 pair/mm2, resp.). This will make the fundamental geometric characteristics of them on the same level when trying to compare their thermoelectric performance later.
Figures 1(a)–1(f) present 3D models of different geometric designs. Although they all have the same number of P-N pairs, some of the models are designed with a central hole, as shown in Figures 1(d) and 1(e), and for some of them, sealants are applied around all of the thermoelements, as shown in Figures 1(b), 1(e), and 1(f). Figure 1(f) shows the design with a central support. Table 2 presents the geometrical characteristics of the modules.
Geometrical characteristics of the modules.


3D models of various geometric designs. (a) Model 1, a typical rectangular construction; (b) model 4, with sealant; (c) model 2, a typical circular construction; (d) model 3, with hole in center; (e) model 5, with hole in center and sealant; (f) model 6, with sealant and center support.
2.2. Material Properties
The TE modules comprise top and bottom ceramic cover plates, copper pad connectors, solder joints, and semiconducting thermal elements of bismuth telluride. The solder layer is a Sn-Sb alloy. The yield strength and ultimate strength of the copper strip are 70 MPa and 250 MPa, respectively, where the extensibility is 69%. The yield strength and ultimate strength of the Sn-Sb alloy are 26 MPa and 41 MPa, respectively, where the extensibility is 38%. The material properties were determined using the ANSYS bilinear kinematic hardening material model [21, 26].
The temperature dependence of the material properties such as Young's modulus, yield strength, and tangent modulus of solder joints is considered and shown in Tables 3(a) and 3(b) [30]. The other material properties for the rest of components are given in room temperature in Table 4 [21].
(a) Solder properties used in FE model (elastic properties). (b) Solder properties used in FE model (bilinear isotropic plastic properties).

Properties of materials used in thermoelectric module assembly.

2.3. Boundary Conditions and Parameters Used in Numerical Simulation
Stress relaxation in materials at the different interfaces necessitates the consideration of the plastic strain behavior of soldering alloy. Besides, primarily thermal stress analysis results confirm plastic deformation occurrence in solder joints. Therefore, the thermal stress and strain occurring on a TE module subjected to variable thermal conditions were estimated based on three-dimensional elastic-plastic (bilinear kinematic hardening) of finite element analysis. And yield strength and tangent modulus are defined [12, 26].
As mentioned earlier, to simulate the effect of geometry on deformation, stresses, and temperature distribution, various geometries were modeled and a series of finite element analyses were conducted by applying a temperature gradient ΔT to the faces of the module, to stress the entire structure in the steady state situation.
The numerical simulation was performed using static structural analyses functions of ANSYS Workbench. A fixed temperature difference between the hot and cold sides of the module (i.e., T h = 45°C, T c = 25°C) was imposed and the thermal/mechanical behaviors of all of the modules were thus evaluated under the same steady state conditions. All modules were considered to be free-standing without any external mechanical pressure.
To obtain more accurate result mesh study has been done. In this step we would validate our solution by refining the mesh and then verify the solution by comparing the solution to our preanalysis. The mesh size was varied in the critical areas in order to check for the solution's convergence. In this context, a better convergence and less computation time of the model are expected. It is important to note that with an increasing temperature gradient a poor mesh quality can negatively have an effect on the simulations results.
2.4. Numerical Simulation Results
Not all of the analyzed results for the six modules are presented. Rather, two of the modules (one rectangular and one circular) are selected as examples to show all of the thermal/mechanical behaviors under the imposed temperature gradient. Figures 2 to 6 plot the corresponding results. (a) and (b) show the result considering solder layer and absence of solder layer.

(a) Temperature distribution of model 1 and model 2 (with solder layer). (b) Temperature distribution of model 1 and model 2 (without solder layer).
Figure 2 plots temperature contours in both the thermoelectric modules and P-N legs. The temperature remains generally uniform along the x-z plane. The temperature variations are larger along the plane on the side between the hot and cold ceramic junctions. The maximum temperature in circular model goes a little higher than input temperature of hot side. And it can be explained because there is more surface area on the interface between top surface of thermoelement and cupper pad. Since ANSYS software calculates the final temperature by adding the node temperatures/area or volume, having more nodes results in more temperature.
Figure 3 presents the total deformation contours in both thermoelectric modules. Evidently, the total deformation in the rectangular TE is greater at the corners, whereas that of the circular TE is greater along the outer edges. Notably, the deformation contours on each are similar to a series of concentric circular rings.

(a) Total deformations of model 1 and model 2 (with solder layer). (A) Deformation showing ceramic substrates; (B) with ceramic substrates removed to show pellets. (b) Total deformations of model 1 and model 2 (without solder layer). (A) Deformation showing ceramic substrates; (B) with ceramic substrates removed to show pellets.
Figure 4 presents the von Mises stress contours for all of the P-N pairs in both thermoelectric modules. High stress regions are locally present at the corners of each copper pad that is attached to the hot ceramic substrate, because (a) large temperature gradients develop in these regions and (b) the difference between the thermal expansion coefficients of the copper pad and the substrate generates high stress levels at the interface. Moreover, the stress declines from the region of high stress down to the area of the cold junction and all the way to the cold substrate.

(a) Equivalent (von Mises) stresses of model 1 and model 2 (with solder layer). (b) Equivalent (von Mises) stresses of model 1 and model 2 (without solder layer).
Figure 5 plots the shear stress contours in both thermoelectric modules. The maximum shear stress regions are locally present at the corners of each copper pad that is attached to the hot ceramic substrate.
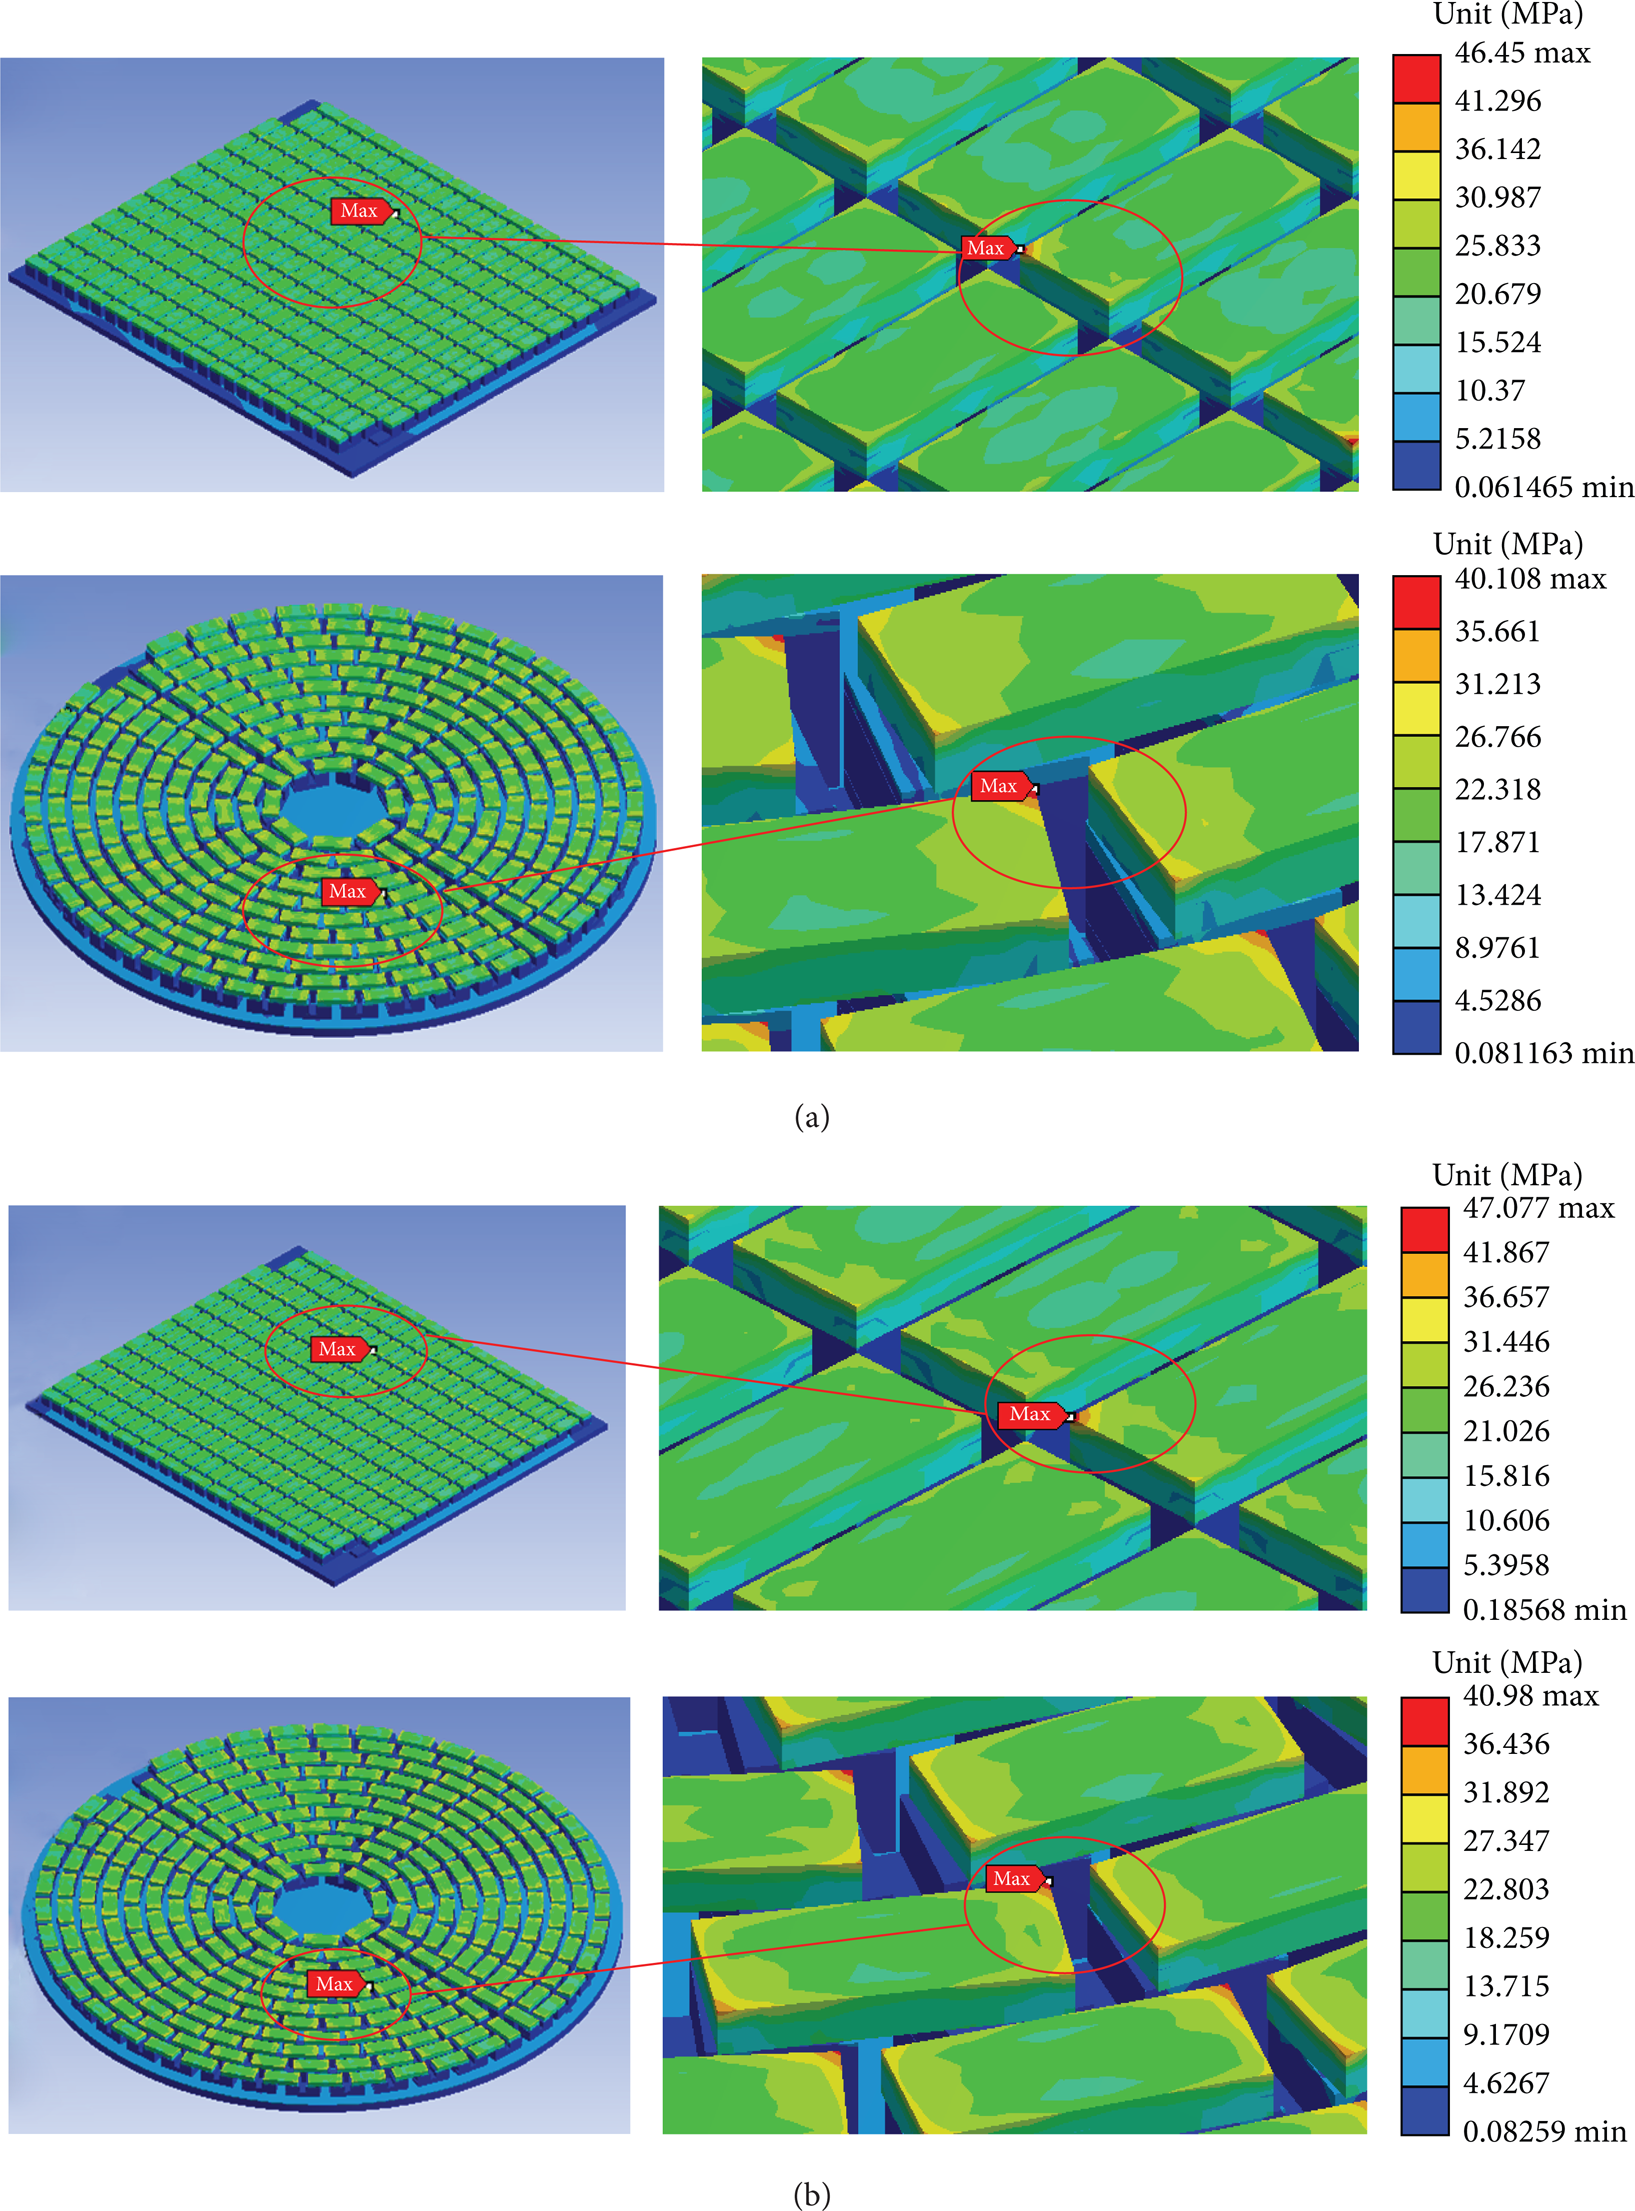
(a) Shear stress of model 1 and model 2 (with solder layer). (b) Shear stress of model 1 and model 2 (without solder layer).

Thermoelectric module related specifications.
Tables 9(a) and 9(b) in Results and Discussion section provide the maximum values of stresses (von Mises stress and shear stress), deflection, and temperature distribution that develop in the thermoelectric module when the device operates in a steady state condition. The circular module has the smallest maximum von Mises stress and shear stress. A significant reduction in total deformation is also observed. Changing the design of the thermoelectric module from rectangular to circular is suggested to reduce the overall thermal stress, allowing the extension of the lifetime of the thermoelectric device.
2.5. Validation of the Correctness of Numerical Simulation Results
It is always important to verify your simulation. Without verification, you have no proof that your simulation is usable. As mentioned earlier, in order to check the accuracy of FEM analysis, the result obtained from a shear test and shadow moiré analysis, done on an existing TE module, is compared with the result obtained from their simulated model in ANSYS Workbench. For both cases, there was pretty good agreement between manual calculation, experiments, and simulation results [31, 32].
2.5.1. Test Specimen Description for Shear Test and Shadow Moiré Analysis of Thermoelectric Module
This experiment used thermoelectric models Drift-0.6 and Drift-1.1 made in Russian Kryotherm company. The models contain 319 and 254 thermoelements, respectively. The model general specifications and picture are shown in Figure 6. And their components size is listed in Tables 5(a) and 5(b).
(a) TE module size used in shear test analysis. (b) TE module size used in shadow moiré analysis.

2.5.2. Cyclic Shear Testing Equipment, Setup, and Procedures
Shear testing equipment including tensile testing machine, TE holder fixture, and data acquisition system is shown in Figure 7. The test also used pressure sensor and LCR meter to record the pressure given to the fixture and record the TE modules resistance to determine the module failure (Figure 7). Top surface of the ceramic is fixed in all directions and bottom surface is pushed only in horizontal direction. Displacements equal to those in Table 6 are inserted into bottom ceramic plate and its corresponding force is recorded (Figure 9(a)). This test has been done in four pressures presented in Table 6 and continued until TE module has failed. A quick way to check TE module failure is to measure its resistance. If it changes by more than initial value 5%, it can be said the TE module has failed.
The results of cyclic shear tests.


Equipment used in shear testing. (a) Tensile testing machine. (b) TE holder fixture. (c) Data acquisition system. (d) LCR meter.
When the pushing force to ceramic plate reaches 450 N, displacement sensors show 0.32 mm; this time we clearly heard the noise of TE cracking and resistance value increased from the initial value 1.58 to 1.75, determining the TE module failure (Figure 8(a)). All of the analyzed results (resistance change graphs) for the four modules are presented (Figures 8(a)–8(d)). Later, our reference for shear test finite element analysis will be based on TE number 4 with force of 350 N equivalent to displacement of 0.24 mm.

(a) Resistance change for TE serial number 1. (b) Resistance change for TE serial number 2. (c) Resistance change for TE serial number 3. (d) Resistance change for TE serial number 4.

Finite element analysis results. (a) Shear force. (b) Shear stress.
2.5.3. Thermoelectric Module Design and Finite Element Analysis
Thermoelectric modules used in the previous experiment are modeled by AutoCAD software and then imported into ANSYS Workbench for further analysis. The boundary conditions are set like the experiments. Top surface of the ceramic is fixed in all directions and bottom surface can only move in horizontal direction. A displacement equal to 2.4 mm which is an equivalent of 350 N force (or pressure 10.938 MPa) is inserted into bottom ceramic plate and its maximum corresponding shear stress is obtained (Figures 9(a) and 9(b)). Our reference here was force corresponding to displacement 0.24 mm in Table 6. Later then, the finite element analysis results are compared with manual calculation. There was pretty good agreement between manual calculation and simulation result.
2.5.4. Theoretical Calculation
A shear stress is defined as the component of stress coplanar with a material cross section. Shear stress arises from the force vector component parallel to the cross section. The formula to calculate average shear stress is force per unit area:

where τ = the shear stress; V = the force applied; A = the cross-sectional area of material with area parallel to the applied force vector. Then for the above structure we have the following.
The number of thermoelements in TE module = 319.
The ceramic substrate area occupied by thermoelements = 319 × 1.4 × 1.4 = 625.24 mm2.
Then the amount of average shear stress imposed on thermoelements will be τ = V/A = 350/625.24 = 0.559 (N/mm2).
The calculation and simulation results are summarized in Table 7. As you can see there is small percentage of difference between manual calculations and ANSYS simulation results (∼1%). And that can be explained as the effect of local deformation and stress concentration closer to the imposed force area.
Comparison of finite element analysis and calculation result.

2.5.5. Deformation Measurement Setup and Procedures in Moiré Technique
The basic shadow moiré setup for measuring thermal deformation (see Figure 10) includes a white light source; camera above the sample; infrared heat source under the sample; and a glass Ronchi grating which serves to project the grating lines onto the sample via shadowing. A phase-stepping function is performed by mechanically translating the sample in the Z direction, causing the shadow lines to shift; during this phase stepping, the camera records the line pattern changes, and software algorithms convert these images into 3D computer plots. Figure 11 shows a schematic view of thermoelectric module erected on the support between frame and grating. The three-step phase shift of shadow moiré measurement has been used in order to increase the moiré resolution. It is adjusted when the test piece was dropped; one-third of the grating pitch retrieves the first shadow moiré image. And this step will repeat until fourth shadow moiré image is captured. When the specimen has declined to a grating pitch equal to 50 μm, power controller is adjusted in the way that change voltage to next value, and repeat the same steps. For measuring thermal deformation, TE module has been subjected to different loads (1∼3 V) every 0.5 V interval. By using shadow moiré phase shift method, thermoelectric module hot/cold side deformations are measured and three-step phase shift shadow moiré diagrams are drawn. To compare with the other images later, fringe pattern of the original image is captured at the voltage of 0 volts (at room temperature).

Setup for the measurement of thermal warpage of TE module.

Thermoelectric module erection.
Instead of showing all phase shift shadow moiré diagrams (1∼3 V), deformation diagram corresponding voltage of 2 V is selected as example to show thermal/structural behavior of hot/cold surface in this experiment (Figures 12 and 13). The numbers shown on the color ruler are in units of μm. The bluish color represents lower surface, and reddish color shows higher surface.
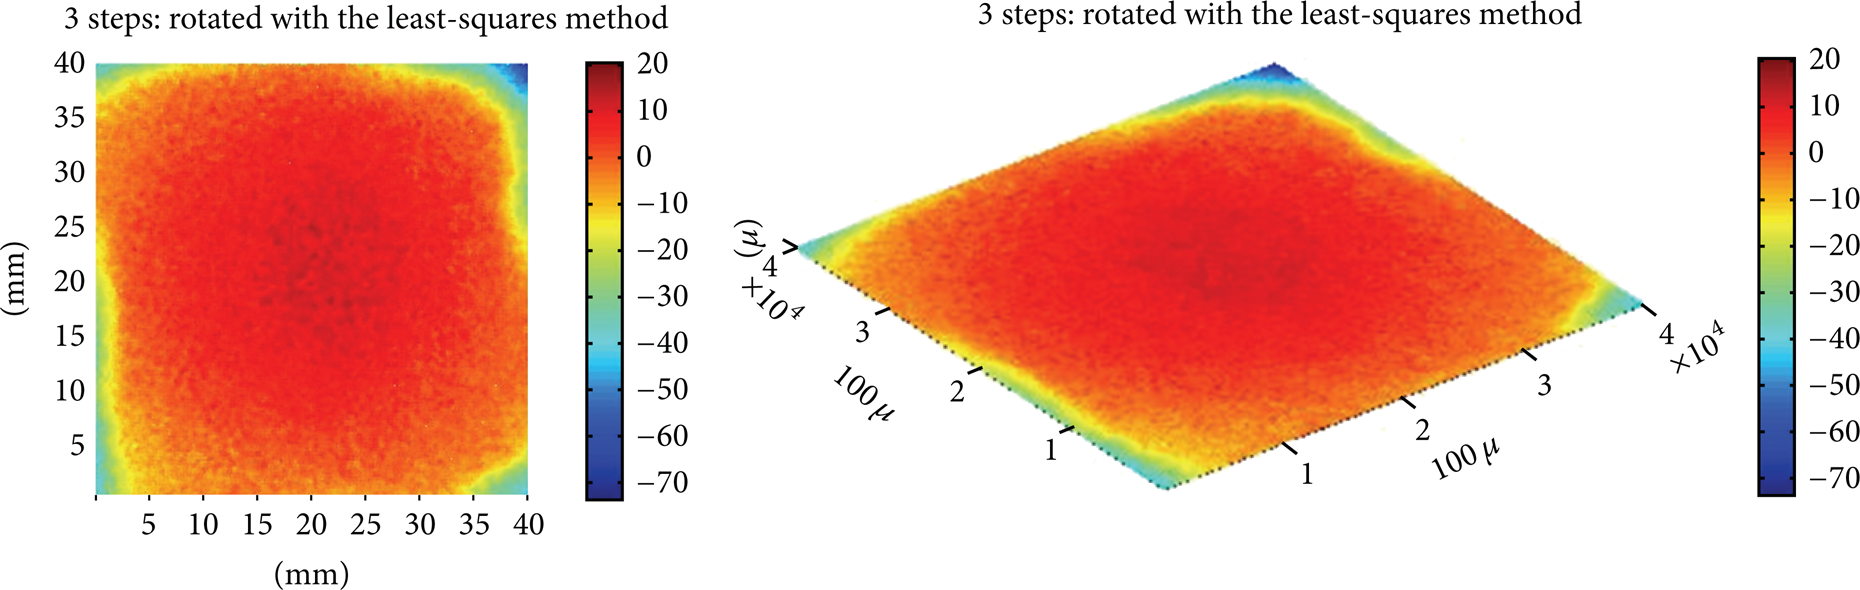
Phase diagram, phase reconstruction map, and surface deformation map of the hot side at the voltage of 2 volts.
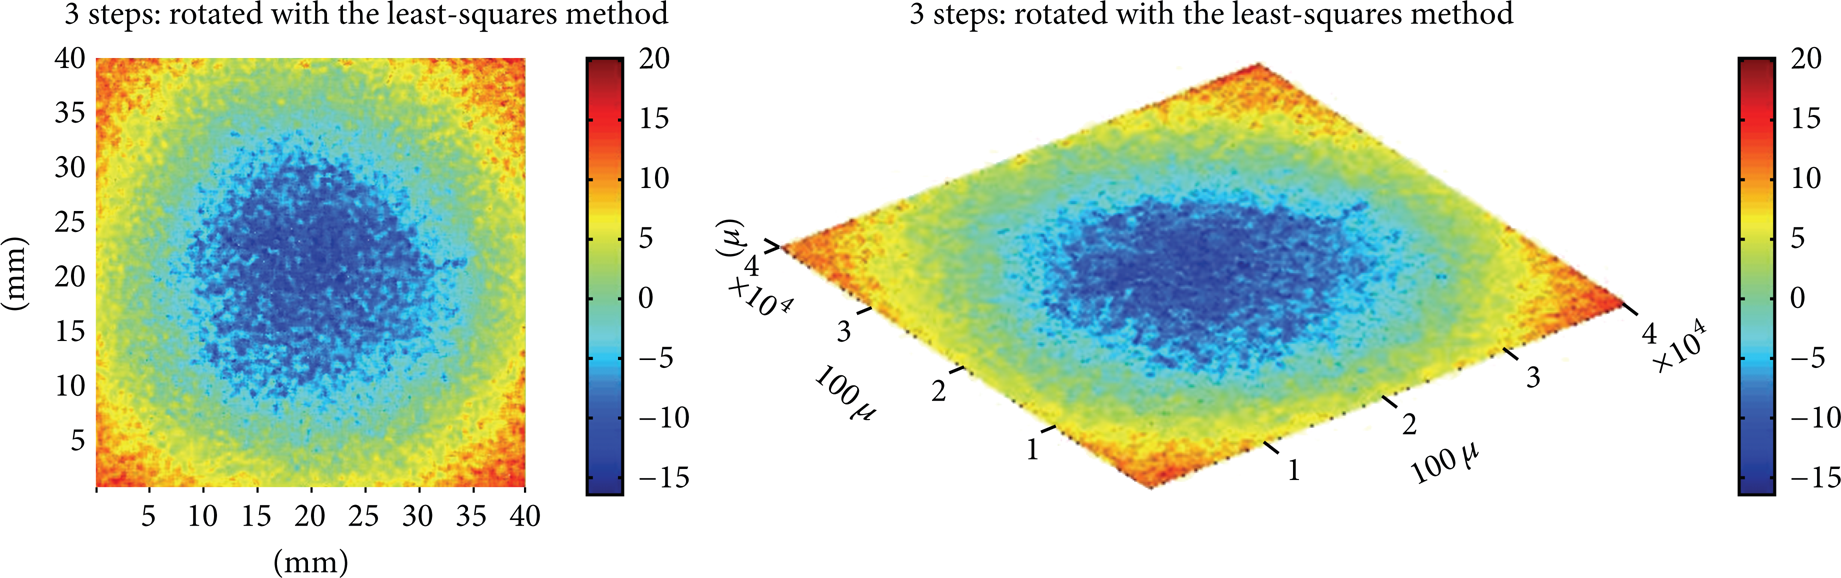
Phase diagram, phase reconstruction map, and surface deformation map for cold side at the voltage of 2 volts.
Besides, to acquire the real-time variation of temperatures, two thermal couples were adhered to the hot and cold plates, respectively. And they were connected to a data acquisition system to interpret the temperature. Later these temperatures will be used as input boundary conditions into finite element analysis. The overall variations of warpage and temperature with voltage difference are summarized in Table 8.
Voltage-warpage values comparison from finite element analysis and shadow moiré at the hot/cold side.

(a) 3D thermoelectric model without considering solder layer (T h = 45°C, T c = 25°C). (b) 3D thermoelectric model with considering solder layer (T h = 45°C, T c = 25°C).

2.5.6. Thermoelectric Module Design and Finite Element Analysis
Thermoelectric modules used in the previous experiment are modeled by AutoCAD software and then imported into ANSYS Workbench for further analysis. Material property listed in Tables 3(a) and 3(b) is used. The boundary conditions (temperature gradients) listed in Table 8 are applied on both sides of ceramic substrate and equivalent plane deformation in vertical directions is calculated. Later then, the finite element analysis results are compared with shadow moiré deformations. There was pretty good agreement between experimental estimations and simulation results. The results are summarized in Table 8.
2.5.7. Comparison of the Results from Thermal/Structural Finite Element and Shadow Moiré Deformation Measurement
This section will focus on comparison of thermal/structural finite element analysis results with shadow moiré deformation maps. The results corresponding to 2 V voltage are chosen as example to discuss here. Figure 14 presents the overall temperature distribution. Figures 15(a) and 15(b) plot the hot/cold plane deformation of TE module. Comparing deformation contour in finite element method with shadow moiré image, we see that contour lines are following the same trend. But by comparing deformation value at hot and cold side we see error of 3.66% and 0.92%, respectively.

Overall temperature distributions at voltage of 2 volts.

(a) Hot side plane deformation at voltage of 2 volts: (A) warpage from finite element method; (B) warpage from shadow moiré deformation maps. (b) Cold side plane deformation at voltage of 2 volts: (A) warpage from finite element method; (B) warpage from shadow moiré deformation maps.
2.5.8. Comparison of the Results from Thermal/Structural Finite Element Analysis and Shadow Moiré Warpage Values
This section will focus on comparison between experimental deformation measurements of hot/cold plane and thermal/structural finite element analysis. The variation of hot/cold side warpage with different voltage levels is summarized in Table 8. And The variation of hot/cold side warpage with different voltage are plotted in Figures 16(a) and 16(b). It can be seen that deformation increases linearly as the voltage increases. And the results obtained from both methods are very close and consistent.

Voltage-warpage graph from finite element analysis and shadow moiré: (a) hot side; (b) cold side.
3. Results and Discussion
Many studies discuss the mismatch between the coefficients of thermal expansion of different materials as one of the main causes of failure in assembly structures [8]. When a temperature gradient is imposed on the TE module, the hotter side of the module expands and the colder side contracts in all three dimensions (3D), producing 3D stress in all (X, Y, and Z) directions. Stress in the X-Y plane is perceived as shear stress and those in the Y-Z and X-Z planes are bending stresses. In the numerical analyses of this study, the von Mises stress and shear stress were used as an indicator of the overall stress at the locations of interest on the structure [12]. The expansion of the hot side and the compression of the cold side generate a bending moment on the legs that is similar to that established in a beam fixed on its both ends. For example, the bending stresses are highest in the corners of the legs adjacent to the hot side, close to the corners of the rectangular module. The maximum shear stresses on each of the P-N pairs occur at the corners adjacent to the interface with the ceramic substrate, and the values on the corner of each P-type or N-type element vary from pair to pair.
3.1. Comparing Simulation Results of Thermal/Structural Analyses for All Types of Different Geometries
Tables 9(a) and 9(b) summarize all of the total deflections, equivalent (von Mises) stresses, shear stresses, and temperature distributions for both the rectangular and the circular thermoelectric modules, obtained by finite element analysis. Tables 9(a) and 9(b) show the results without and with the inclusion of solder joint in the 3D model, respectively. It is seen clearly that adding solder material into the structure can release the amount of stresses about 1%∼6%. This observation could result from the plastic deformation that often occurs in the solder layer material in the field applications. As noticed in the same table, the P-N-type elements of the circular layout have a significant lower von Mises stress, shear stress, and the total deflection comparing with those of the original rectangular layout. For example, comparing those results without solder joints for model 2 (circular) and model 4 (rectangular) as shown in Table 9(a), the maximum total deformation is 42% lower for the former, and both the equivalent (von Mises) stress and the shear stress are 13% lower than those of the latter, respectively.
Conversely, comparing those cases with solder joints in model 2 (circular) and model 1 (rectangular) as indicated in Table 9(b), the same amount of differences are observed again; that is, the maximum total deformation, the equivalent (von Mises) stress, and the shear stress in model 2 are 42%, 13% lower than those of model 1, respectively.
3.2. Mechanical Effects of Different Layout Design in Thermoelement
The significant reduction in the total deflection can be interpreted as being caused by the difference between the geometric arrangements of the P-N pairs. Figure 17 schematically depicts the locations of the P-N pairs in the circular and rectangular thermoelectric modules. For example, when the circular and rectangular layouts are superimposed, as shown in the figure, the position of the P-N pairs in each layout is easily seen in the magnified “Detail A” to the right of the figure. When a temperature gradient is applied to it, the hot side expands and the cold side contracts, causing the module to bend. The effect is equivalent to that of applying a pure bending moment to the entire structure (Figure 18).
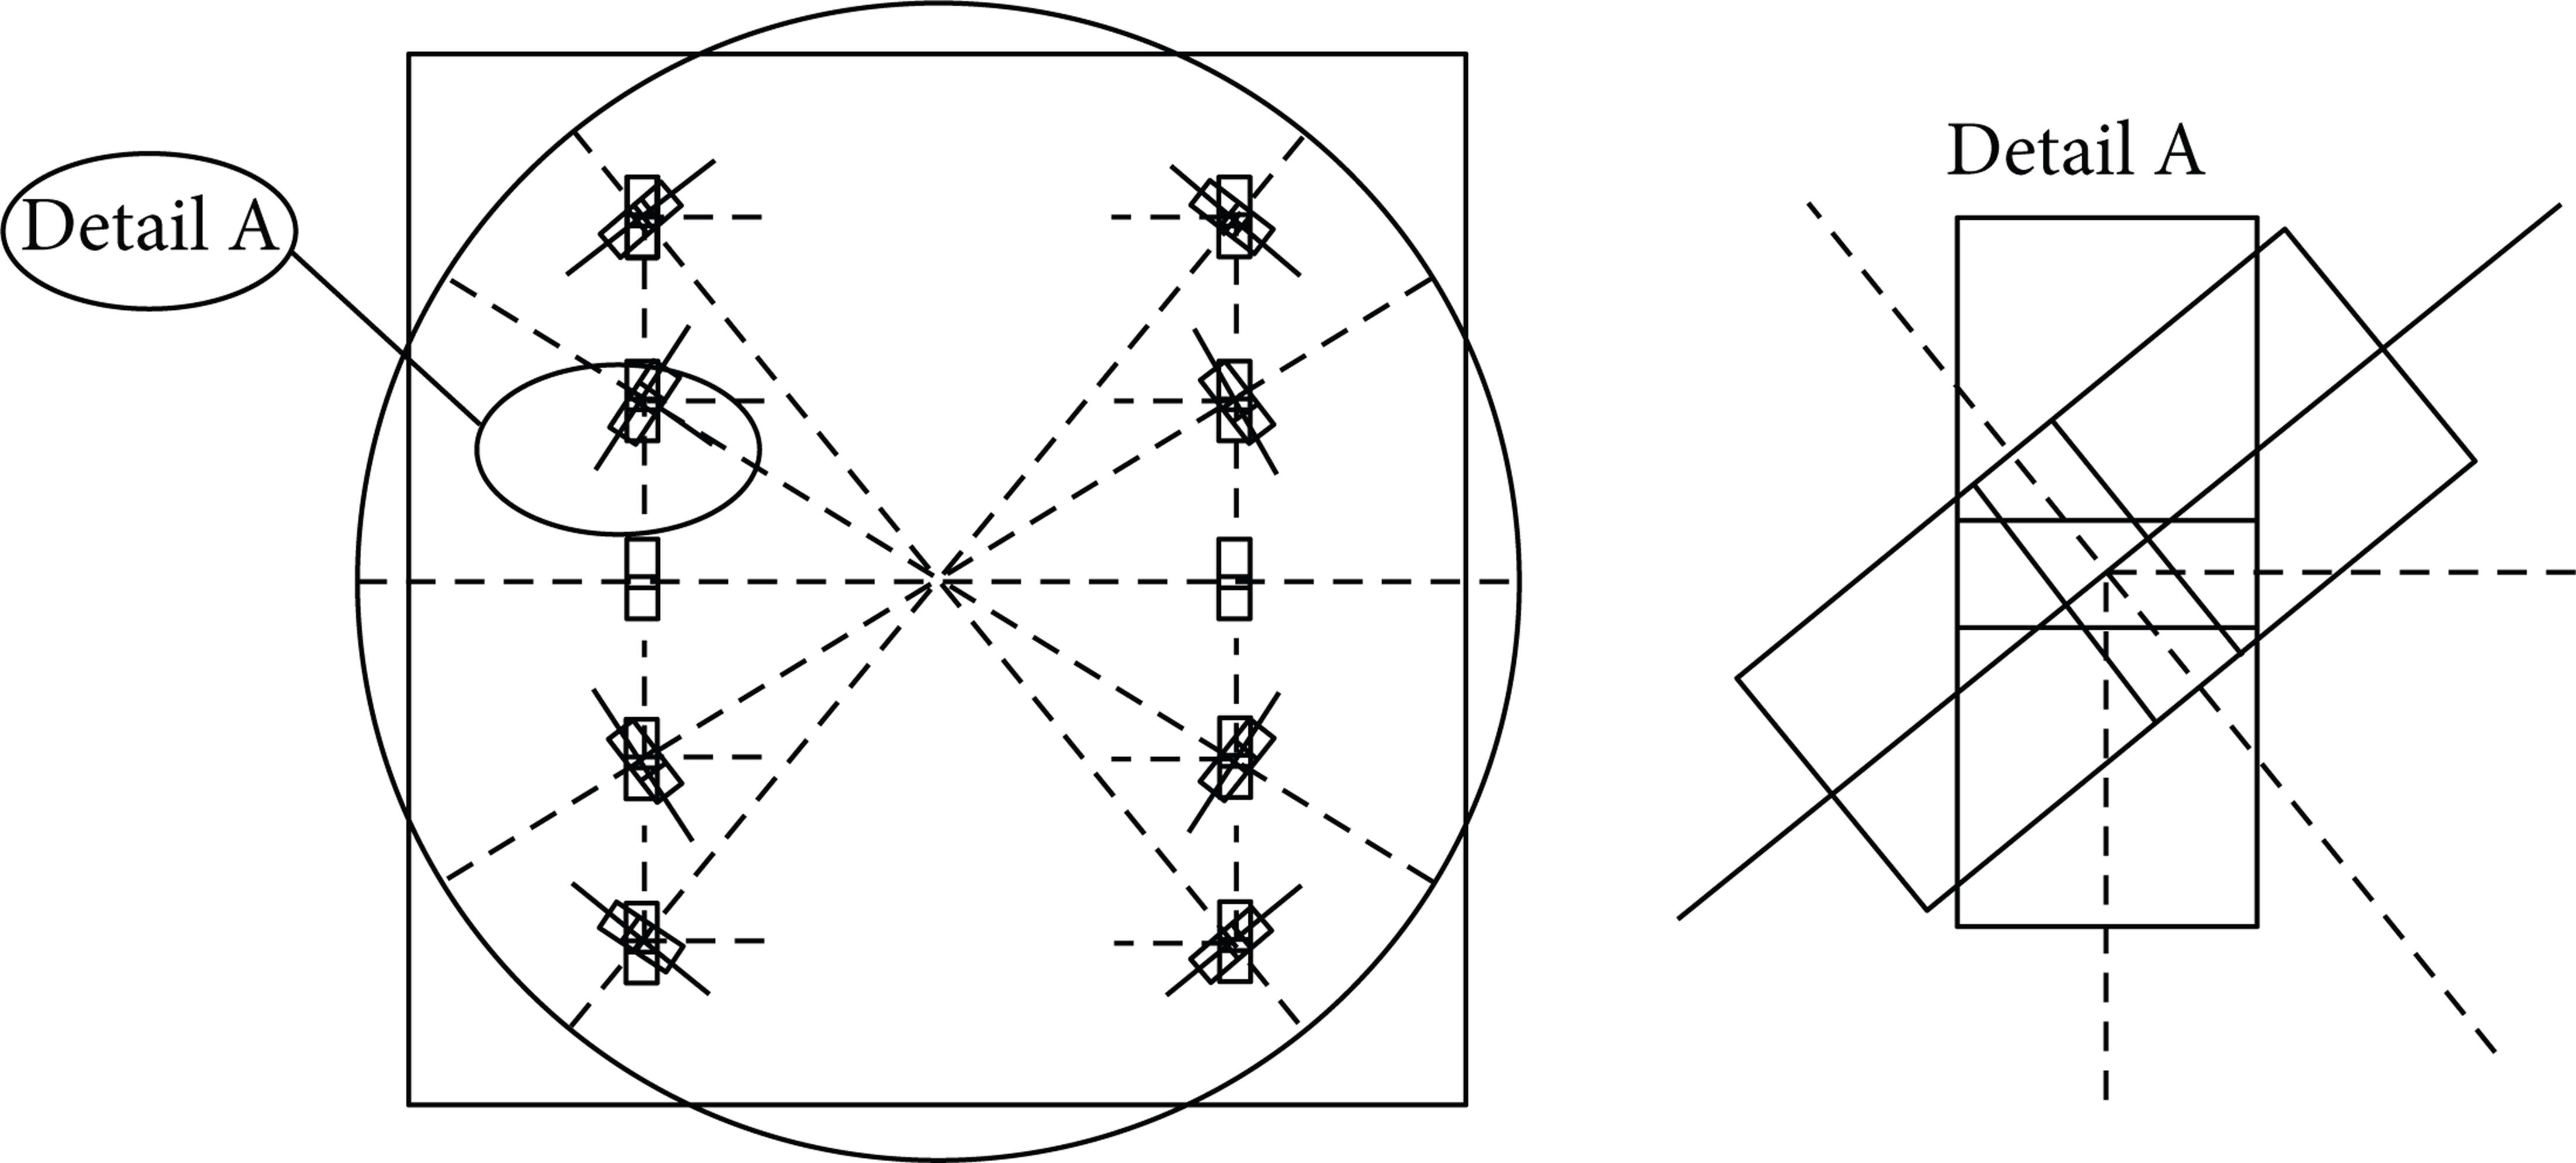
Schematic location of P-N pairs in circular model versus rectangular model (Detail A).
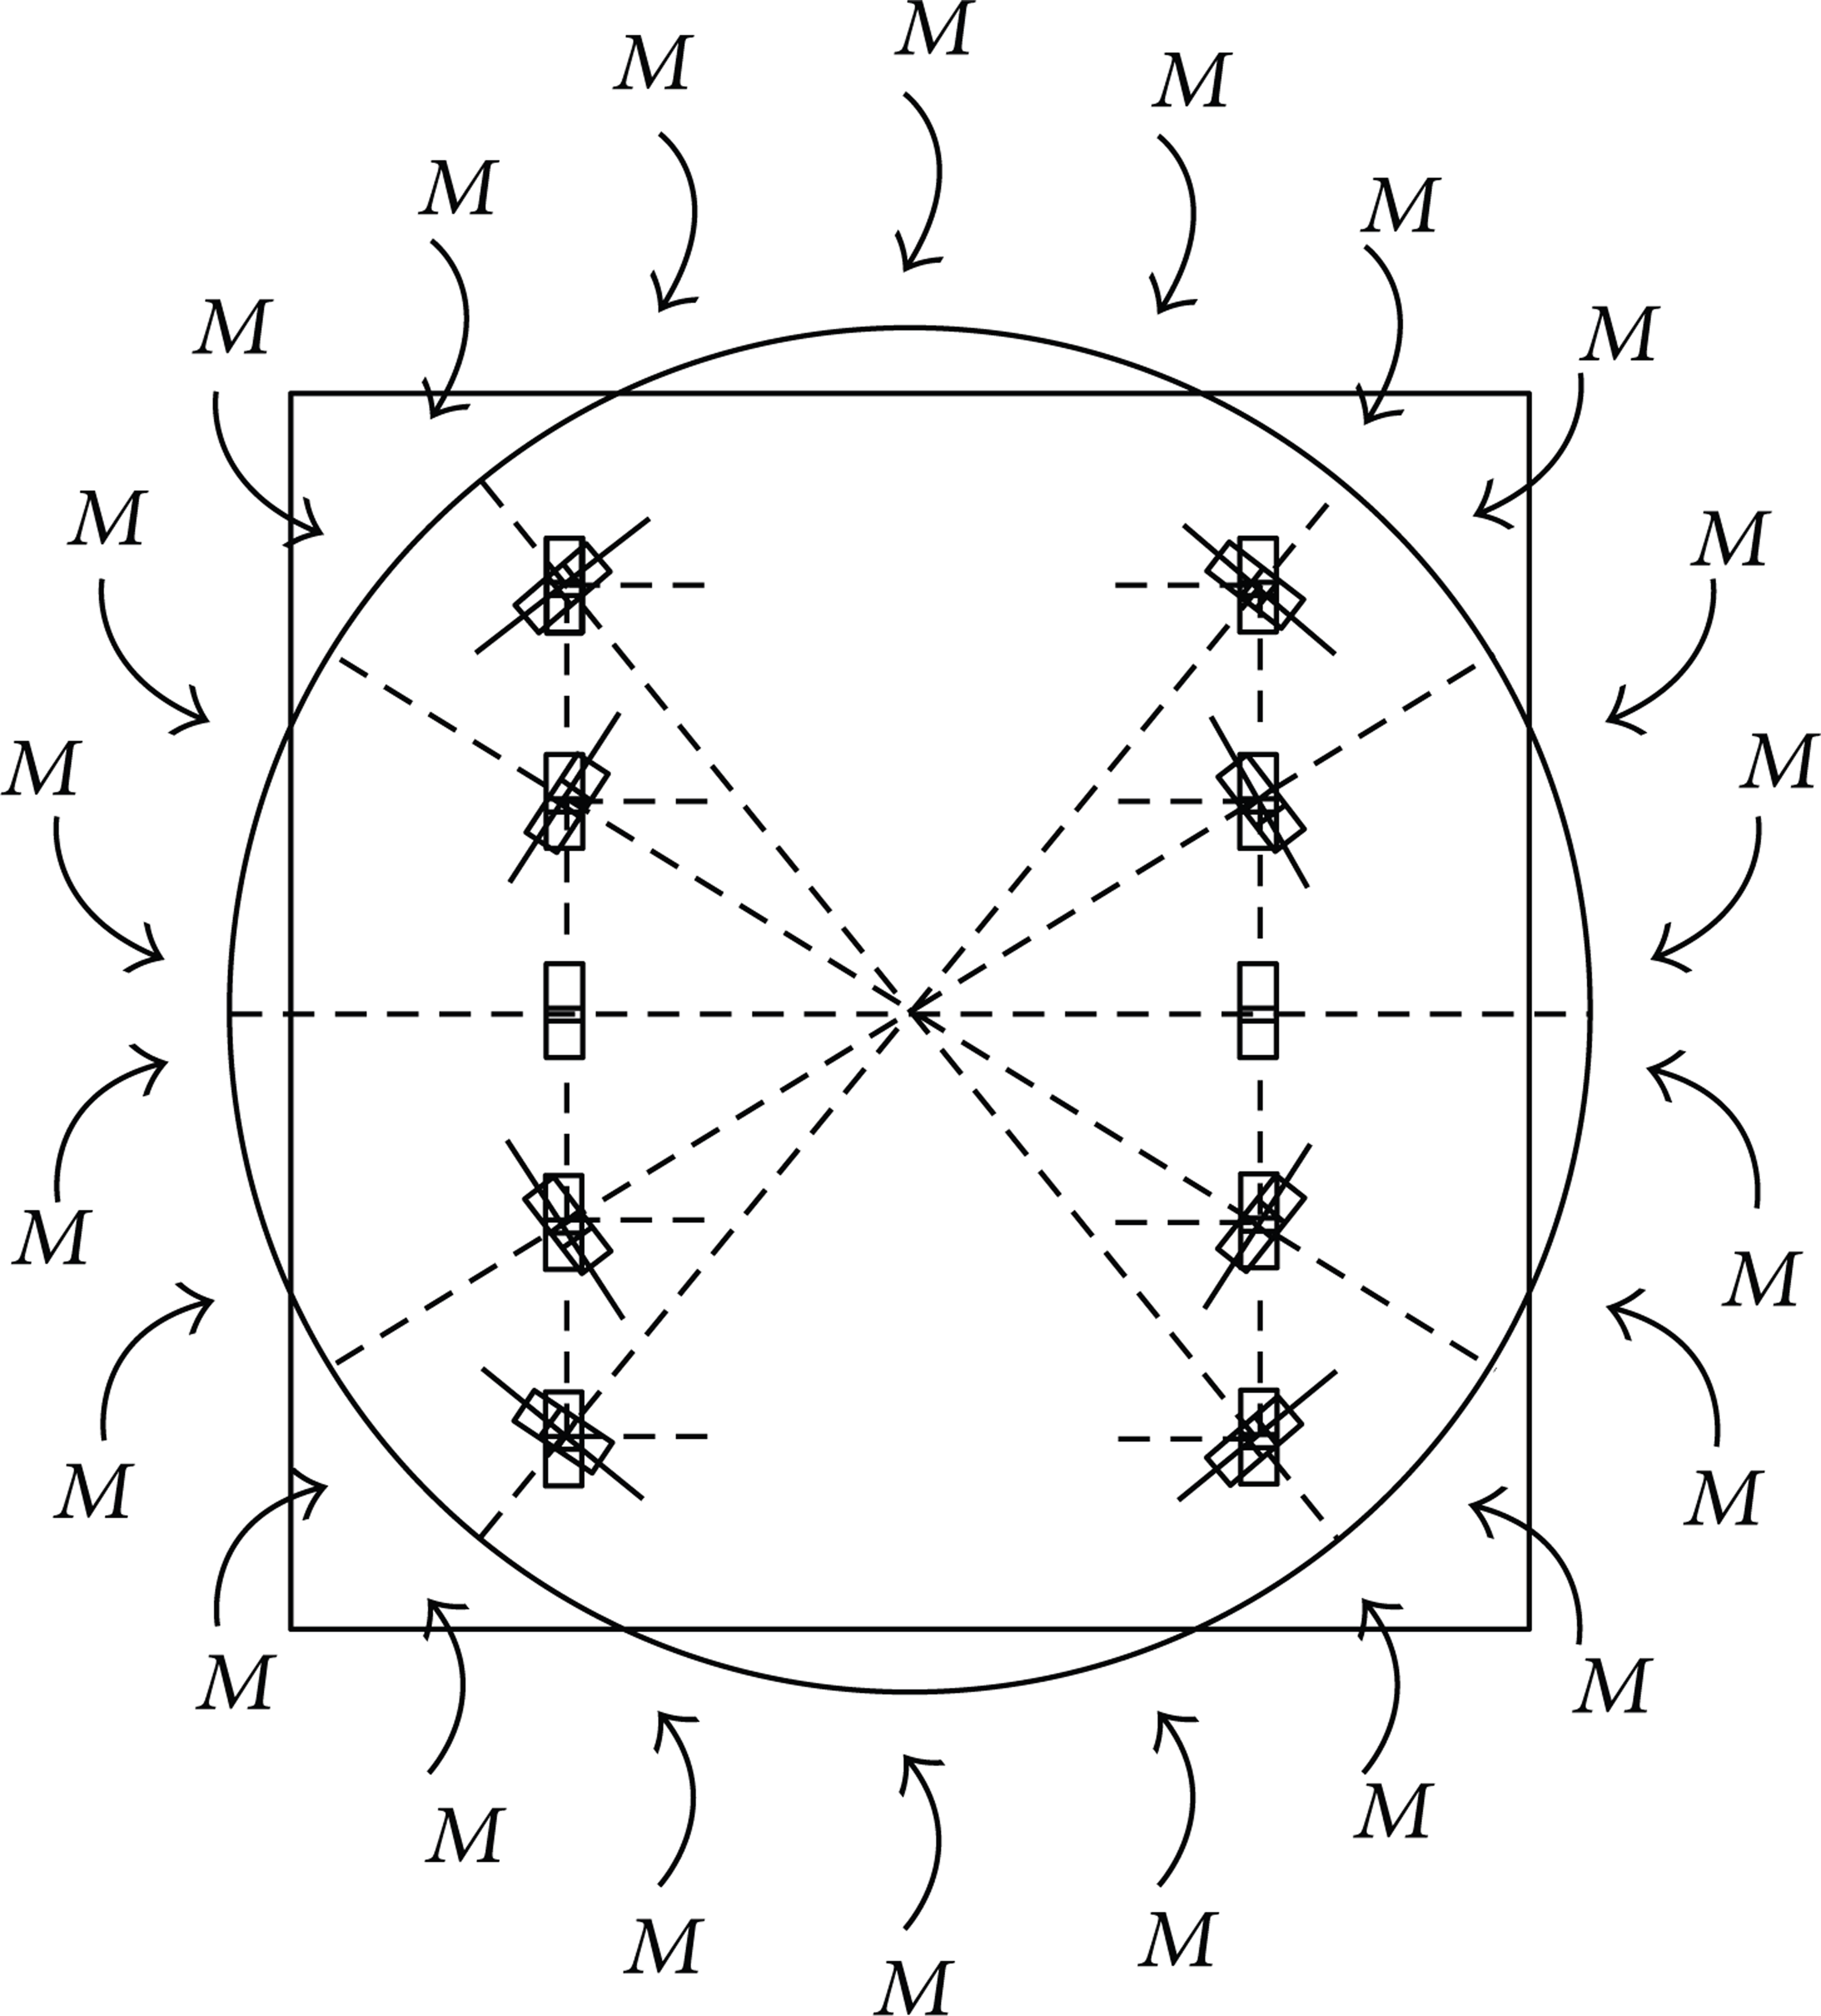
Imaginary imposed bending moment.
Figure 19 shows a typical P-N pairs that are subjected to the bending moment and their typical failure. The moment applied to the P-N pairs in the circular thermoelectric module is in a different direction to that applied to the rectangular thermoelectric module. Since the strength of the latter structure is weaker than the former in the direction in which the load is applied, it fails faster than the former structure. Therefore, the typical failure may be similar to that depicted in Figure 19.

Position of the imposed bending moment on a typical pair of P-N type material and their typical failure in the (a) circular and (b) rectangular geometries.
A structure always fails at its weakest part that is subjected to the most critical stresses. The stresses on the TE modules have to be investigated initially at the design stage before the module was manufactured. The temperature effects that generate some of the major stresses on the P-N pairs in both the rectangular and circular modules can be determined theoretically by using the beam theories as can be explained in the following sections.
3.3. Analytical Stress Calculations for TE Modules with the Thermomechanical Model
A simplified two-dimensional (2D) three-leg geometry, as shown in Figure 20, consists of the upper ceramic and the lower ceramic, and in between they are joined together with a series of three rectangular pairs of column just like those P-N legs in TE module. When subjected to a temperature change, the whole structure will deform resulting from the thermal mismatch of these constituting materials. Accordingly, the external and internal forces, stresses, and moments are induced in the structure.

Schematic illustrations of the effect from (a) global CTE mismatch and (b) local CTE mismatch.
Clearly, the analytical calculation of the thermally induced stresses for the individual units in a complete system is different from the calculations of stresses for the whole structure. Therefore to simplify the problem, thermal loading on a TE module is simulated by applying a bending moment (M) that gives the same deformation as those induced thermally. Later, this loading is transferred to the core materials (i.e., the P-N type material and copper pads) of TE module. The set of P-N legs and copper pads unit of a real TE module are treated as connected beams which has the same geometrical, material properties and the same boundary conditions. Throughout the calculations, bending moment M is directly used as an external loading in the formula to calculate the bending stress. And to calculate the shear stresses, this external loading is replaced by the transverse shear force P which was applied across the section.
For the calculations of the stresses caused by bending and shear loadings, it was assumed that (a) for a single pair of the material combination including the ceramic substrate and the P-N thermoelements, each set that consists of either P- or N-type thermoelements is considered to be isolated from each other; (b) the abovementioned stresses existed on a typical P-N pair in both circular and rectangular layout designs since the same location of them is chosen for comparison purposes. By referring to Figure 17, Detail A, it can be seen that the thermoelements examined from these two designs are at the same radial distance from the center of ceramic substrate and they are subjected to the same loadings. The resulted stresses based on the theoretical calculations for these two layout designs are compared with each other.
3.3.1. Relationship of the Bending Moment and Transverse Shear Stress
In addition to the pure bending case aforesaid, beams are often subjected to transverse loads (P) which generate both bending moments M(x) and shear forces V(x) along the beam. The bending moments cause bending normal stresses through the depth of the beam, and the shear forces cause transverse shear stress (τ) through the beam section as shown in Figure 21 [33].
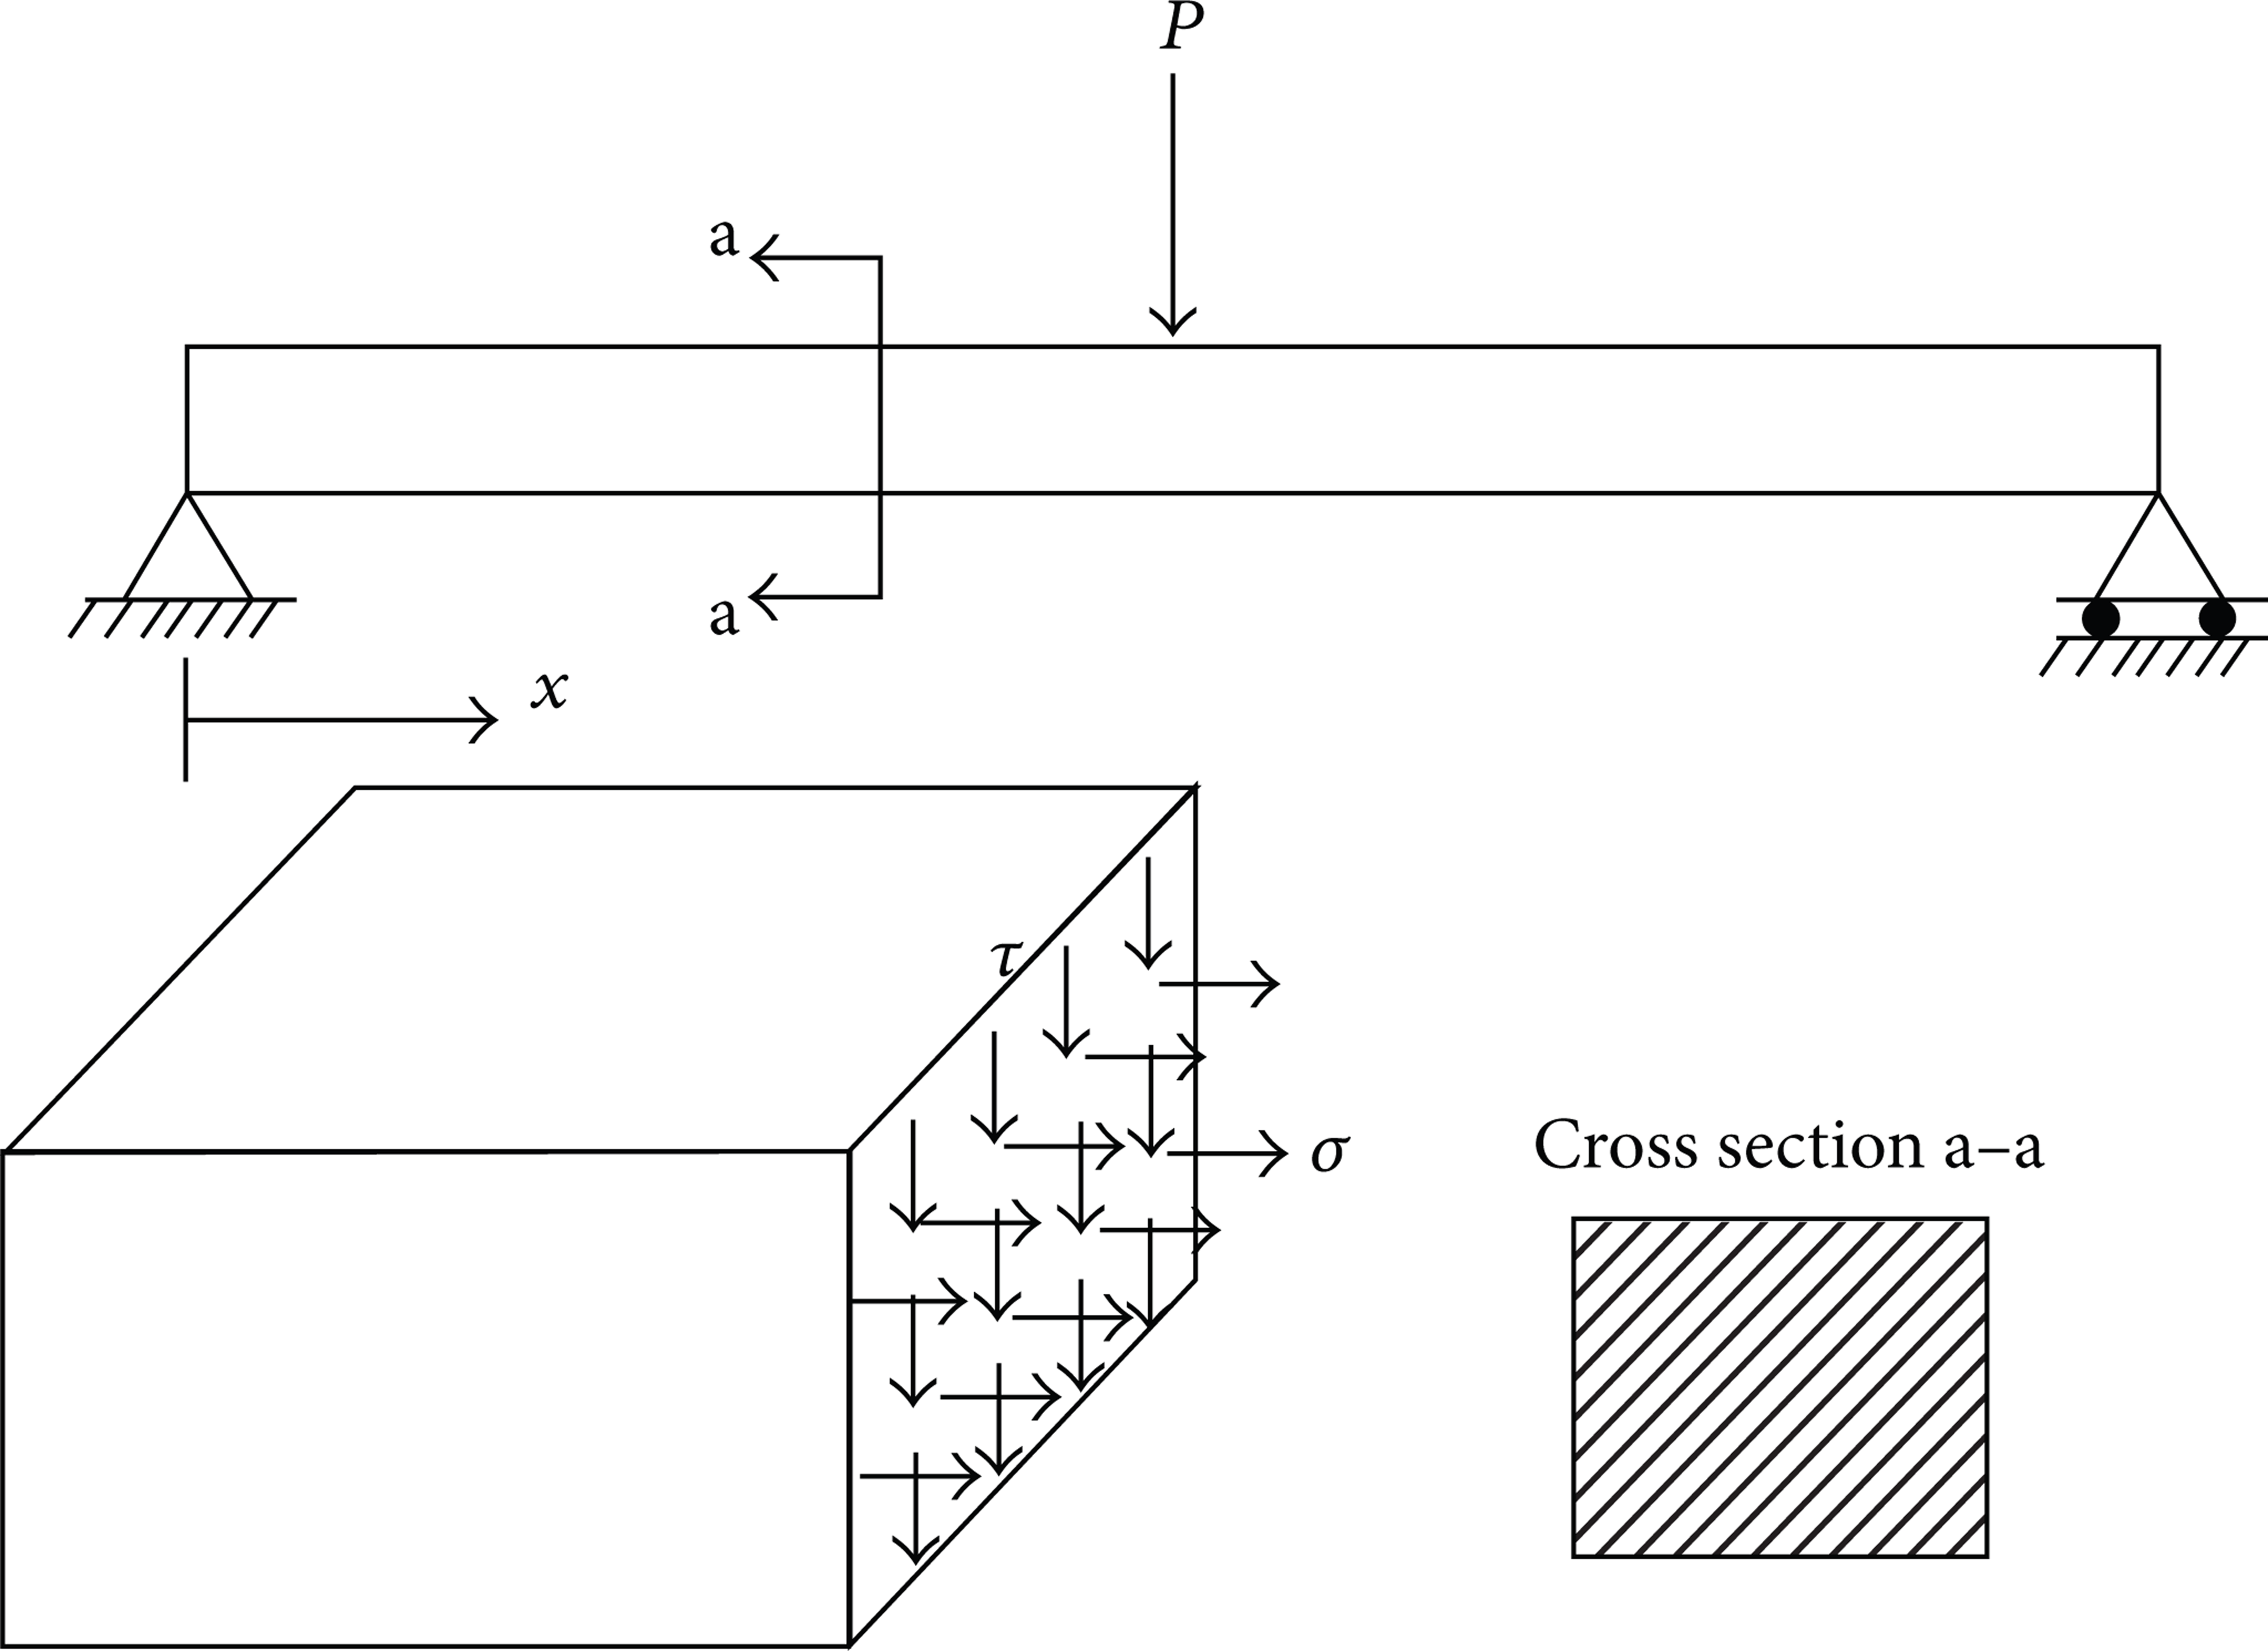
Schematic of a beam with an applied force P and the resulting stresses in both normal and shear directions.
Considering a simply supported beam as shown in the figure, the bending moment at a distance x to the left end is equal to M = P·x, and the normal stress at distance y from the center of the cross section is σ = My/I and the transverse shear stress in the beam cross section is calculated by τ = VQ/It or
(1) Calculations of Bending and Shear Stresses in a Rectangular Layout Design of Thermoelement. The bending and shear stresses on the P-N pairs in the rectangular thermoelectric modules can be determined theoretically using the beam theories [33]. The maximum bending stress on the structure that is subjected to moment M is calculated using

where M is the bending moment, c is the distance from the neutral axis to the surface, and I is the moment of inertia of area with respect to the neutral axis. As shown in Figure 19, since the moment of inertia I R < I C (R, for rectangular modules, and C, for the circular modules), thus the maximum bending stress σ R < σ C . The detailed calculations for finding the neutral axis, the moment of inertia, and bending and shear stresses are explained as follows.
The neutral axis of the cross section of rectangular TE module goes through the centroid of the area and is located at 0.225 mm from the top/bottom surface (which is at halfway in the height dimension). The moment of inertia of the area, I, is calculated using (4), where h is the height and b is the width of the cross section:
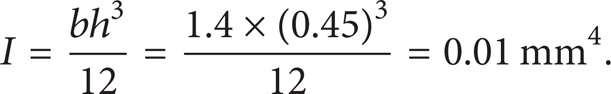
The stress that is generated by the bending moment M is given by σ max = Mc/I = 0.225M/0.01 = 22.5M.
In the same way, the maximum shear stress (τ
max
) can be obtained by realizing that τ
max
occurs where Q is largest. By inspection, Q will be a maximum when the whole area above (or below) the neutral axis is considered; that is, A = bh/2 and

Since M = P(L/2) at the center of the beam, then the relationship between τ max and bending moment can be written as follows:

(2) Calculations of Bending and Shear Stress in a Circular Layout Design. The normal and shear stresses on the P-N pairs in the circular thermoelectric modules can be theoretically determined using beam theories similarly. The cross section of this case must be treated as a composite beam (Figure 22), because it consists of materials with different Young's moduli. This difference in Young's moduli causes a shift in the neutral axis under a bending load. Such a problem can be solved using an equivalent beam. The basic idea is to keep using one of the areas as a reference while ignoring another area by substituting it with an equivalent dimension from the reference material such that the resulting structure has the same functionality as the original structure.
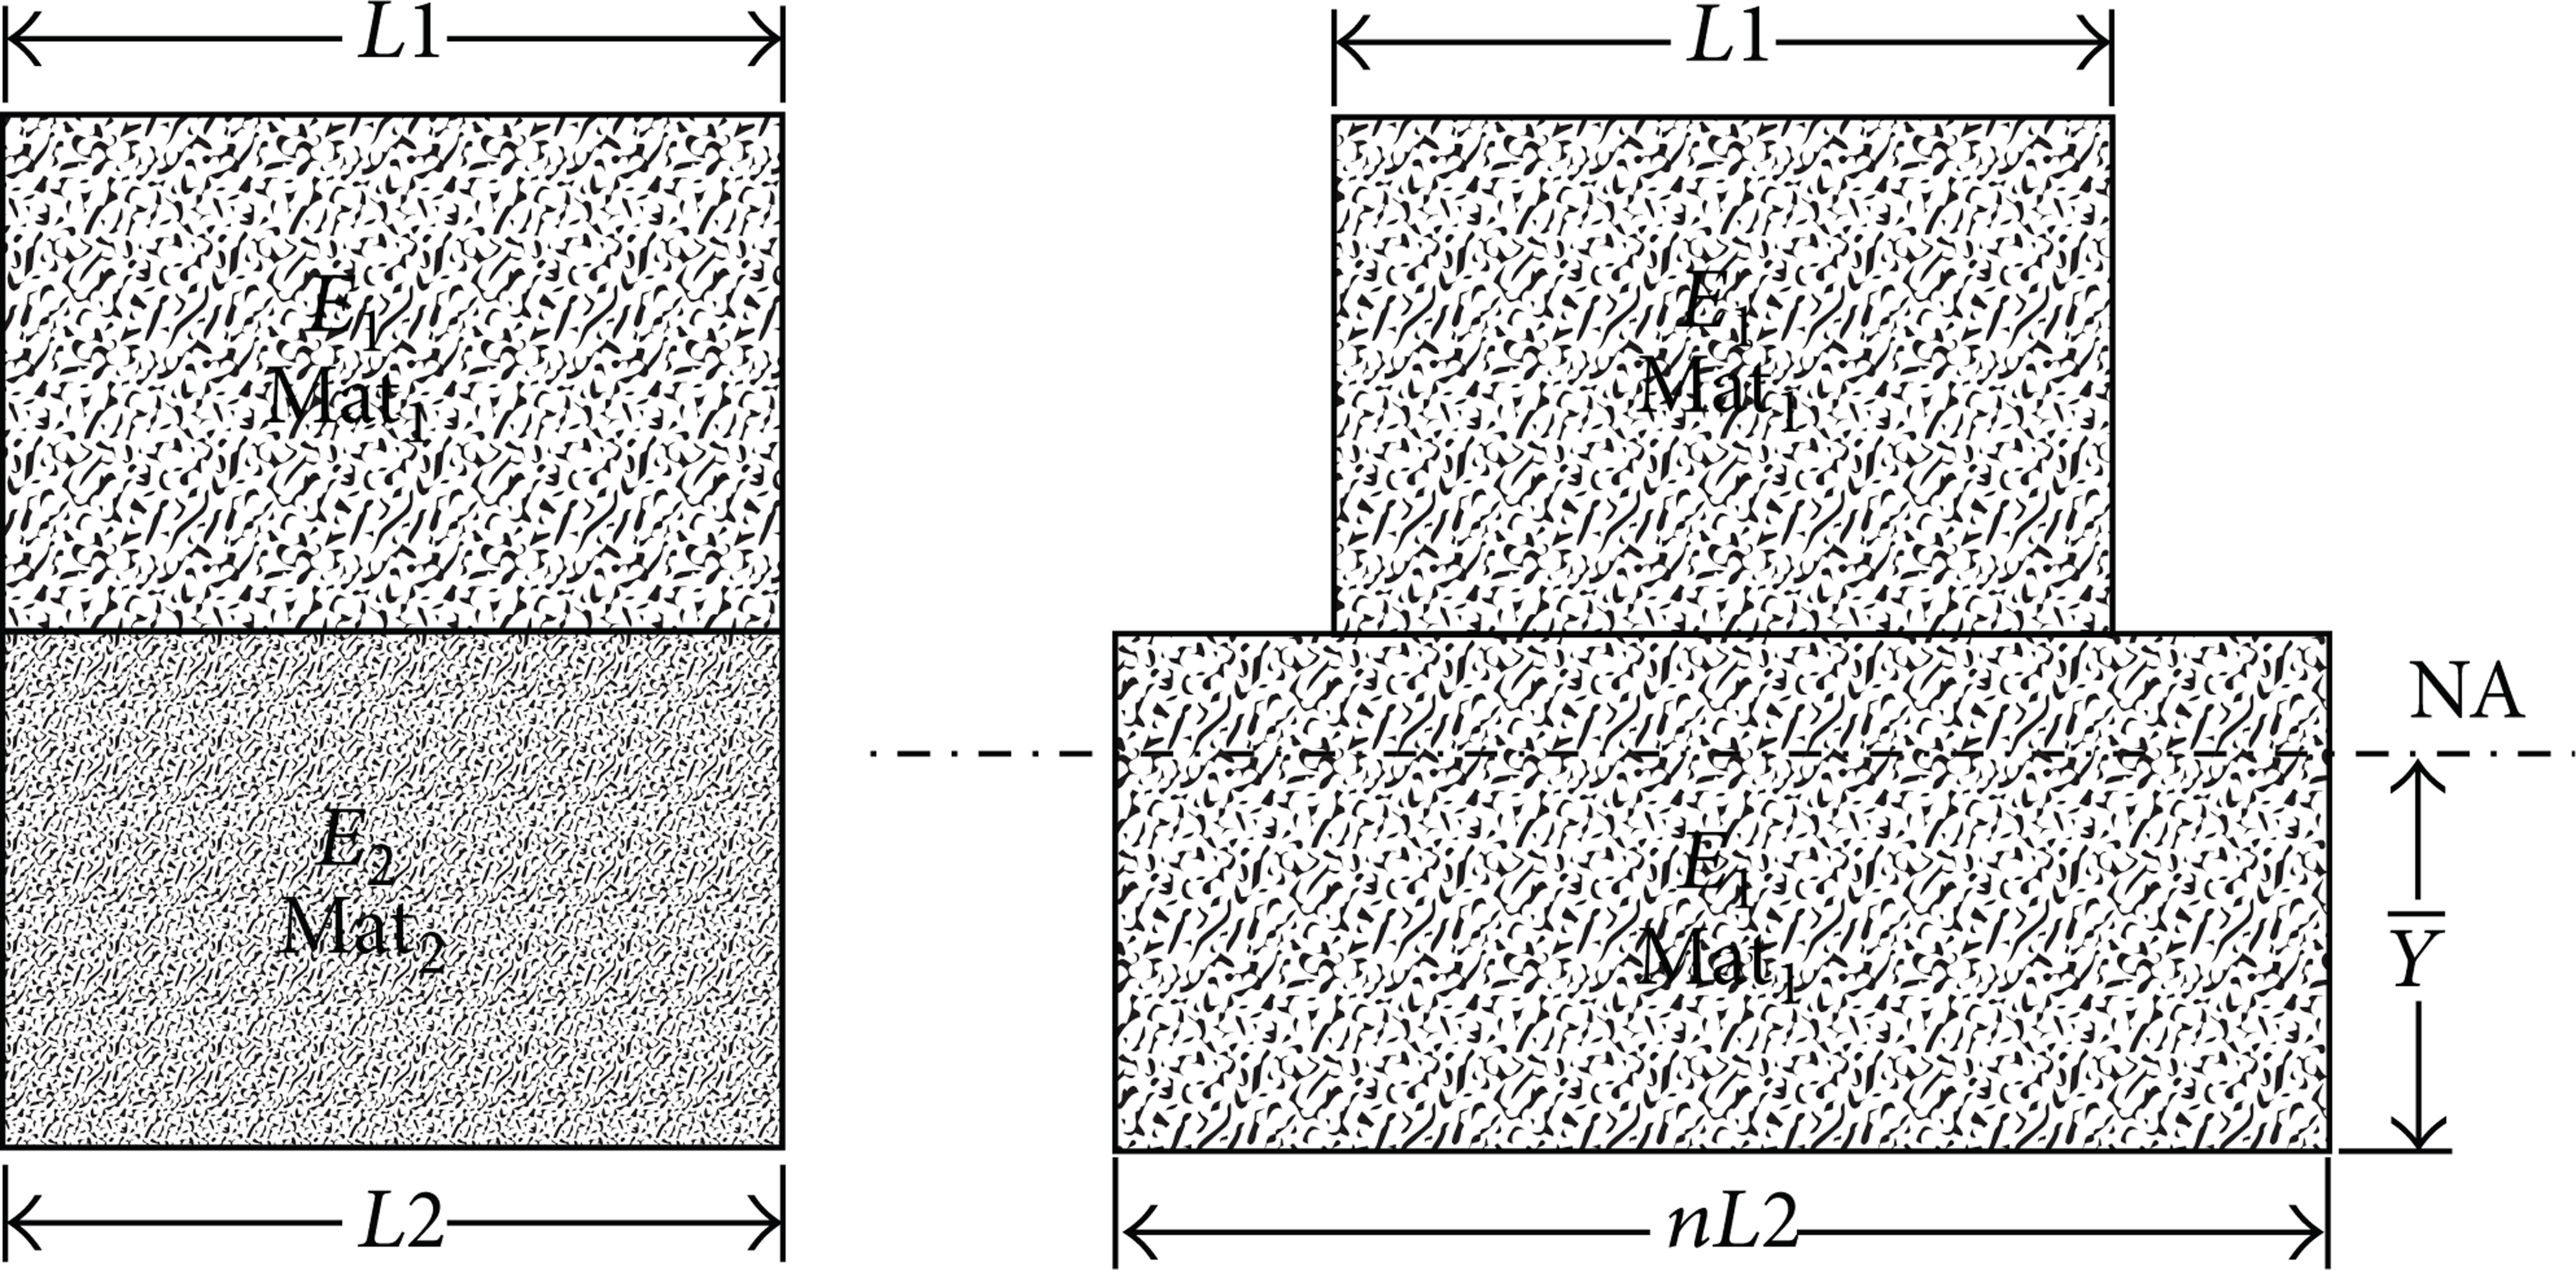
Equivalent structure of composite section. (a) Original structure; (b) equivalent structure.
Consider a structure that comprises two materials, Mat1 and Mat2, with corresponding moduli of elasticity E1 < E2. The expansion factor (n) when Mat2 is replaced with Mat1, as shown schematically in Figure 22, can be calculated using

Hence, taking Mat1 as the reference material, the equivalent area for Mat2 should be the area of the second material multiplied by the expansion factor (n).
Since the height must remain the same as before in this method, the original width of the second material is multiplied by the expansion factor to yield a new equivalent width based on the reference material. Hence, before the transformation, the second material has a height of h and a width of L2. It maintains the same height with a new equivalent width of nL2 following the transformation [33].
Figure 23 presents the cross section of P-N pairs in the circular TE module. The goal is to find the equivalent structure by replacing the cross section of the original structure with the relevant cross section. With reference to Table 4, Young's modulus of P-type material E1 equals that of N-type material E2(E1 = E2) and Young's modulus of the copper pad is E3. If the P-N-type elements comprise the reference material, then the expansion factor, n, of copper is obtained using (7):


Cross section of circular TE module.
Figure 24 shows the resulting equivalent section of the structure, where T and B indicate the top and bottom of each material. Later, this figure will be used to calculate the bending stress in sections 1 to 5 in the figure.

Equivalent section for calculating of bending stress.
The new beam is now made of a single material and the problem can be solved for stress using the usual method. The first step is to determine the centroid of the equivalent cross section,

where

The common stress equation can then be used to calculate the tensile and compressive stresses in that final equivalent structure. Since the expanded section that replaces the original section is increased by a factor of n in one direction, the area is also increased by the same factor. The stress in the original section is then calculated by multiplying the final stress by a factor n. The forgoing resulting equivalent moment of inertia can be used to calculate the stress in the unexpanded (original) section [33].
To calculate the bending stresses in the P-N-type and copper materials, with reference to Figure 24, if y is the maximum distance from the top and bottom surfaces to the neutral axis, then, when subjected to a bending moment M, the bending stresses in the copper materials are [33] as follows:

where all these stresses are the maximum bending stress on the top and bottom surfaces for each of the sections. (i.e., the subscripts T and B represent the top and bottom surfaces of each section and 1, 2, and 3 are the corresponding section numbers).
The bending stresses in the P-N-type materials are [33]
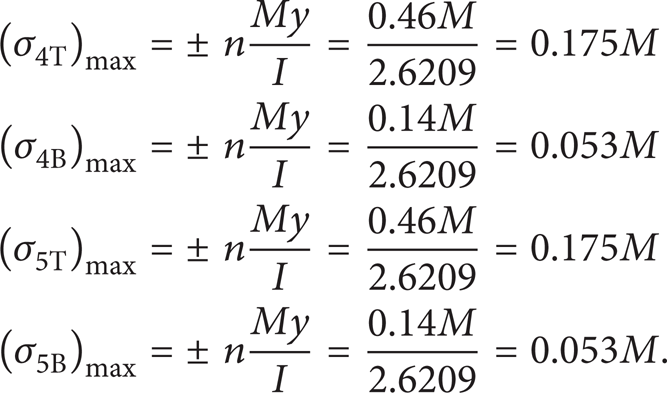
The maximum stress of the rectangular module is 22.5M and that of the latter is only 1.312M. The maximum stress of the circular design is only 5.83% compared to that of the rectangular design.
Similar to the previous section, and by using the same equations, we calculated the maximum shear stress in the cross section of circular TE modules (Figure 25).

Equivalent section for calculating of shear stress.
Thus,

where area A is the summation of all areas located above the neutral axis. Since thickness of the cross section varies in the vertical direction to the top of the beam, τ max should be calculated in two thicknesses: (1) b = 1.4 mm; (2) b = 12.474 mm:
Case (1):
Case (2):
And M = P(L/2); then the relationship between τ max and bending moment can be rewritten as follows:
Case (1):
Case (2):
The maximum shear stress of the rectangular module is 1.265P and that of the latter is only 0.56P and 0.06P. It can be seen that the maximum shear stresses of the circular design are only 44.2% and 4.74% compared to those of the rectangular design.
4. Conclusion
This study investigates the feasibility of improving the structural integrity of thermoelectric modules (TEMs) with varying geometry. For this purpose, six different TEM models with various thermoelements arrangements geometries were designed and modeled in order to perform a thermal stress FEA using ANSYS Workbench. Temperature dependent material properties were used since some properties such as yield strength and tangent modulus change with temperature.
Significant decrease in thermal stresses and total deformations were observed with some models. Particularly, the circular geometry (model number 2) has approximately 13% lower von Mises stresses, shear stresses, and 42% lower TE total deformations than those of the typical rectangular TE geometry model.
In all cases, the maximum stresses occurred around the edges of the copper plates, close to the hot ceramic plate. The higher stress levels around the corners zones were caused by stress concentrations, whereas those at the junctions of two materials were caused by the mismatch between the thermal expansion coefficients. The temperature distribution on the cross-sectional areas of the module varies smoothly from the hot side to the cold side.
In order to prove that our finite element analysis is correct, two experiments have been done on an existing TE module: (1) shear test for stress analysis and (2) shadow moiré technique for deformation analysis. The results obtained from above experiments are then compared with the results obtained from their simulated model in ANSYS Workbench. There is pretty good agreement between manual calculation, experiments, and simulation results.
In addition to all these, theoretical calculations of the stresses result from the bending moment and transverse shear force on the P-N pairs for each of these two layouts reveal that the maximum normal stress in the circular layout is only 5.83% compared to that obtained in the rectangular design, and the stresses as a result of shear force in the circular model are only 44.2% and 4.74% compared to those calculated in the rectangular one. Besides, the effects of the P-N pairs arrangement for the bending stresses on the modules were theoretically studied by evaluating the moment of inertia in different loading directions. The results indicated that the moment of inertia for the circular module greatly exceeded that of the rectangular module. Therefore, the circular module design reduced the maximum bending stress considerably, which is inversely proportional to the moment of inertia.
Overall, changing the module geometry reduced the maximum stresses levels and the total deflections. Accordingly, the mechanical performance and lifetime of the thermoelectric module are improved.
Although the initial conceptual design has been proven to be effective using finite element analysis, the details of the performance of this new design still need to be studied. Planned future work will include the manufacture of a real module, based on all of these analyses, to practically test its thermoelectric performance and lifetime.
Conflict of Interests
The authors declare that there is no conflict of interests regarding the publication of this paper.
Footnotes
Acknowledgment
The authors would like to thank the Energy and Environment Research Laboratory, Industrial Technology Research Institute, Taiwan, for their support of this research.