
Abstract
In order to assess the life of gas turbine critical components, it is essential to adequately specify their aerothermodynamic working environments. Steady-state analyses of the flow field and conjugate heat transfer of an internally air-cooled nozzle guide vane (NGV) and shrouds of a gas turbine engine at baseline operating conditions are numerically investigated. A high-fidelity CFD model is generated and the simulations are carried out with properly defined boundary conditions. The features of the complicated flow and temperature fields are revealed. In general, the Mach number is lower and the temperature is higher on the NGV pressure side than those on the suction side. There are two high temperature regions on the pressure side, and the temperature across the middle section is relatively low. These findings are closely related to the locations of the holes and outlets of the cooling flow passage, and consistent with the field observations of damaged NGVs. As a technology demonstration, the results provide required information for the life analysis of the NGV/shrouds assembly and improvement of the cooling flow arrangement.
1. Introduction
It is a promising approach to assess the remaining life of gas turbine critical components based on their operating conditions and service history by applying aerothermodynamics and structural and material analysis methods. This approach has been investigated by researchers from various disciplines under a major collaboration program, the Integrated Gas Turbine Engine Performance and Life Model program [1]. The ultimate goal is to develop a prognostic and health management (PHM) capability for gas turbine engines so that the expense of maintenance/repair can be reduced, the engine fleet operation can be made more reliable, and their service lives can be extended.
One of the technology demonstration cases involves an internally air-cooled nozzle guide vane (NGV) of a practical gas turbine engine. Due to the continuous demand for high efficiency [2], the NGV is always exposed to high-temperature and high-pressure environments, and the flow parameters around and inside the NGV vary significantly. A higher temperature reduces the fatigue strength of the material, while a larger gradient increases the thermal strain excursions and causes higher stresses. Both can reduce the NGV fatigue life. Therefore, for satisfactory life analysis, reliable working environments for the NGV are required.
Due to the harsh conditions, experimental measurements inside the engine are extremely difficult. Computational flow dynamics (CFD) methods are routinely used and validated for predicting the aerothermal loads of engine critical components. The conjugate heat transfer analysis between the NGV/shrouds and the flow from the combustor of a power generation gas turbine was conducted by Mazur and coworkers [3]. They pointed out that it was possible to assess the nozzle remaining life based on the computed thermal loads, stress, and creep strain analyses. However, in the paper, the thermal boundary conditions of the shrouds were not mentioned. Charbonnier and coauthors [4] validated the heat transfer prediction with the measured data for a film-cooled linear cascade. They found that the CFD predictions were in good agreement with the measurements of the vane surface Mach number, film cooling row discharge coefficients, wall heat flux, and the adiabatic film cooling effectiveness. Heidmann and coworkers [5] developed a conjugate heat transfer solver where no grid was required inside the solid regions, which applied to the middle-span section of a realistic film-cooled turbine vane for a number of blade materials. It was found that the complicated heat transfer in a film-cooled vane was not governed by simple 1D conduction from the vane surface to the plenum surface, especially when the effects of coolant injection were considered.
Despite being a routine practice in industry, high-fidelity CFD modeling of internally air-cooled nozzle guide vanes and shrouds with well-defined boundary conditions is rare. The reasons may be threefold. First, the geometry of practical NGV/shrouds is complicated, particularly for the internal cooling flow passages. Second, for accurate heat transfer prediction fine mesh near walls is required [6] and as a result the mesh size is rather large even for a single NGV/shrouds assembly. Third, there are some difficulties in obtaining relevant boundary conditions, where the combustor flow and secondary air-cooling flow are involved. As mentioned by Harsqama and coworkers [7], the secondary air-cooling flow has significant effect on the end-walls of an air-film-cooled NGV.
As a benchmark case, the flow field and conjugate heat transfer of the internally air-cooled nozzle guide vane of a practical gas turbine engine is investigated at baseline operating conditions. The high-fidelity CFD model, complex flow fields, and temperature distributions inside/around the NGV are presented and discussed. Finally, a few highlights are included.
2. High-Fidelity CFD Model of Air-Cooled NGV
2.1. Internally Air-Cooled NGV and Shrouds
The gas turbine engine has a can-annular-type combustor, six combustion cans are housed in an annular chamber, and sixty NGVs are located at the exit of the combustor. Figure 1 illustrates the geometry of an internally air-cooled NGV with internal and external shrouds. It is a 6-degree sector corresponding to the coordinates of the whole combustor, and the periodic surfaces of the geometry are rotated twice to avoid cutting through the NGV body. As shown in Figure 1(a), the main flow, hot gas mixture, from the combustor flows over the NGV body, while the cooling air from the annular chamber of the combustor enters the NGV body through the air-inlet above the flat plate of the internal shroud, passes through the cooling slot into the cooling chamber, exits at the four square air-outlets, merges with the main flow, and eventually flows out of the flow domain. Figure 1(b) shows a portion of the NGV body and cooling flow passage inside the NGV. Cooling air flows through the thin-wall slot and enters the cooling chamber through seven holes with six facing the NGV leading edge and one looking downstream. On either sides of the cooling chamber, there are twelve cooling fins to enhance the heat transfer between the cooling air and NGV body. Through impingement and convection, the cooling air absorbs heat from the NGV walls and lowers their surface temperature. As indicated in Figure 1, the high-fidelity geometry of the NGV and shrouds is maintained in the present work. For example, the curved 3D internal/external surfaces between the NGV body and shrouds are retained.
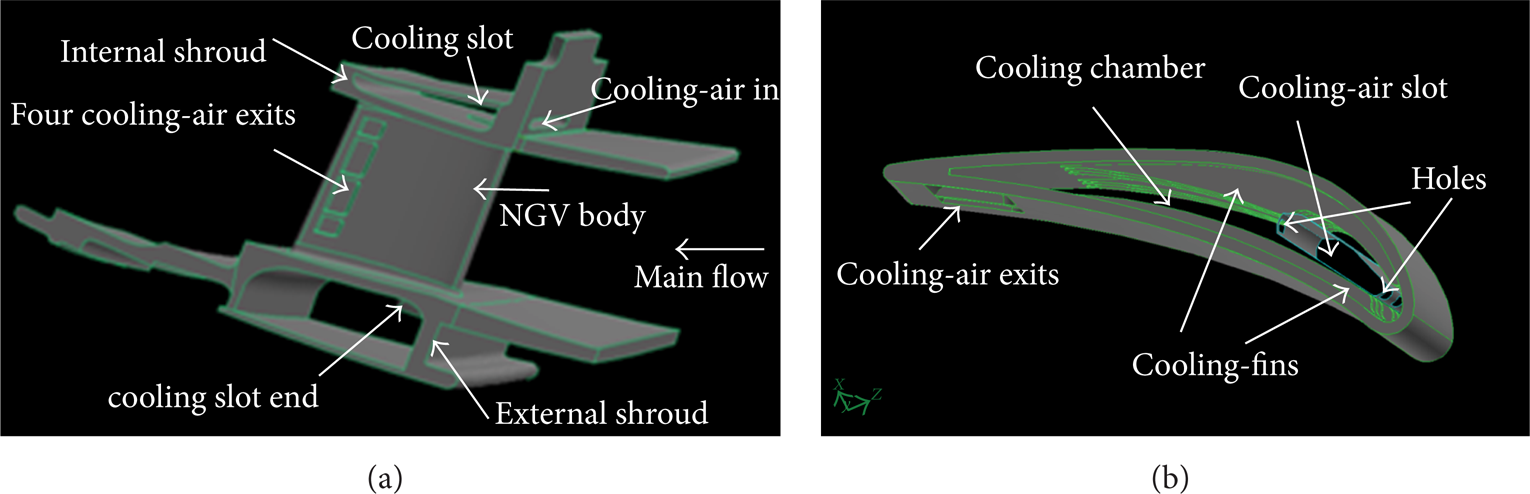
NGV/shrouds assembly: (a) a single NGV and shrouds and (b) cooling chamber, cooling fins, and cooling air slot inside the NGV.
2.2. Computational Domain and Mesh
The computational domain and mesh are given in Figure 2, and tetrahedral mesh is used in the middle portion of the computational domain. Both fluid and solid meshes are illustrated in (a) and for clarity only the solid mesh is given in (b). Figure 2(c) shows the mesh at one middle cross-section, where the flow and solid meshes are separated by the outlines (in black) of the NGV cross-section. It is apparent that fine grids are generated inside the NGV body and the flow regions around the NGV in order to properly solve the conjugate heat transfer between the fluid and solid regions. The computational domain begins upstream of the flat plates of the internal and external shrouds, as shown in Figures 1(a) and 2, and the flow domain is extended by half of the NGV chord length downstream of the shrouds. The original CAD file of the geometry was created from laser scanned cloud of points and posed difficulties to mesh generation. A few meshes were created and preliminary runs were performed to improve the quality of numerical simulations. Finally, a mesh with 6.3 million cells is used for all simulations. Fine nodes are laid near the NGV internal and external walls, fins, holes, and cooling-air slot, while course nodes are used in the flow regions away from the NGV walls. For the baseline operating conditions, the nondimensional wall boundary parameter, y+, varies from ∼0 to 25 at the NGV internal walls, fin, and cooling slot walls, 5 to 35 for the NGV external walls, and 5 to 130 for the shroud walls.

Computational domain and mesh: (a) flow and solid mesh, (b) solid mesh, and (c) mesh at one middle cross-section.
Since the main purpose of the present work is to provide adequate results of conjugate heat transfer between the NGV body and internal cooling flow/external hot flow, the mesh independent issue was checked by simplified 2D simulations. In these simulations, the computational domain consisted of a flat metal plate and its thickness is equal to the mean value of the NGV body. A hot flow with the temperature and velocity equal to those from the combustor passed over one side of the plate and a cooling flow with the temperature and velocity corresponding to the NGV simulation flowed across another side of the plate.
The mesh size and result for each case are shown in Table 1. All meshes are rectangular ones. Grids are uniformly distributed in both coordinates for Mesh-1 and Mesh-2, while for Mesh-3 and Mesh-4, fine grids are laid near walls and gradually expanded away from the walls.
Variation of hot wall temperature with y+ value.

In Table 1, the hot wall temperature for y+ ≈ 0.5 (Mesh-4) is considered as the best result; Δt denotes the difference in wall temperature between Mesh-4 and other meshes; and Δt/t stands for the relative deviation from the best result (Mesh-4). It shows that in the tested range of y+ values (0.5–200), the maximum deviation is only 1.3%. Almost identical numbers of Δt and Δt/t are observed for the cooling side wall, although they are not listed here. As mentioned earlier, y+ values vary from ∼0 to 35 around the NGV and from 5 to 130 at the shroud walls for the present study, and therefore the mesh used in all simulations is considered good enough for wall temperature assessment.
3. Numerical Simulations
Steady compressible turbulent thermal flows are considered in the present work. A commercial software package, Fluent, is used for all numerical simulations. The numerical methods, boundary conditions, and solution methods are briefly described in the following subsections.
3.1. Numerical Methods
The governing Favre-averaged conservation equations for mass, momentum, and energy are not reproduced here. They can be readily found in the literature, such as in [8, 9]. Both viscous heating and radiation heat transfer in the energy equation are neglected in the present work, since their effect on the flow field in the vicinity of the NGV is negligible.
Turbulent transfers in the flow are modeled by the SST k-ω model (the shear-stress transport model). It has illustrated major improvements in the prediction of adverse pressure gradient and separation flows over the standard k-ω and k-ε models [10] and has been successfully applied to the heat transfer calculation of a film-cooled linear cascade, showing good agreement with the measured experimental data [4].
In practice, maintaining a prescribed value of y+ in wall-adjacent cells throughout the domain for complex industrial devices is difficult. To make numerical results insensitive with respect to wall mesh, an automatic wall treatment is formulated for the SST model in Fluent [9]. Based on local y+ values, it switches automatically from the viscous sublayer formulation to the fully turbulent region treatment, while in the buffer layer, a blending function is applied.
For the present study, the thermal properties of air are used for the gas mixture since the overall fuel-air ratio is low for gas turbine combustors [2]. Polynomials as a function of temperature are used to calculate the specific heat of the fluid. For the molecular viscosity and thermal conductivity, the values for air at the temperature averaged over the domain are used. The specific heat and conductivity of Hastlloy X alloy are also calculated using polynomials.
3.2. Boundary Conditions
The inlet boundary conditions are obtained from a benchmark simulation of the gas turbine combustor at the baseline operating conditions. The simulation is similar to those in [11], where the compressible, two-phase, reacting flow field of a 60-degree sector of the can-annular combustor with ten NGVs (no internal cooling flow passages) is solved. The mean total pressure and temperature obtained at the corresponding location are used as the inlet boundary conditions of the main flow (see Figure 2). As mentioned before, the cooling air for the NGV is from the annular chamber of the combustor. The pressure and temperature values at the ten cooling-air slots of the ten NGVs are used to define the cooling-air inlet conditions for the NGV/shrouds study. The corresponding cooling flow rate is 2.3% of the total inlet air flow. A radial equilibrium pressure distribution is defined at the domain exit to account for the effect of flow tangential velocity on the exit pressure distribution. The Reynolds number based on the chord length and inlet flow condition is 1.0 × 10⁵.
The thermal boundaries on the outer surfaces of shrouds were assessed based the secondary air flow information (Mach number and flow temperature) of [12]. A 2D simulation was performed, where the the streamwise cross-sections of the internal/external shrouds remained, the NGV body was removed from the main flow, and two additional flow zones adjacent to the internal and external shrouds were included in the computational domain. The obtained wall temperatures are used at the outer surfaces of the NGV/shrouds assembly. An estimated turbulence intensity of 10% and hydraulic diameters are used to estimate turbulence kinetic energy and specific dissipation rate at the inlets. Periodic boundaries are defined at the side surfaces of the 6-degree sector.
3.3. Solution Methods
A coupled (pressure-based) solver with a second-order accurate scheme was used to resolve the flow field. At convergence, the scaled residuals were less than 4 × 10⁻⁵ for velocity components and energy and about 6 × 10⁻⁴ for turbulent variables. The monitored mass flow rate at the four square exits of the internal cooling flow passage remained unchanged at least for the first three digits. This ensured that the flow field reached steady conditions. A 2-node LINUX cluster, with 64-bit, 2.6 GHz, 12-Core, and 64 GB RAM per node, was used to carry out all simulations.
4. Results and Discussion
Some of the results in the vicinity of the NGV/shrouds at the engine baseline operating conditions are presented and discussed in the following subsections.
4.1. Flow Field of the NGV/Shrouds
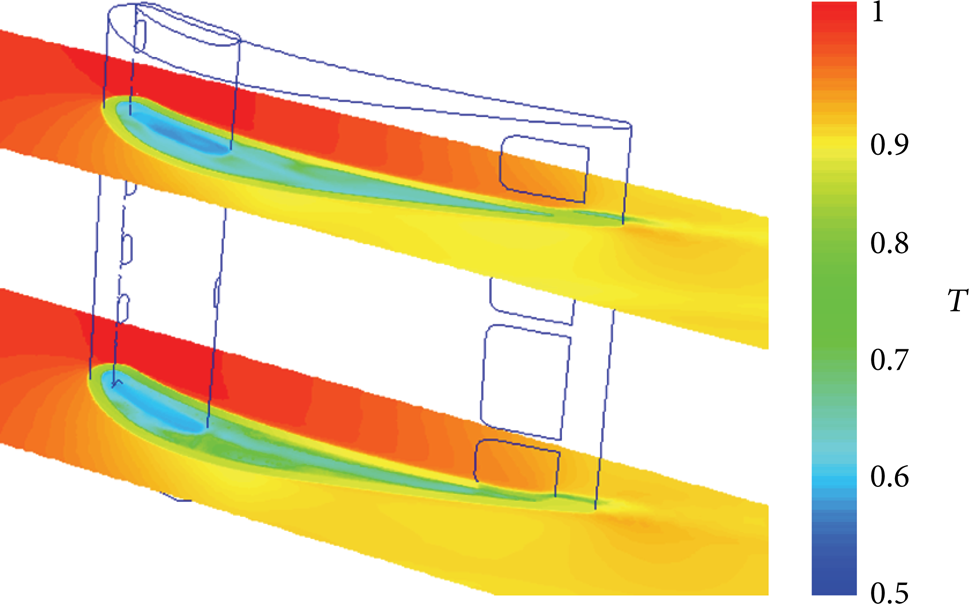
Figure 3 shows the Mach number contours at the section across an upstream hole and the downstream hole of the cooling slot, where (a) is for the whole section and (b) is a zoomed plot around the NGV. The temperature contours at the same section are displayed in Figure 4, and the local temperature contours near the NGV body are zoomed in Figure 4(b). In this figure and other figures in the paper, the temperature values are normalized by the maximum temperature in the computational domain. Overlapped in the plots are the metal walls of the NGV and internal cooling slot shown by white lines.
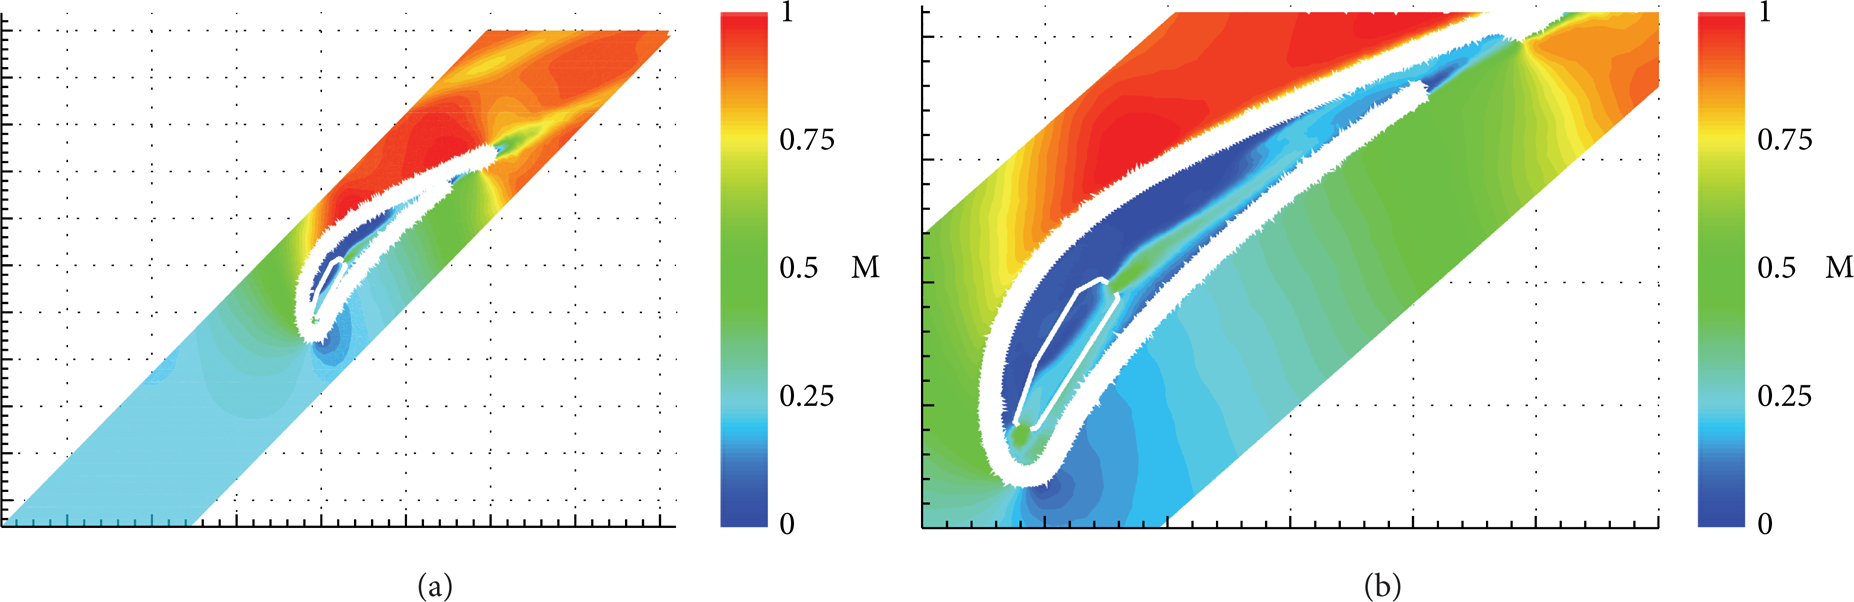
Mach number contours at the section across an upstream hole and the downstream hole of the cooling slot.

Temperature contours at the section across an upstream hole and the downstream hole of the cooling slot.
The compressible flow features are clearly shown in Figures 3 and 4. The flow velocity and temperature remain more or less constant in the inlet section. As approaching the NGV, the flow responds rather differently on the pressure and suction sides. At the pressure side, a stagnation point is formed, as shown in Figure 3, at the NGV leading edge. The flow gradually speeds up after the leading edge; however the Mach number or velocity is relatively low until reaching the trailing edge. More complicated interaction between the main flow, cooling flow, and NGV geometry occurs around the square opening. The flow rapidly accelerates from the end edge of the square opening and a small recirculation or stagnation zone is formed just behind the trailing edge. Since the flow velocity is relatively low at the pressure side except for the small region from the end of the square opening to the trailing edge, as expected, the static temperature remains relatively high except for the small downstream region (Figure 4).
On the contrary, along the suction surface the flow velocity increases rapidly after the leading edge, remains high in most of the downstream region, and quickly decreases at the trailing edge. The maximum Mach number in the flow is a little higher than 1.0, and two local supersonic spots are observed in Figure 3. Due to the rapid flow acceleration along the suction side, the temperature decreases rapidly from the leading edge and maintains more or less the same level at most downstream regions. In general, as shown in Figure 4, the pressure side wall is exposed to higher temperature than the suction side wall, which is consistent with the observation in [3].
It is interesting to notice that, in the cooling chamber at this section, the flow velocity is relatively high near the leading edge, middle, and downstream portion; however, it is low over a large portion of the suction side. This is due to the effect of the cooling chamber curvature and the higher fin height at the suction side (Figure 1).
Figure 5 presents the velocity vector plots at the same section as Figures 3 and 4, where (a) presents a whole picture around the NGV section walls, (b) is zoomed near the upstream cooling hole of the cooling slot, and (c) shows the details around the downstream hole. The magnitude of the vectors is represented by the length and coloured by Mach number levels. Both impingement and convection are used to cool the NGV walls in the present case. As shown in Figures 5(a) and 5(b), the cooling air directly impinges on the inner surface of the NGV near the leading edge, and the convection cooling is clearly illustrated in Figures 5(a) and 5(c), where the cooling air flows along the NGV internal/external surfaces.
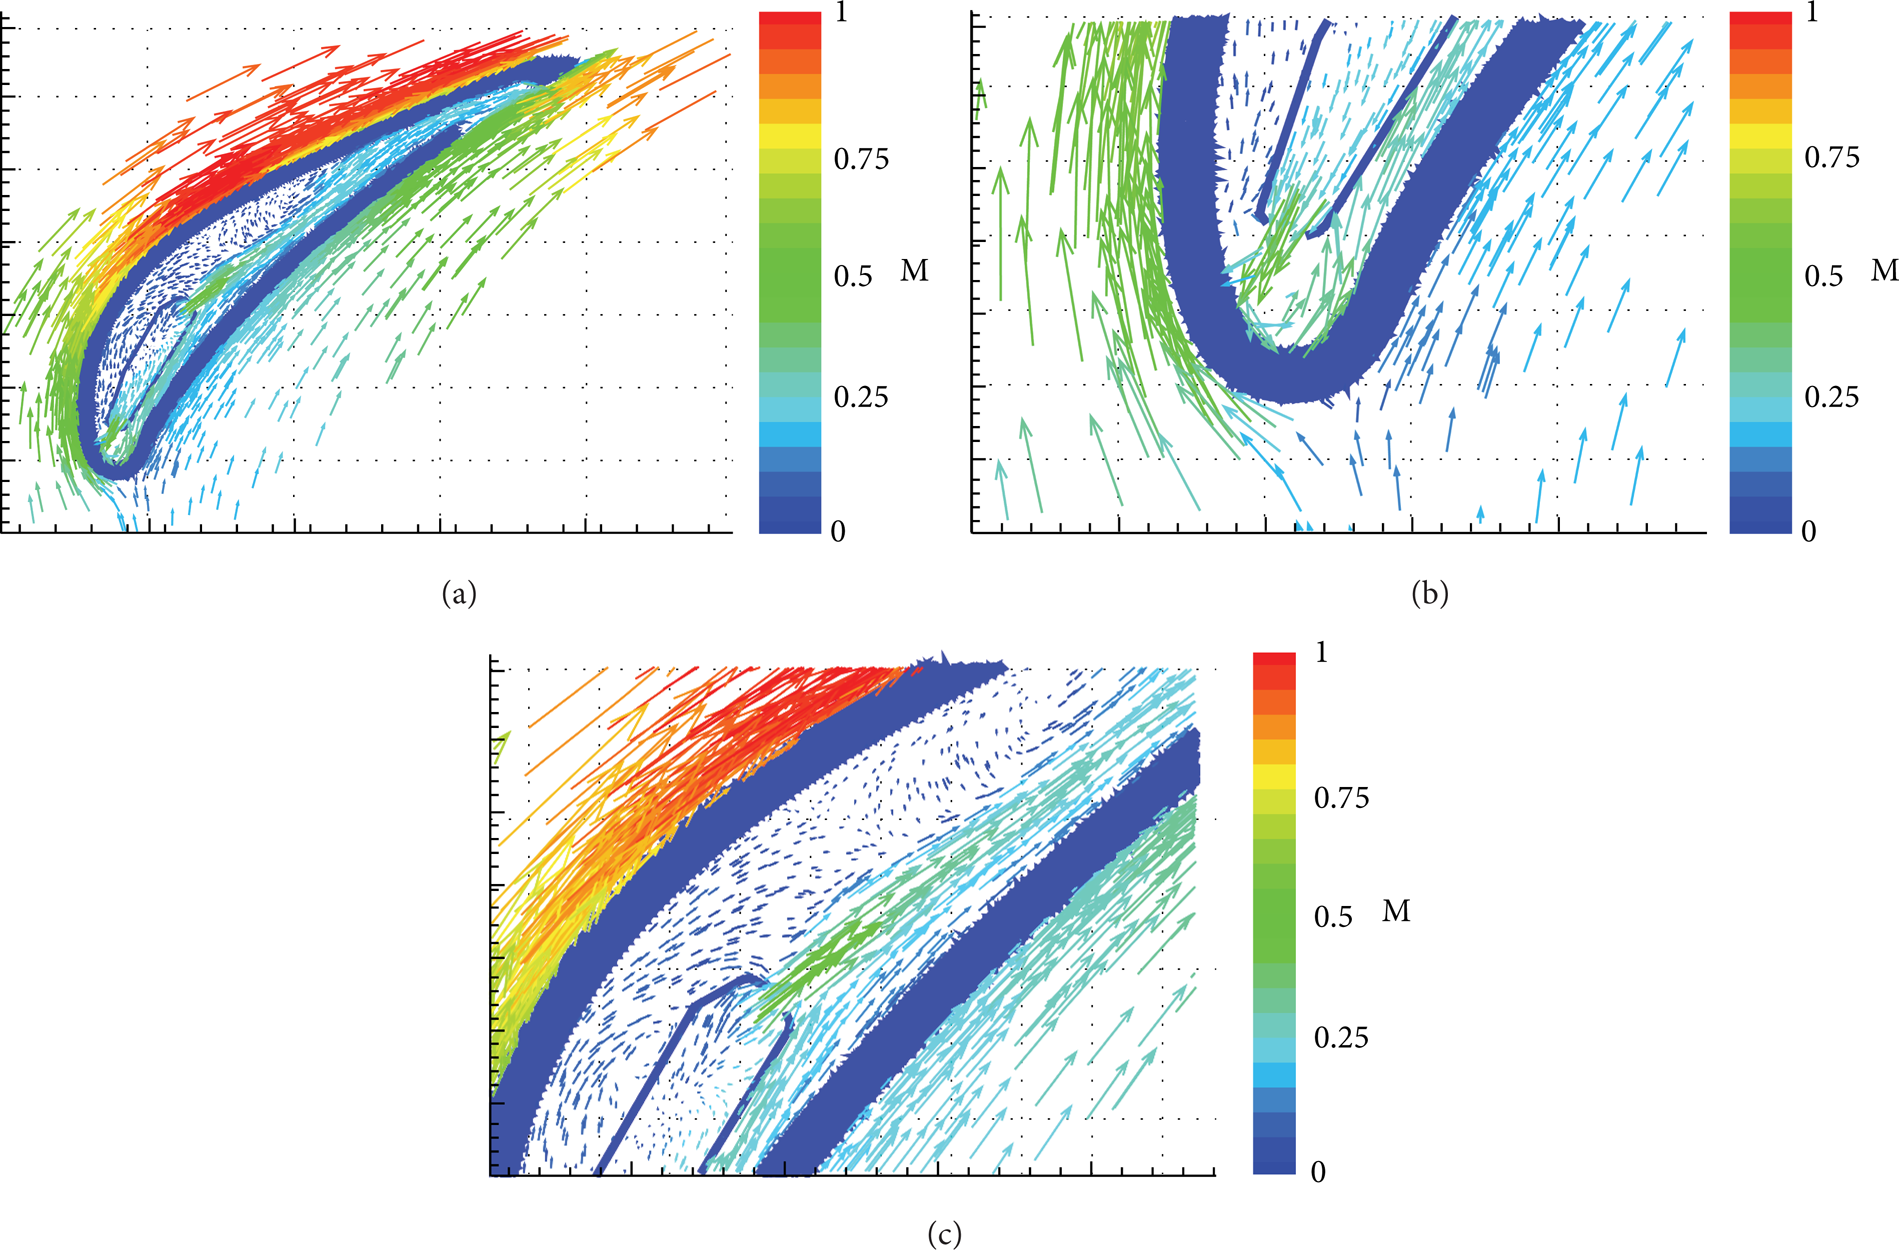
Velocity vectors coloured by Mach number levels: (a) the section across an upstream hole and the downstream hole, (b) the section across an upstream hole, and (c) the section across the downstream hole.
The mass flow rate through each cooling hole as a percentage of the total cooling air is listed in Table 2. In Table 2, the upstream holes are numbered as 1 to 6 starting from the internal shroud side. The mass flow rates remain at the same level at the four upstream holes (3–6) and the downstream hole and the mass flow rates at upstream holes 1–2 are close to each other. The maximum deviation in the cooling flow rate is 3.2% between holes 2 and 6.
Mass flow rates through cooling holes.

4.2. Temperature Distributions of NGV/Shrouds Walls
The normalized temperature contours of the NGV and shrouds walls are given in Figure 6. For clarity, a legend scale of T = 0.5–0.875, instead of 0.5–1.0, is used in Figures 6–9. The high temperature is observed in two local regions (one upper and one lower) on the NGV pressure side beside the square cooling air exits and the upper middle portion of the external shroud, with a maximum value of 0.87. The temperature at the shroud outer surfaces is relatively low.

Temperature contours of the NGV and shrouds.

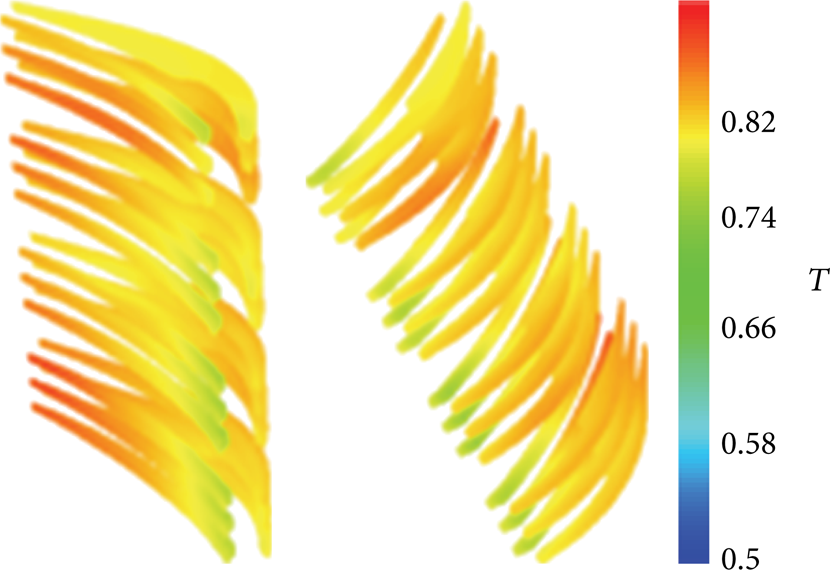
Temperature contours at the external surfaces of the pressure and suction sides.

Temperature contours at the internal surfaces of the pressure and suction sides.
Temperature contours at the cooling fin surfaces.
Figures 7-8 present the temperature contours at the external and internal surfaces of the NGV body, respectively, and Figure 9 gives the temperature distributions over the fin surfaces. In Figures 7–9, the temperature distributions for both pressure and suction sides are illustrated. It is obvious that the temperature varies significantly at these surfaces. As observed earlier, the temperature on the external walls of the pressure side is higher than that at the suction side, and two local high-temperature regions near the square exits are found at the pressure side. These observations are also true for the temperature distributions of the NGV internal surfaces and fin surfaces.
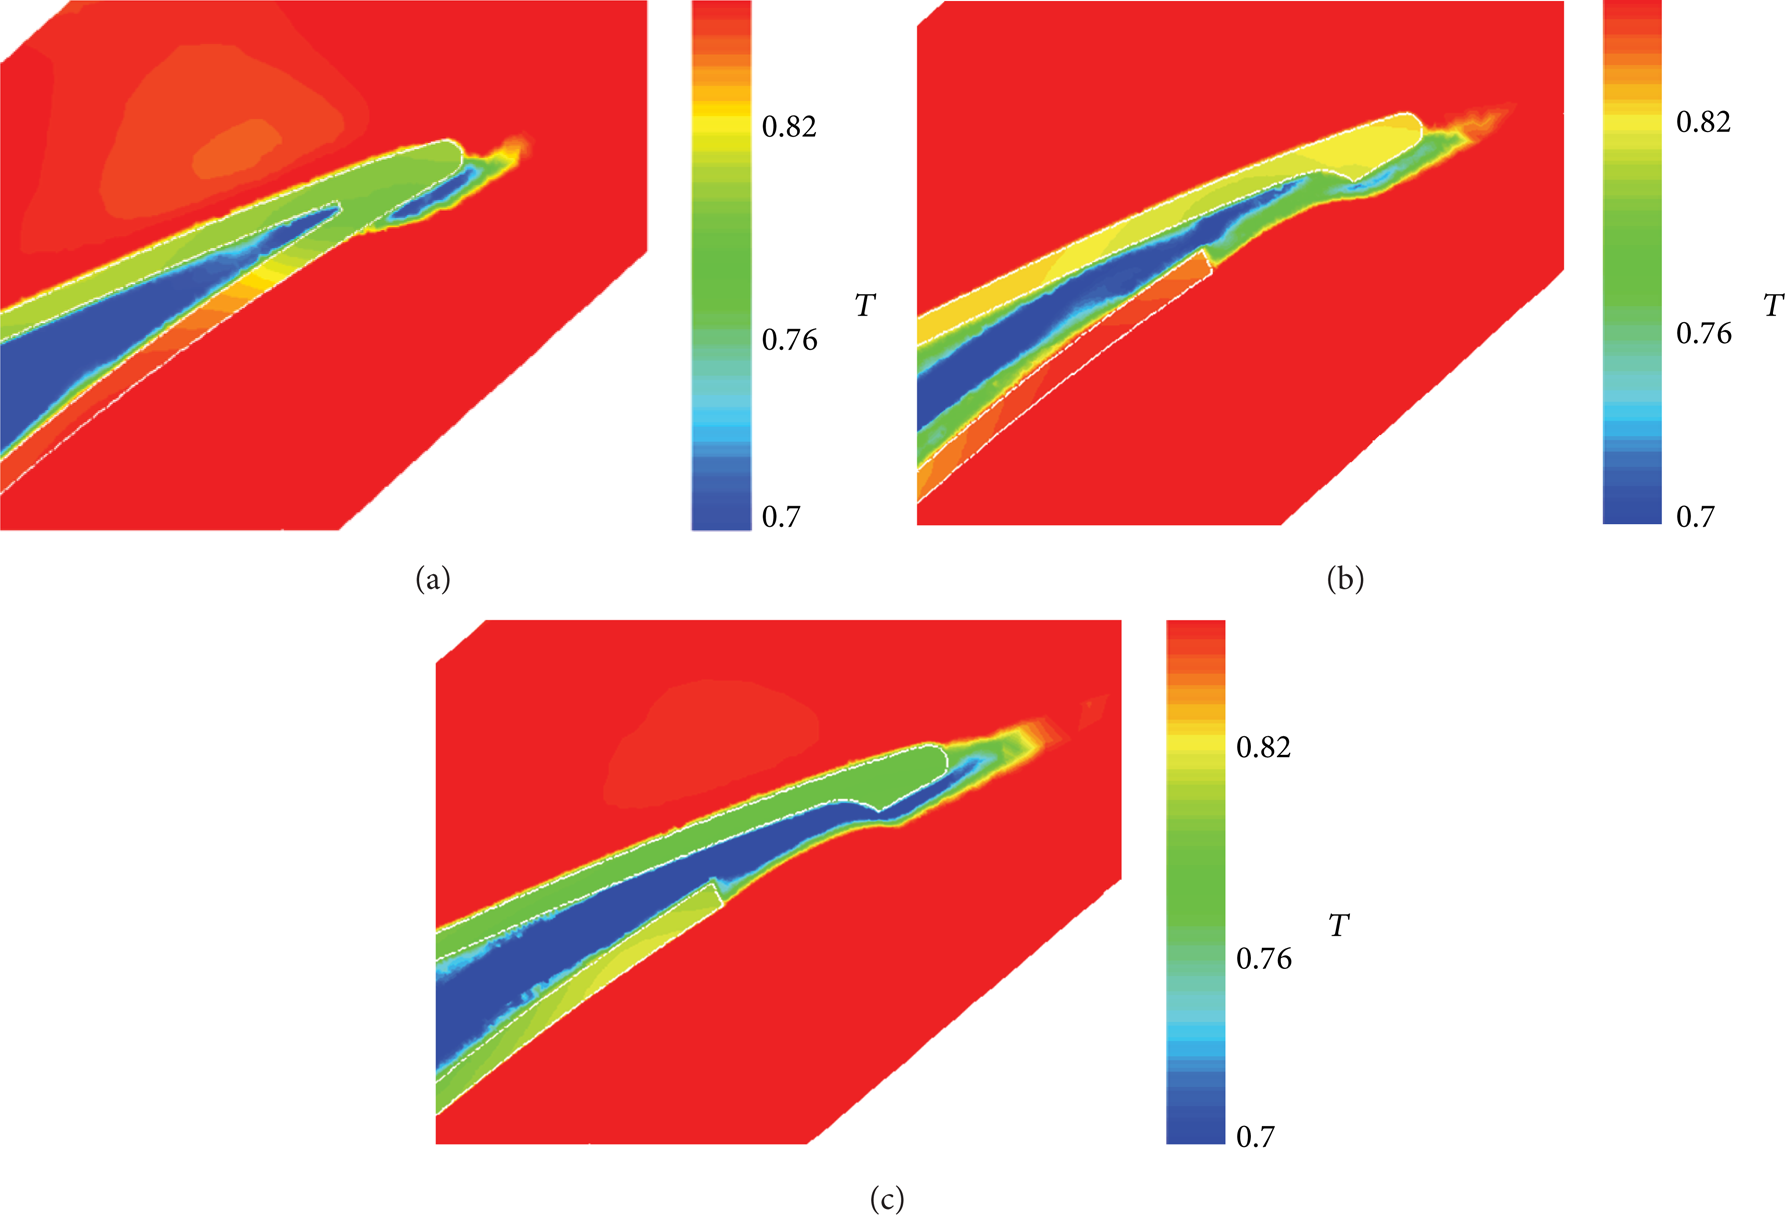
Figure 10 provides metal temperature distributions over three sections with two, (a) and (b), across the hot regions of the NGV pressure side and one, (c), through the middle region, with a legend scale of 0.7–0.86. These plots clearly illustrate the metal temperature variations at these sections, which are consistent with the observations in Figures 6–9. The maximum difference in metal wall temperature in Figure 10 is 0.12, which clearly indicates that the simple 1D heat transfer analysis is no longer valid for the practical complicated 3D heat transfer phenomena. For the present heat transfer study, the overall Biot number at the NGV internal/external surfaces is only 0.006, much smaller than 1. That is, the heat conduction inside the NGV is much faster than the heat convection through its surfaces, and the temperature distribution inside the NGV metal body is mainly determined by the complicated heat convections between the NGV body and the external main flow/internal cooling flow.

Metal temperature contours: (a) and (b) across hot spots and (c) across the middle of the NGV.
Figure 11 illustrates the temperature contours at the two sections across the centers of the hot spots on the pressure side in Figures 6–10, and overlapped in the figure are the outlines of the air-cooling slot, seven cooling holes, and NGV main body. The upper section cuts through the gap between the two square exits of the cooling flow and does not pass through any cooling slot hole. For the lower section, it just cuts through the edges of a square exit and a cooling slot hole. It is expected that the cooling air flow is somewhat restricted at local regions of these two sections. It may explain why the temperature near these local regions is higher than the other regions. Shown in Figure 12 are the temperature contours at the middle section, which cuts through the downstream hole and an upstream hole of the cooling slot. This may be the reason why the temperature at the middle regions of the NGV and fins is relatively lower than in the neighbouring regions.
Temperature contours at the two sections across the high-temperature spots on the NGV external surfaces.
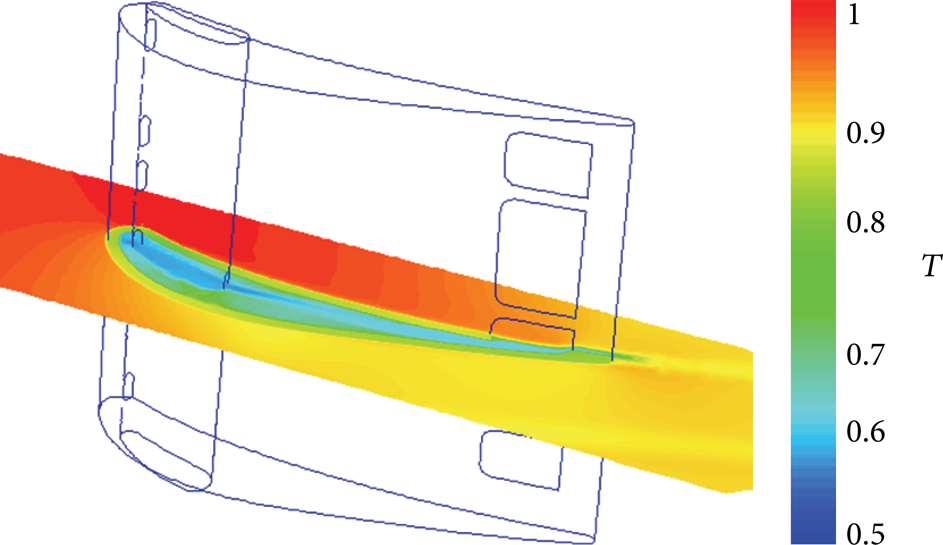
Temperature contours on the section across the downstream hole and an upstream hole of the cooling slot.
As mentioned earlier, the heat transfer is complicated in the vicinity of the NGV/shrouds, which is not governed by simple 1D convection-conduction-convection analysis from the main flow to the NGV body and then to the cooling air in the cooling chamber. For example, if only Mach number or velocity is considered (Figure 3), it is expected that the heat flux at the suction side is higher than that at the pressure side. On the other hand, according to the temperature contours (Figure 4), the heat flux at the pressure side tends to be higher than that of the suction side.
The heat flux through the NGV external and internal surfaces at the three sections (Figures 10–12) is given in Figure 13. In the figure, the heat flux is normalized by the mean of the maximum heat fluxes through the NGV internal and external surfaces, and for clarity the metal cross-section is also displayed (in dark blue). The red data points represent the heat flux through the NGV external surface, while the green points are the flux through the internal surface. The sign of the heat flux is defined as positive towards the cooling chamber and negative in the opposite direction. The features of the heat flux distributions at the three sections are similar. Due to the 3D nature of heat transfer, the heat fluxes through the NGV external and internal surfaces are not equal at all. Near the leading edge, the flux through the internal surface is higher than that for the external surface, particularly at the lower and middle sections (Figures 13(b) and 13(c)). In general, the heat flux is high around the leading edge and gradually decreases towards the trailing edge. There are local variations and bumps along the heat flux profiles, which are closely related to the local geometry and flow conditions.

Normalized heat flux (red for external surface and green for internal surface): (a) at the upper section, (b) at the lower section, and (c) at the middle section.
It is interesting to note that near the trailing edge, a considerable negative heat flux is observed at the external surface. The reason is that the region with negative flux is part of, or close to, the cooling air exiting passage (Figure 1), and the cooling air flows over the tiny trailing edge area. Figure 14 shows the flow/metal temperature contours near the NGV trailing edge at these three sections with (a) the upper section, (b) the lower section, and (c) the middle section. It is clear that the flow temperature near the trailing edge region is lower than the adjacent metal temperature at all three sections. As a result, the heat flux changes its direction and the negative heat flux is observed at these small regions.
Temperature contours near the NGV trailing edge: (a) at the upper section, (b) at the lower section, and (c) at the middle section.
The complex heat transfer phenomena illustrated in Figure 13 are determined by many factors: the local external flow parameters (gas properties, pressure, temperature, and velocity), the local cooling flow variables (air properties, pressure, temperature, and velocity), and the geometries of the NGV and cooling flow passage (location and shape of the cooling holes, exits, fins, shrouds, etc.). In addition, as shown in Figures 1, 3–5, 8, 9, and 11-12, the cooling air enters the cooling chamber through the internal shroud, passes through the seven cooling holes and 24 cooling fins, and eventually leaves the chamber through four square exits. It is certain that the complicated secondary flows will be generated due to the jet flows issuing from the cooling holes and the interactions between the cooling flow and cooling fins [13]. These secondary flows can play an important role in the NGV cooling, although the detailed analysis is beyond the scope of the present work.
Shown in Figure 15 are the photos of damaged NGVs after a certain time of service, and cracks are obvious at the pressure side. A long crack from the square exit edge to the leading edge is observed at the upper portion of the NGV body in Figure 15(a), and a short crack also starting from the square exit edge appears at the NGV lower surface, as shown in Figure 15(b). These field findings are consistent with the above predicted results. As shown in Figure 10, the sections (a) and (b) are located in the upper and lower potions of the NGV body, close to or corresponding to the crack locations. The high metal temperature is observed from the middle of the span to the cooling square exit on the pressure side of the NGV. The high temperature reduces metal strength, and the square geometry and temperature variation increase local metal stress. As a result, these square edges in the upper and lower portions on the pressure side become more vulnerable and are prone to cracking.

Cracks at the upper and lower portions of the NGV pressure side, starting from the square cooling-air exits.
As a technical demonstration, the obtained results will provide required information for the life analysis of the NGV/shrouds assembly. In addition, the results suggest that the cooling flow can be optimized by rearranging the holes and exits of the cooling passage and/or modifying the numbers and sizes of cooling holes and so forth. Detailed heat transfer analysis of the NGV/shrouds will help to achieve this goal.
5. Conclusions
The flow field and conjugate heat transfers of an internally air-cooled nozzle guide vane/shrouds assembly of a practical gas turbine engine at the baseline operating conditions are numerically investigated. A high-fidelity CFD model is generated and the numerical simulations are carried out with carefully specified boundary conditions. The features of the complicated flow and temperature fields are described. The Mach number is lower and the temperature is higher on the NGV pressure side than those on the suction side. The results indicate that the metal surface temperature of the NGV varies significantly, and thus the thermal stress could be excessively high. There are two high-temperature spots on the NGV pressure side, which could considerably reduce the NGV life. These observations are closely related to the locations of the holes and exits of the cooling flow passage and are consistent with the filed observations of damaged NGVs. As a technology demonstration, these results provide required data for the life assessment of the NGV/shrouds and also can be used to improve the cooling effectiveness.
Conflict of Interests
The authors declare that there is no conflict of interests regarding the publication of this paper.
Footnotes
Acknowledgments
The authors are grateful to the Department of National Defence and the Canadian Forces, as well as the Gas Turbine Laboratory, Aerospace Portfolio, the National Research Council of Canada, for funding and supporting this collaborative research project. The Technical Authorities and Project Managers at DND and NRC Major Leigh Holland, Captain Patrick Trembath and Dr. Craig Davison, respectively, are gratefully acknowledged.