
Abstract
This paper mainly studies how to divide the passing stages of the pedestrians and bicycles conglomeration at signalized intersection in Chinese urban area. The conception of pedestrians and bicycles conglomeration is defined after analyzing the two-stage characteristics of pedestrians and bicycles groups. Seven intersections were chosen in Beijing as examples. After video analysis, the real-time displacement and the real-time velocities of seven intersections in one signal cycle are extracted. It is found that the procedure of pedestrians and bicycles passing the intersection can be divided into two stages, which shows distinct characteristics. Video records taken from the observational survey are used to extract the real displacement of pedestrians and bicycles and the passing behaviors images. A new approach is presented to calculate the occupation ratio of the pedestrians and bicycles conglomeration, based on the “suppositional grids” division of the effective crosswalks. Finally, the grey relational analysis is applied to divide the mixed groups’ passing stages based on the occupation ratio of conglomeration. A signalized intersection in Beijing is presented as a case study, and the passing stages are clustered into four stages from initial five stages and the results indicate that the trend of change in different stages is obvious.
1. Introduction
A mixed traffic phenomenon is one of the most remarkable characteristics at signalized intersection of Chinese city, which is far more different from characteristics of signalized intersections in developed countries. It is mainly embodied in several aspects, such as the volumes of pedestrians and bicycles which are relatively high. Because of the mixture of pedestrians and bicycles when crossing the intersection, traffic conflicts among them are very obvious. Therefore, the research aims to examine the passing stages of pedestrians and bicycles conglomeration. It provides an important theoretical basis for studying the mixed traffic signal control strategy and intersection simulation.
In Chinese cities, the traffic patterns at the signalized intersection include pedestrians, bicycles, and the vehicles. According to the traffic rules, the pedestrians and bicycles always share the same way passing the signalized intersections.
In order to find the factors influencing the pedestrian road crossing behavior, researchers have developed several models such as log normal regression model and binary logit model [1, 2]. Factors such as gender, age differences, and social conformity have a significant effect in pedestrian behaviors by looking at vehicles before and while crossing safe pedestrian road [3–6]. HCM2000 depicts the pedestrians groups in the intersection. Because of the traffic signals or interruption of vehicle, pedestrians move together as a group [7]. Most existing works attempted to investigate the characteristics of the pedestrians and bicycles. Artificial neural network model is used to examine the pedestrian gap acceptance behavior by understanding the decision-making process of pedestrians [8]. Kilambi et al. analyzed the flow rate of pedestrians group and proposed a method for detecting and estimating the amount of people in groups, dense, as well as tracking them [9–11]. Xu researched the pedestrians group and proposed the volume, density, and the average velocity of the pedestrians group and the bicycles group separately and the dilatability and dissipation characteristics of the bicycles group [12]. Yang et al. defined the pedestrians group which are crossing the crosswalks, and analyzed the calculation of projective area account [13]. Zheng et al. researched the crowd movement at the main railway station in Wu Han of China and the characteristics of the pedestrians groups were analyzed, as well as the density and velocity of group [14]. Pedestrians’ crossing behavior model is established for urban area and risks are calculated [15, 16].
Previous studies mainly research the group of pedestrians and bicycles separately and did not consider them as a whole. Few studies addressed the issue of the division of the passing stages of the pedestrians and bicycles conglomeration [17]. Moreover, many studies in this respect are about pedestrians and bicycles separately. Up till now, the passing stages of pedestrians and bicycles conglomeration have not been researched. If the group of the pedestrians or bicycles is considered separately, the characteristic of mixed traffic phenomenon of the intersection cannot be described appropriately.
In order to study the mixed traffic signal control strategy and traffic simulation of the intersection, the paper analyzes the pedestrians and bicycles as a whole group and it proposes a novel method to divide the passing stages of the pedestrians and bicycles conglomeration.
In the next section, the two-stage characteristics of the pedestrians and bicycles are researched. In the third section, the model of occupation ratio of the pedestrians and bicycles conglomeration is calculated. Then, the division method for the passing stages of the conglomeration at signalized intersection is proposed. Moreover, the proposed method is applied for a signalized intersection of Beijing. Finally, this paper ends with conclusions and further studies are suggested.
2. The Releasing Characteristic of the Pedestrians and Bicycles
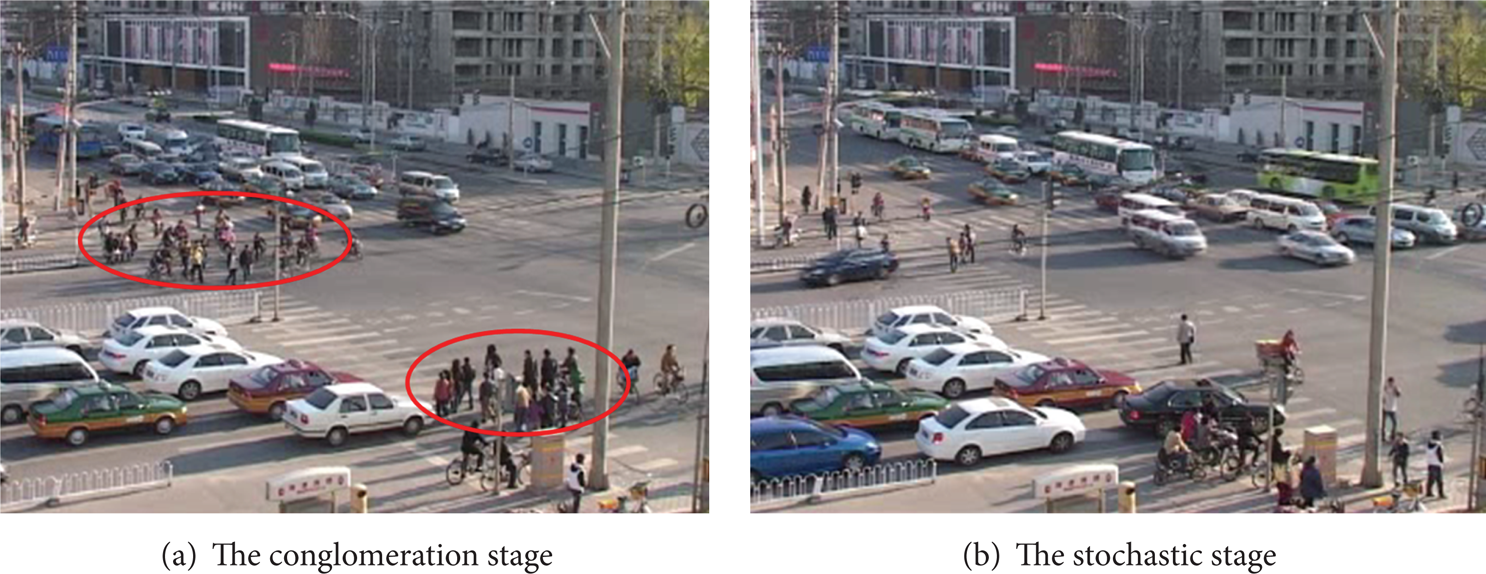
In Chinese city, there are many pedestrians and bicycles through signalized intersection, and the pedestrians and bicycles are always bidirectional. When the green interval of the controller starts, the pedestrians and bicycles groups begin to enter the crosswalk, and the shape is like a pack (Figure 1(a)) and after the pedestrians and bicycles group entered the crosswalk, the coming pedestrian and the bicycle will enter the crosswalk stochastically (Figure 1(b)).
The passing stage of the releasing time.
Seven intersections in Beijing are chosen as examples to analyze the pedestrians and bicycles characteristic. The details of the seven intersections are shown in Table 1, which contains the name, the survey time, the green interval, and the survey of crosswalk direction of the signalized intersections.
The introduction of the surveyed intersections.

Video cameras and data analysis technologies were used to collect and image data of pedestrians and bicycles at the signalized intersection. After the video analysis, the real-time displacement and the real-time velocities of the seven intersections of a cycle were extracted. From the real-time displacement, it can be found that the pedestrians and bicycles pass the intersection with the characteristic of two-stage.
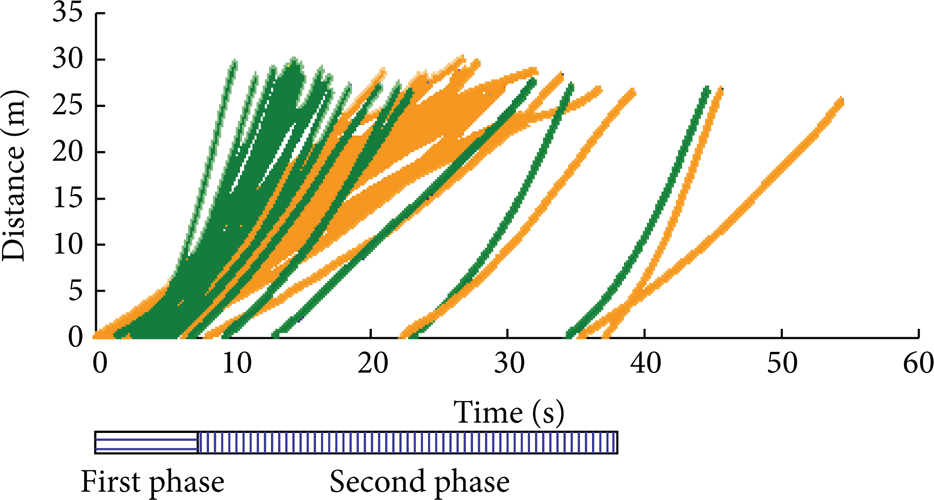
This paper analyzed the Ping Le Yuan intersection in detail as follows, and the results of the other six intersections are shown in Figures 3(a)–3(f). Figure 2 includes the analysis result of the Ping Le Yuan intersection. In Figure 2, green curves stand for bicycles’ crossing and yellow curves stand for pedestrians’ crossing. The x-coordinate stands for the valid green time and the Y-coordinate stands for the moving distance of the pedestrian or a bicycle in green time.
Time-space curve of the pedestrians and bicycles in one cycle.

The results of the other surveyed signalized intersections.
It can be seen obviously that there are two stages in Figure 2. During the first 8 seconds of the green time interval the curves are very dense which means that the density of the pedestrians and bicycles is high. The curves become sparse after 8 seconds, which shows that the density of pedestrians and bicycles is small. So it can be concluded that there are two stages during the green interval of the pedestrians and bicycles: the first 8 seconds as the first stage and the green time after the 8th second as the second stage.
The characteristics of the pedestrians and bicycles in the two stages are analyzed are analyzed for the other six intersections in Figures 3(a)–3(f), in which green curves denote pedestrians and yellow curves denote bicycles. Therefore, the pedestrians and bicycles conglomeration is defined as follows. In the first stage of the releasing time, the pedestrians and bicycles enter the crosswalk densely like a pack, and then they keep the shape until passing the intersection; those pedestrians and bicycles as the pedestrians and bicycles conglomeration. The pedestrians and bicycles conglomeration is the most characteristic of the green interval. So this paper mainly focused on the pedestrians and bicycles conglomeration.
The process of the pedestrians and bicycles conglomeration during the green time is changing as shown in Figures 4(a)–4(d). In the beginning of the green time, the conglomeration begins to form (Figure 4(a)). During this time, the density of the conglomeration is relatively high. Then the conglomeration begins to accelerate and spread out (Figure 4(b)). The two conglomerations of the two directions encounter (Figure 4(c)); after the encountering of conglomerations (Figure 4(d)) finally the conglomerations get through the intersection (Figure 4(e)).

The changing process of the conglomeration.
3. The Model of the Occupation Ratio
The division of the passing stages of the pedestrians and bicycles conglomeration during the green time is very important to study the mixed traffic signal control, and the division is an important step for the mixed traffic signal control. The division shown in Figures 4(a)–4(d) is a preliminary division. So as to ascertain the main stages of the changing process of the pedestrians and bicycles conglomeration, a method of the occupation ratio is proposed to solve the issue.
In order to study the passing stages of pedestrians and bicycles conglomeration, the paper presents a novel approach to calculate the occupation ratio of the pedestrians and bicycles conglomeration based on the method of the “suppositional grids” of the effective crosswalks.
As for the research of the occupation ratio of pedestrians and bicycles, in HCM2000, the calculation of the occupation ratio of the pedestrians and bicycles is based on their capacity and the purpose of occupation ratio calculation is to calculate pedestrian and bicycle adjustment factor for calculation flow of turning vehicle. The average pedestrian occupancy OCCpedg can be calculated by
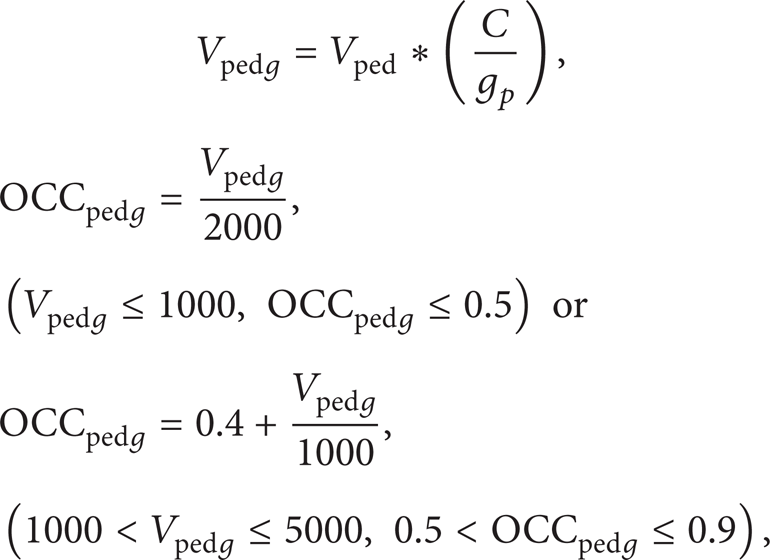
where OCCpedg is the occupation ratio of pedestrians. C is the signal circle length. Vped is the pedestrian volume. g p is pedestrian green time. Vpedg is the pedestrian flow rate.
The bicycle conflict zone occupancy OCCbicg is determined by

where OCCbicg is the occupation ratio of the bicycles, Vbic is the pedestrian volume, g is green time of signal cycle, and Vbicg is the bicycle flow rate.
The relevant occupancy is determined from combined pedestrian occupancy and bicycle conflict zone occupancy using

where OCC r is the occupation ratio of the pedestrians and bicycles of the conflict zone. The range of occupation ratio is from 0 to 1.
Because the volume of the pedestrians and bicycles in developed country is smaller than that of China, HCM2000 only takes the conflict zone for the study area. In China, the volume of the pedestrians and bicycles is very big, as well as the pedestrians and bicycles through the intersection in a mixed mode; the equation of the occupation ratio in HCM2000 is not suitable to study the passing stages of the pedestrians and bicycles conglomeration in China. So this research considers the mixed traffic characteristics; it takes the whole passing area of the pedestrians and bicycles for the study and calls it the effective crosswalk. It presents a novel approach to calculate the occupation ratio of the pedestrians and bicycles conglomeration, based on the “suppositional grids” division of the effective crosswalks.
Based on the occupation space of the pedestrians and bicycles, the crosswalk criterion, the method of “suppositional grids” is that the crosswalk is divided to many uniform grids in the suppositional mode, and its purpose is to calculate the area of pedestrians and bicycles conglomeration. The detailed method of the “suppositional grids” is illustrated below.
In the HCM2000, the average space of the pedestrians in the crosswalk is 0.3 m2/P. When it evaluates the establishment of road, the space of pedestrians in the crosswalk is 0.75 m2/P [1]. In China, the research of the space of pedestrians in the crosswalk is 0.35–1.2 m2/P and the average space of the bicycles in the crosswalk is 2.0–4.0 m2/B [7].
In the crosswalk criterion (GB5768-2009) of China, the width of one zebra crossing is 0.45 m, and the length of one zebra crossing is at least 3.0 m in which 1.0 m, as one grade, can be added. The spacing of the two zebra crossings is 0.60 m.
By way of calculating the occupation of the pedestrians and bicycles conglomeration, the pedestrian and bicycle are considered as one unit and the space of this unit is 0.3–4.0 m2/unit. In view of the space of the pedestrians and bicycles and the crosswalk criterion (GB5768-2009), the method of the “suppositional grids” is presented to divide the crosswalk. In order to count the unit conveniently, the width and the length of one suppositional grid are defined first. The width of the suppositional grid is 1.0 m and the length of the suppositional grid is 1.05 m. Figure 5 shows the division of the crosswalk.

The “suppositional grids” of the crosswalk.
Based on the definition of the “suppositional grids,” the pedestrians and bicycles conglomeration can be defined as follows: if the spacing of projection area in the unit is less than one suppositional grid and the quantity is more than two suppositional grids, the number of the suppositional grids is the quantity of the pedestrians and bicycles conglomeration.
After the description of the pedestrians and bicycles conglomeration, the definition of the occupation ratio of the space of the conglomeration can be proposed. In the crosswalk of the signalized intersection and when it is the green time, the projection area of the pedestrians and bicycles occupies the whole crosswalk. “C” is used to denote the occupation ratio. Based on the method of the “suppositional grids,” the model of the occupation ratio of the space of the conglomeration can be established. The equation is shown as follows:

where C is the occupation ratio of the space of the conglomeration,
4. The Passing Stages Division
This paper chooses the method of the grey relational analysis to divide the passing stages based on the occupation ratio of the pedestrians and the bicycles. The grey relational analysis is a method which can ascertain the main stages or main factors of a system.
Based on the method of the grey relational analysis, the relational ratio of every passing stage can be calculated according to the occupation ratio of pedestrians and bicycles conglomeration. From the relational ratio, the main stages of the passing process can be ascertained.
It is hypothesized that the behavior sequences of the system are shown in (5), and there are five steps for computing the relational ratio of every passing stage. Consider

where X i is a stage and n is natural number.
The relational ratio R(xi, xj) is usually signed by Rij, and the relational coefficient of the dot K is usually signed by R[xi(k), xj(k)].
Step 1. Initialize the behavior sequences of the system using

where
Step 2. Get the gap of every behavior sequence of the system using

where Δi(k) is the distance between the two initialized stages and n is natural number.
Step 3. Calculate the maximal gap and the minimal gap of the behavior sequences of the system using

where M is the maximum of Δi(k) and m is the minimum of Δi(k).
Step 4. Calculate the relational coefficient of the dot K using
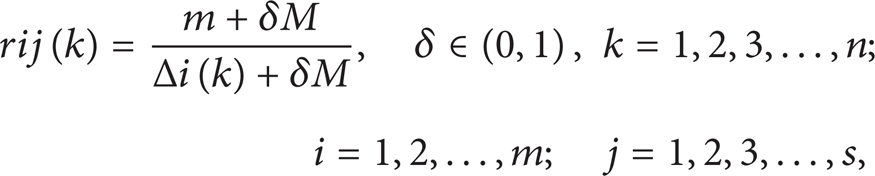
where rij(k) is the relational coefficient of the dot K and δ is a parameter between 0 and 1.
Step 5. Calculate the relational ratio using
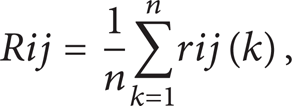
where Rij is the relational ratio, i is natural number, and j is natural number.
This paper takes the intersection of Beijing Ping Le Yuan, for example, to divide the passing stages of the pedestrians and bicycles conglomeration.
The studied signalized intersection is a 4-leg intersection, and there are four phases of its signal timing schedule.
The east crosswalk is taken for the research object, the width of this crosswalk is 5.0 m, and the length of this crosswalk is 37.5 m. A video recording survey was conducted at the chosen signalized intersection. It was found from the historical data that the evening peak hour was the most congested period at the chosen study area throughout a day. Thus, the evening peak hour 17:00–18:00 was chosen for conducting the video recording survey. An hourly video-record was taken from a tall building with a top view of the chosen intersection.
This investigation uses the method of video analysis. The crosswalk can be divided into 180 suppositional grids using the method in this paper. Based on the analysis of the passing process of the pedestrians and bicycles conglomeration above, the passing process is divided into five stages initially. And the five stages are as follows:
Stage 1: the commencement of it entering the crosswalk;
Stage 2: before the encountering of the conglomeration of the two directions;
Stage 3: the stage of the encountering of the conglomeration;
Stage 4: after the encountering of the conglomeration of the two directions;
Stage 5: before the conglomeration getting through the crosswalk.
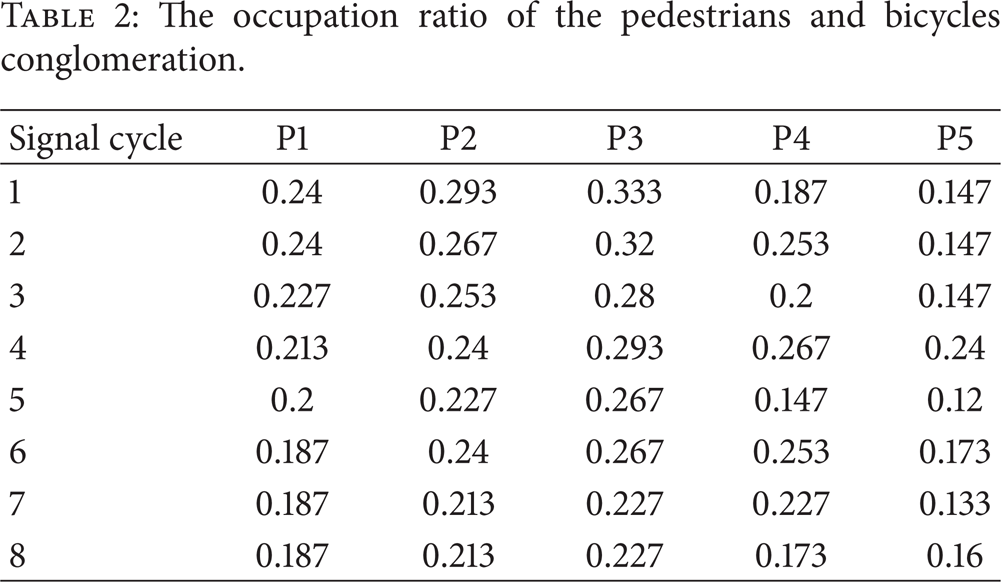
After the statistic analysis of the video, the counting table of 8 circles of two directions can be extracted in the time of the investigation. So the occupation ratio of five stages of the conglomeration can be calculated using the model of the occupation ratio of the space. Table 2 is the final statistic data of the occupation ratio of the conglomeration.
The occupation ratio of the pedestrians and bicycles conglomeration.
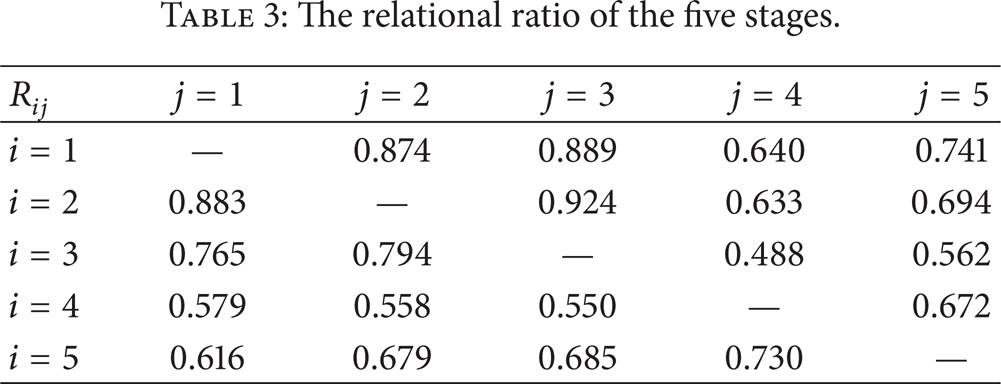
The results of the relational ratio and the gap of every relational ratio are presented in Tables 3 and 4 by using the computing the relational ratio. From the results, in Table 3, when i = 2, R23 = 0.924, which means that the relational ratio of R23 is larger than other passing stages, and when i = 3, R32 = 0.794, which means that the relational ratio of R32 is bigger than other passing stages.
The relational ratio of the five stages.
The gap of every relational ratio of the five stages.

In Table 4, when i = 1, R12 − R13 = 0.015, when i = 4, R42 − R43 = 0.008, and when i = 5, R52 − R53 = 0.006, which means that the gap of relational ratio between Stage 2 and Stage 3 is small than other passing stages. So it can be seen that Stage 2 and Stage 3 of the original divisions are very relational, and the two stages should be incorporated.
After the analysis of the relational ratio of the passing process, the main stages of the pedestrians and bicycles conglomeration can be obtained. There are four stages of the passing process:
Stage 1: the commencement of it entering the crosswalk;
Stage 2: the stage of the encountering of the conglomeration of the two directions;
Stage 3: after the encountering of the conglomeration of the two directions;
Stage 4: before the conglomeration getting through the crosswalk.
Based on the occupation ratio of the pedestrians and bicycles conglomeration, the changes in trends of the pedestrians and bicycles conglomeration can be gotten according to the stage's divisions of the passing process. Figure 6 is the original divisions of the passing process for five stages and Figure 7 is the final division of the passing process for four stages. From the results, it can be seen the stages are obvious under the grey relational analysis.
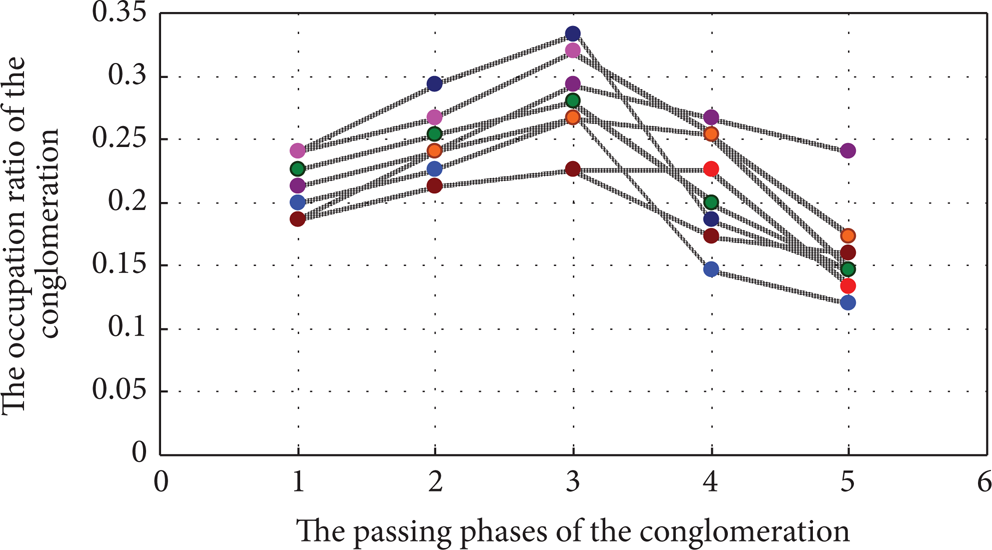
The initial divisions of the passing process for five stages.

The final division of the passing process for four stages.
5. Conclusion and Future Works
This research examines the passing stages of the pedestrians and bicycles conglomeration in order to explore the mixed traffic signal control strategy and traffic simulation of the intersection. Pedestrians and bicycles conglomeration is defined after analyzing characteristics of the pedestrians and bicycles. The paper also presents an approach to calculate the occupation ratio of the pedestrians and bicycles conglomeration, based on the “suppositional grids” division of the effective crosswalks. The grey relational analysis method is used to divide the passing stages of the pedestrians and bicycles conglomeration based on the occupation ratio of the conglomeration. A signalized intersection in Beijing is chosen for case study, and the passing stages are divided into four stages and the results indicate that the stages are obvious. This is the theoretical basis for the study of the mixed traffic signal control strategy.
This paper mainly proposed a method to divide the passing stages of the pedestrians and bicycles conglomeration. However, only one signalized intersection is chosen as an example and more data should be collected and analyzed to divide the passing stages concretely. How to apply the results of the division of the passing stages is important for the mixed traffic management at signalized intersection, which is an important issue for the future research.
Conflict of Interests
The authors declare that there is no conflict of interests regarding the publication of this paper.
Footnotes
Acknowledgments
The project are supported by National Natural Science Foundation of China (nos. 51308058, 51308059, and 51208052), Application basic research project of the Ministry of Transport (2014 319 812 240) “Urban Public Buses Optimal planning based on City Scale,” The key research project of the Ministry of Public Security“urban parking management policy and key technology research” (201302 zdyj013) and China Postdoctoral Science Foundation (no. 2013M532007).