
Abstract
Due to great flexibility, low damping, and variable structure in the cabin-cable system of five hundred meter Aperture Spherical Radio Telescope (FAST), a real-time digital low-pass filter based on the analysis of frequency is presented in this paper. Firstly, by the Lomb-Scargle theorem, it can obtain the fundamental frequency of cabin-cable system. Then, using the obtained frequency, a digital low-pass filter is designed to filter the measured data. After being filtered, the measured data are used for coarse control. Finally, the results of the experiments on the FAST 5 m model show that calculating the fundamental frequency is accurate and the filter is effective.
1. Introduction
Five hundred meter Aperture Spherical Radio Telescope (FAST) is one of the Chinese national key scientific engineering projects [1], which is being constructed in Guizhou Province, as shown in Figure 1. The feed cabin system of FAST is composed of the large span cabin-cable suspension as the coarse tuning subsystem and the Steward platform fixed to the feed cabin as the fine tuning subsystem. The coarse tuning subsystem makes the feed cabin spatial motion large scale via six cables, while the fine tuning subsystem, based on the coarse tuning subsystem, ensures that the feed mounted on the Stewart platform spatial motion is accurate [2].

Five hundred meter Aperture Spherical Radio Telescope.
During FAST feed cabin movement, the scanning trace of the feed cabin is carried out by the six retractable cables achieved by six different hoists; each suspension span is more than 200 meters. The cabin-cable subsystem, with great flexibility and low damping, results in low fundamental frequency and intensive modal frequencies. Therefore, if the measured data are used directly to the coarse control, the high-frequency part will cause the feed cabin to vibrate durably. So the control quality will be worse [3]. The regular methods are usually to use a low-pass filter for the flexible structure, ignoring the effects of the high-frequency modals. The system will be stable by actively narrowing the frequency bandwidth of the measured data. However, the cutoff frequency of the regular low-pass filter is constant, and this kind of filter is usually used for the unvaried structures. When the feed cabin moves via 6 parallel flexible cables, because the cable length and force change, the force can change from 30 KN to 330 KN [4]; the fundamental frequency of structure will also be different. The maximal fundamental frequency is twice the minimal fundamental frequency [4]. So the regular low-pass filter cannot solve the FAST problem effectively anymore. A kinematics model of time-delay moving target is put forward in paper [5]. The target will be tracked through applying H∞ filter algorithm. But the result of this method will be dependent on the modeling accuracy and the rationality of the statistics of perturbation. A real-time filter based on the analysis of frequency is presented in paper [6]. This method makes use of Fourier transform to process the measured data. In the Fourier transform theory, the data series must be sampled evenly. However, in fact, the measured data are often unevenly spaced, and the data also have high-frequency noise. The unevenly sampling can cause additional false peaks, and the noise can cause the amplitude and phase error.
Considering the feature of FAST feed cabin motion, a novel low-pass filter method based on the fundamental frequency of variable structure is presented in this paper. The fundamental frequency can be calculated in real-time by the Lomb-Scargle periodograms. The Lomb-Scargle method can reduce effectively the false signals caused by unevenly sampling and pick up the periodicity accurately [7]. And a low-pass filter based on the calculated frequency processes the measured data. The cutoff frequency of the low-pass filter can be updated by the calculated real-time frequency. So this filter will be self-adaptive. In the experiments on FAST 5 m model, the results prove the validity of this method.
2. Problem
Paper [8] shows the relationship between cable force and the external force. When the feed cabin is in different position, the cable force will also vary. For the low-damping, low-frequency, and intensive-mode feed cabin system, the fundamental frequency varies in the different position. During the feed cabin control, the displacement of the cabin-cable system contains all the modal information. If the measured data are directly used to the control, the high-frequency parts will cause cabin-cable system to vibrate and reduce the control quality. Therefore, the measured data should be filtered. As stated above, the regular low-filter is not suitable for the FAST cabin-cable system (Figure 2). A new filter method is needed to design, which can calculate the cutoff frequency real-time.
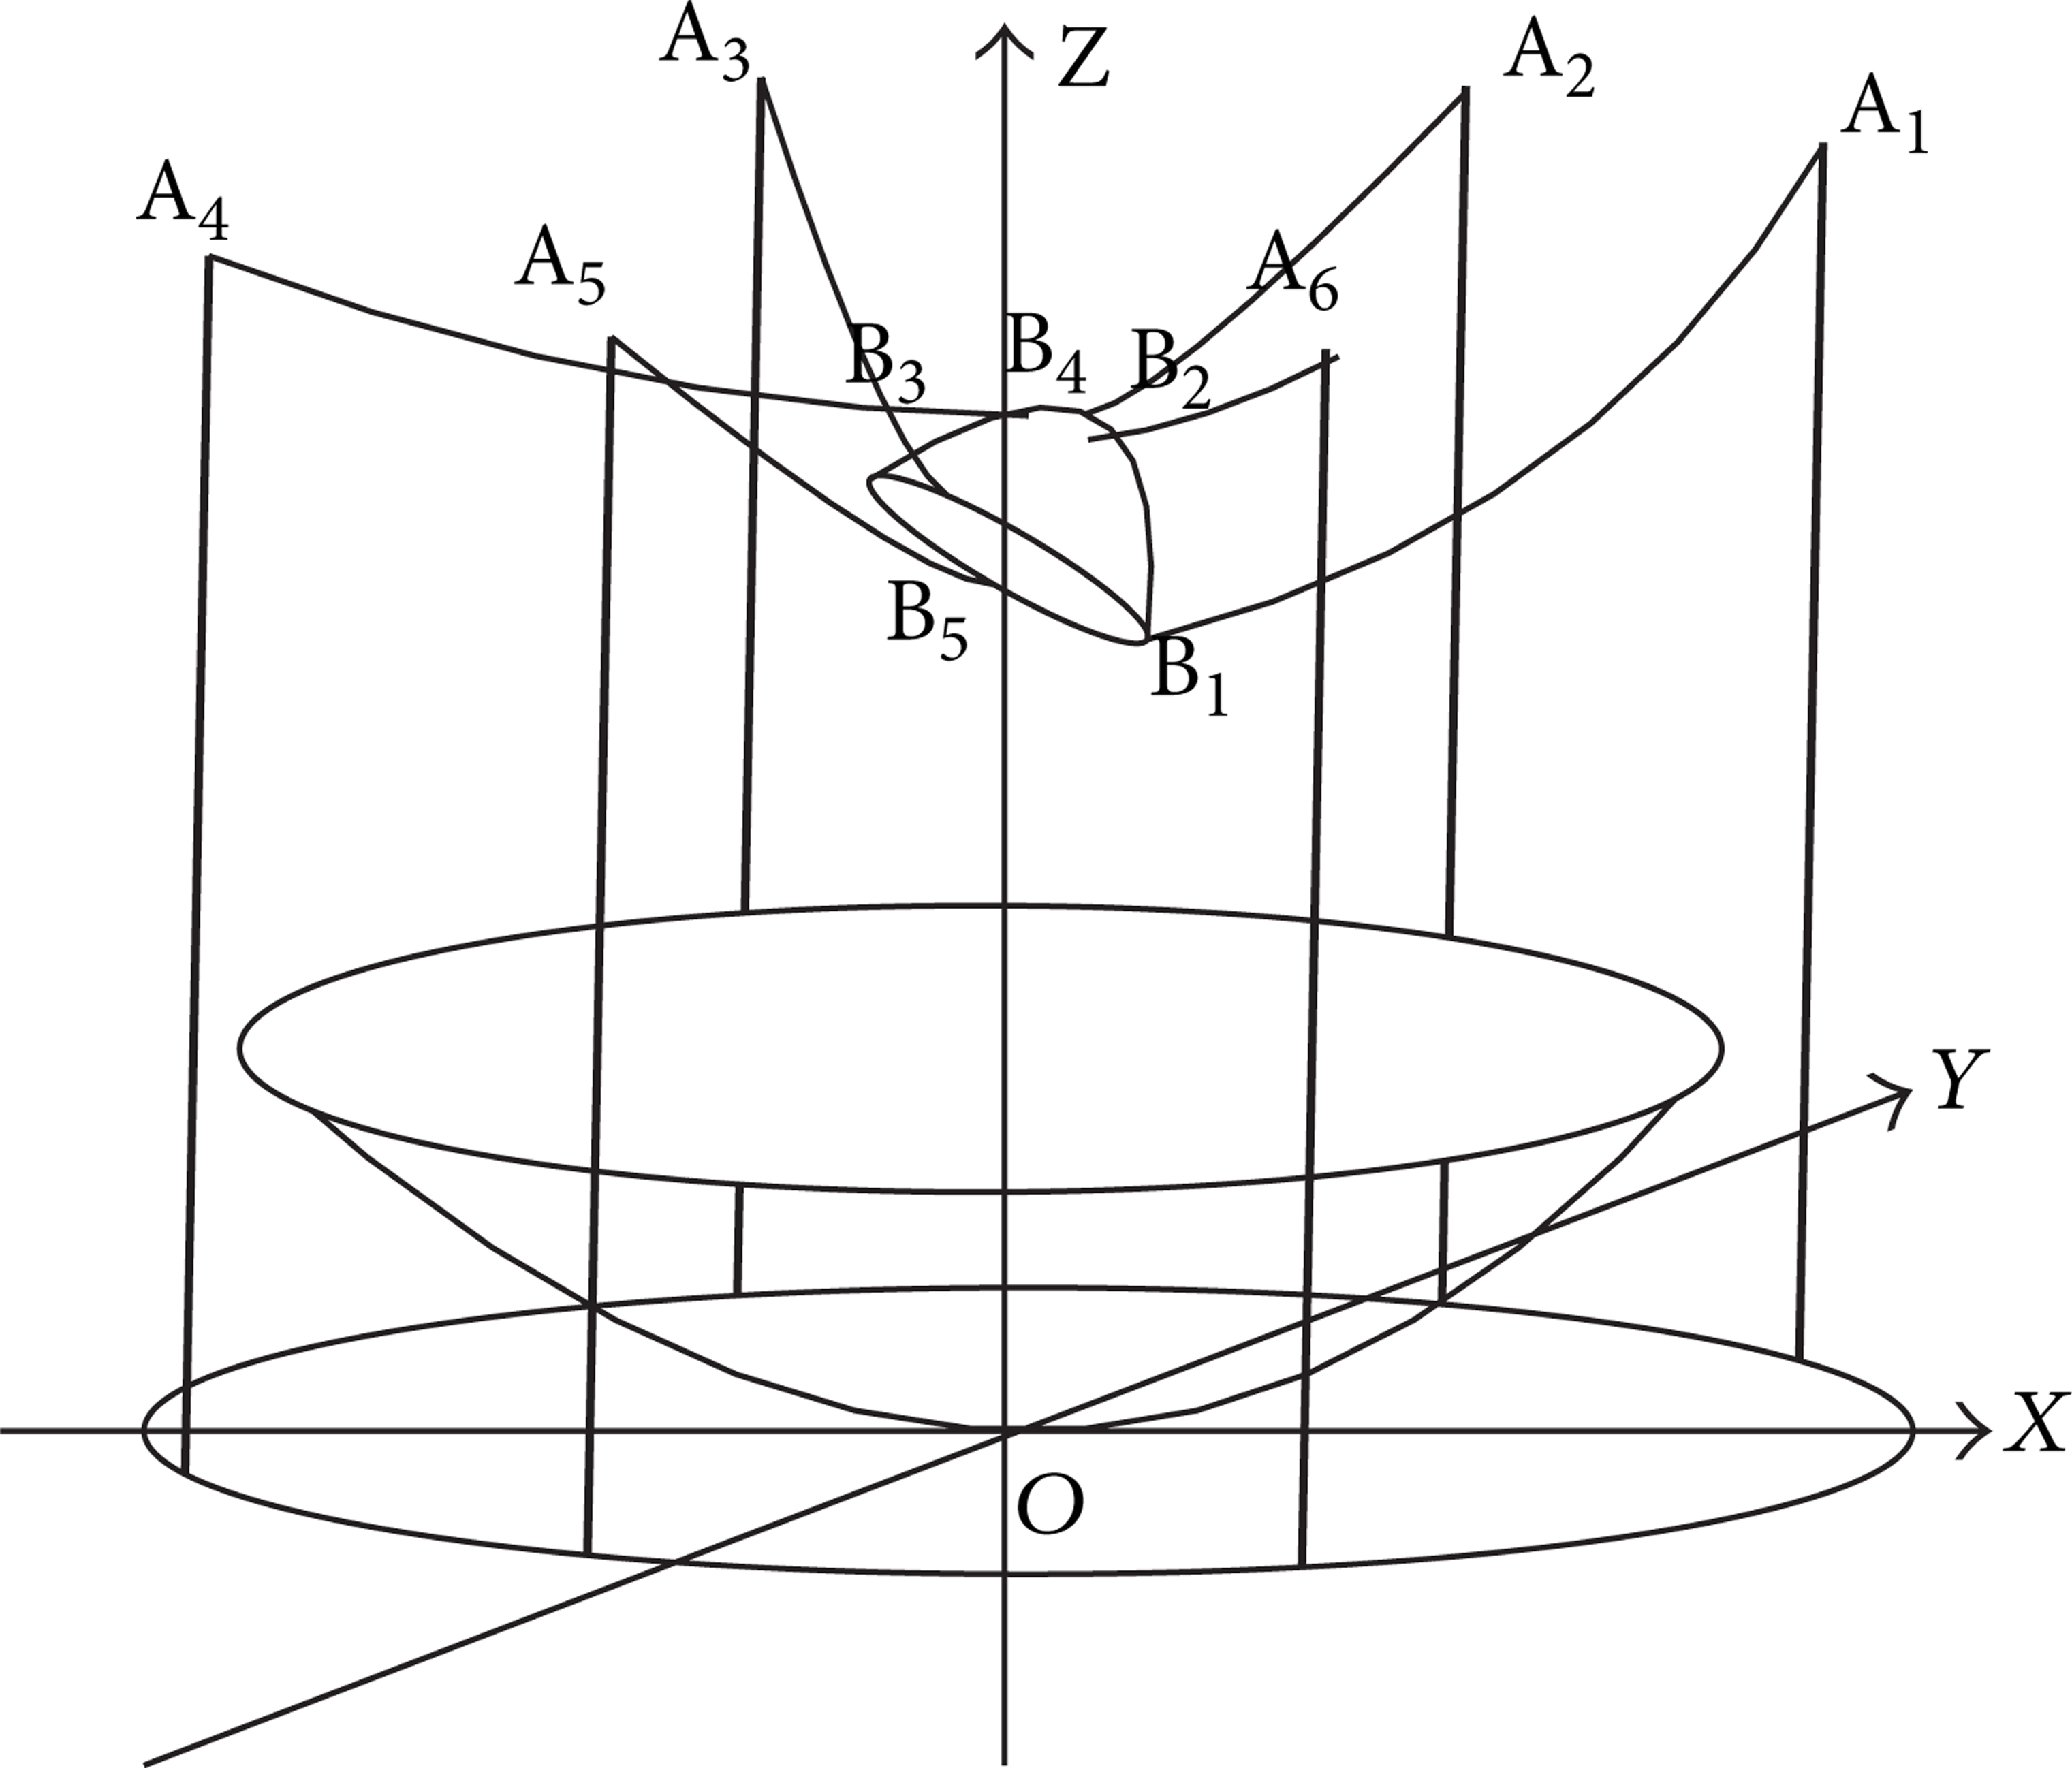
A conceptual sketch of cabin-cable system of FAST.
3. Filter Method Based on the Analysis of Frequency
3.1. The Calculation of Fundamental Frequency
For designing the filter, the real-time fundamental frequency must be calculated. The Fourier transform is not suitable for the unevenly spaced measured data. The Lomb-Scargle method is developed by Lomb [9] and later by Scargle [10] for the spectral analysis of both the even and uneven data. The method can also calculate the false alarm probability and the statistical significance of any peak [11].
During the experiments, API laser tracker device is used to track and to measure the feed cabin. The sampling frequency of API is 150 Hz. For the slowly varied moving feed cabin, before calculation, the measured data are needed to fit a line for removing the part of rigid motions.
The calculating procedure will be presented in the following. Assuming that there is a set of data: x
i
, i = 1,…N, the related time series are t
i
, i = 1,…N. Firstly, we calculate the average value

The range of frequency, f, is

where t r is the total time interval of the discrete data and M is an integer taking values 1, 2, 3,… and determines how many times higher than the “average” Nyquist frequency. M relies on the number of independent frequency. M is usually determined empirically, and it permits to examine the spectrum to a desired range. But this does not mean that all this range is significant. Because the basic limitations of aliasing in Shannon's sampling theorem are not valid here, there is not a priori limit for nonequidistant data. In this work, because the main range of frequency of FAST system can be estimated by the FE model in ANSYS, and M = 1.
The total number of frequency points is determined by the value of the parameter M [12]:

The interval between two consecutive frequencies is

So the value of the jth frequency, f j , is

Last, the power value of S(f j ) is defined by

where the parameter τ j is defined by the equation

By the Lomb-Scargle method, the frequency of maximum energy value is just the fundamental frequency.
3.2. The Design of a Digital Low-Pass Filter
As the above stated, we want to separate the fundamental frequency part from the measured data and remove the high-frequency part. After the above calculation, we have calculated the fundamental frequency. So the fundamental frequency can be applied as the cutoff frequency of the digital low-pass filter.
The vibration control on unvaried flexible structure usually adopts low-pass filter. In paper [13], the transfer function of the filter is

where f rf is the cutoff frequency.
Equation (8) is a conventional transfer function of low-pass filter. In this work, we also design a digital low-pass filter by (8). But the cutoff frequency, f rf , is no longer a constant value. The cutoff frequency, f rf , will be updated by the real-time calculated fundamental frequency. So the filter will be adaptive during the whole FAST motion.
Measured data will be filtered in each second and it is enough for the slowly moving FAST system. Last, the real-time filter procedures are as follows:
fitting line for removing the rigid motions;
calculating the fundamental frequency by Lomb-Scargle method;
updating the cutoff frequency, f rf , of the low-pass filter;
filtering the measured data;
adding the rigid motions.
All the procedures can be programmed. So the procedures will almost not delay time for the entire system. After the above procedures, the measured data will only remain in the rigid motion part and the fundamental frequency part theoretically. When the processed data are used to the coarse control, resonance can be avoided and the quality of control will be improved in the cabin-cable system.
4. Experiments
4.1. Calculating the Fundamental Frequency
In this FAST 5 m model experiments, we firstly choose 4 different positions to confirm the accuracy of the calculation of the fundamental frequency, which is showed in Table 1.
Four different positions of cabin.

On each position, API laser tracker device tracks the vibration of feed cabin; in the meantime, Modal Analyzer is also used to measure the modal of the feed cabin, and Figure 3 shows the experiment site.

The experiment site of FAST 5 m model.
Modal Analyzer can obtain the modal of feed cabin and draw the related frequency spectrum figures. The Modal Analyzer is based on Fourier transform. It samples signal by sensors attached to the feed cabin. When it calculates the frequency spectrum by FFT, it will utilize interpolation scheme to estimate and add the missing value. So the measured data are guaranteed to be evenly spaced. The Modal Analyzer has been widely used in the analysis of the frequency spectrum. In this work, the results of Modal Analyzer verify the calculation of fundamental frequency.
In Figure 4 ((a), (b), (c), and (d) are corresponding to the four positions in Table 1), we can obtain the fundamental frequency from the frequency spectrum figures easily. The maximal peak is the fundamental frequency point in each frequency spectrum, as Table 2 shows.
The comparisons between the calculation and the modal analyzer.


The frequency spectrums of four different positions in Modal Analyzer.
The measured data of four positions are transformed by using the Lomb-Scargle method. Figure 5 shows all the frequency spectrum periodograms.

The calculating results of four different positions.
Table 2 shows the comparisons between the measured modals and the calculated modals. Through the comparison, we can make conclusions that the maximum error is 0.031 Hz on d position, and the calculation of the fundamental frequency on different positions is very accurate.
4.2. The Experiment of Low-Pass Filter
In this experiment of FAST 5 m model, planning a theoretical straight line trajectory firstly. The path starts from point (1909.0505, 1772.097, −984.55823) to point (1867.7141, 1720.1398, −875.80542). During the whole motion, API laser tracker device will track the feed cabin all the time and transfer the measured data to coarse control.
This experiment includes two parts. Firstly, the measured data is directly used for the coarse control without the real-time filter during the whole motion. Secondly, the measured data is processed by the real-time filter and then transferred to the coarse control.
To verify the filter, compare the first step and the second step and draw two curves, as shown in Figure 6. Without the filter, the feed cabin vibrates strongly. It is not conducive for feed cabin to locate. However, after filtering, the motion of the feed cabin becomes smoother. The feed cabin moves more stably.

The comparison between modals with filtering and without filtering.
By selecting measurement data of one position, compare the frequency component between without filter and with filter. As Table 3 shows, with low-pass filtering, the high-frequency components are removed. The control quality will be better because of avoiding the vibration. The experiment proves the validity of the filter.
The comparison between modals without filter and with filter.

5. Conclusions
In this paper, a real-time filter based on the analysis of frequency is proposed. The fundamental frequency is real-time calculated and then the filter is updated. With the low-pass filter, the high-frequency parts are removed from the measured data. It improves the stability of the feed cabin system. The related experiments prove the results. It will be very useful for FAST engineering.
Conflict of Interests
The authors declare that there is no conflict of interests regarding the publication of this paper.