
Abstract
Heat recovery unit (HRU) is a heat exchange device in drying process. In HRU, room air is preheated by waste hot air and then transported to drying oven to remove moisture, which helps to save both energy and time. The main purpose of this paper is to build a heat transfer model of HRU and study its characteristics. A numerical method based on fluid-solid coupling was used to calculate the heat transfer between tube and fluids, and the actual structure was simplified to improve computation efficiency. The results were validated by theoretical calculation and experiments. Effects of Reynolds number (Re) on outlet temperature, Nusselt number, and pressure drop were investigated. It was found that the thermal resistance of shell side is large, by reducing which the total heat transfer coefficient can be improved. The difference between finned tube and smooth tube is in the shell side. Larger Re of shell side leads to good heat transfer performance but also larger pressure drop which increases the flow resistance.
1. Introduction
The heat recovery unit (HRU) is a waste heat recovery device in printing process. The printed wet papers are sent into drying oven before being rolled up. Most of the existing devices use room air for drying and the air is discharged directly. However, the proposed HRU uses the waste hot air to heat up room air. After that the heated air is blown into drying oven, which saves a lot of energy and heating time.
The HRU is a kind of shell-and-tube heat exchanger. There are many researches about the shell-and-tube heat exchanger. By changing the structural parameters of baffles [1, 2], fins [3, 4], tapes [5], and other accessories, the heat exchange efficiency was improved. Experiments are proved to be the most reliable and direct research method. With the rapid development of computer and CFD technology, the numerical simulation is another convenient and effective research method of lower cost and good accuracy [6]. The most important is that numerical method is free of operating conditions and could explore internal flow and temperature field.
The effects of baffle structures on fluid flow and heat transfer in shell side were studied with numerical method [7–12]. Some researchers [13, 14] studied the relationship between fin shapes and fluid flow in shell side. Seo et al. [15] researched the shell side flow and surface reaction of shell side in the catalytic heat exchanger. Hughes et al. [16, 17] analyzed the variation of pressure and shear rate when the non-Newtonian fluid flows through baffles in shell side. Huang et al. [18] analyzed the effects of different combinations of heat exchange mudules. Kurnia et al. [19] compared heat transfer performance of various configurations of coiled noncircular tubes with computational fluid dynamic approach.
When using numerical method to separately simulate the shell side or tube side flow, the heat transfer type of walls needs to be set with constant parameters, such as temperature, transfer coefficient, and heat flux, which are not consistant with actual working conditions. To solve this problem, UDF (user defined functions) were used to improve the continuty of heat transfer and temperature variation between tube side and shell side [20]. Another convinient solution is coupling the walls between fluid and solid. Then the heat conduction and heat convection can be calculated at the same time. Jayakumar et al. [21] built four models of different wall types including the above three constant settings and a coupled heat transfer model to analyze the variation of Nusselt number (Nu). The results showed that the coupled heat transfer model is more suitable for predicting the actual heat transfer process. Using coupled method, Kuchi et al. [22] built a steady-state, laminar, two-dimensional axisymmetric shell-and-tube model with counter flow and parallel flow arrangements to investigate heat transfer and chemical reactions in decomposer. Zhang et al. [23] built a three-dimensional model of a helically baffled heat exchanger combined with finned tube; mainly discussed the effects of shell side Reynolds number (Re) on heat transfer coefficients and pressure drop. Jiang and Deng [24] simplyfied a super large shell-and-tube heat exchanger as a heat exchanger network composed of lots of simple single row heat exchange structure and researched the relationship between the network structure and temperature crossover. It can be seen that the application of fluid-solid coupled method is not enough, especially on turbulent flow in shell-and-tube heat exchangers.
In the present study, a simplified model of HRU is built and a numerical simulation based on fluid-solid coupled method is applied to study the process of heat conduction and convection. For both finned tube and smooth tube, the relationships between Re, Nu, pressure drop, and outlet temperature are analyzed.
2. Structure of HRU
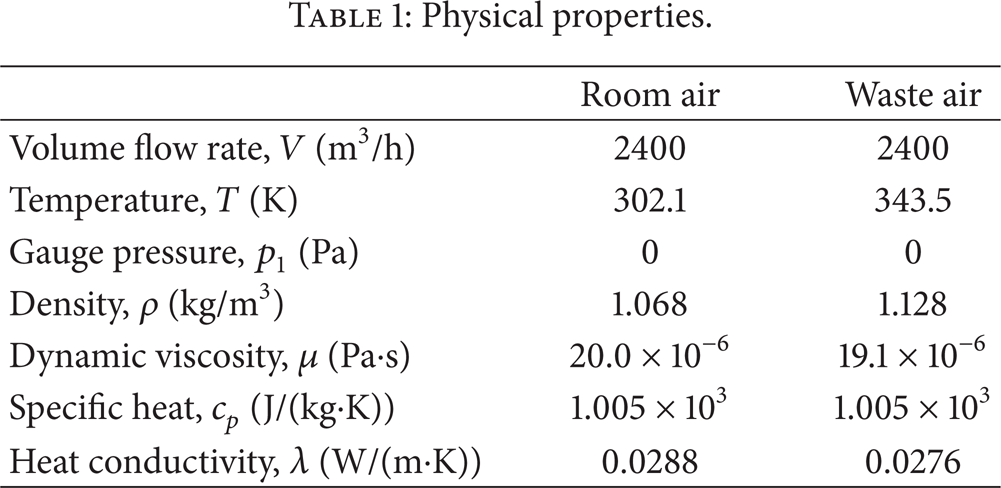
The HRU (Figure 1) is composed of an insulation box and 144 aluminum longitudinal finned tubes. The insulation box is 1146 × 1050 × 3250 mm cubical box, in the middle of which there is a plate dividing the shell side flow region to form a counter passageway. The inlet and outlet of the shell side fluid are on the top of the box while the inlet and outlet of the tube side fluid are located on both sides of the box, respectively. The 144 Φ38 tubes are distributed as regular triangles and their bottoms are connected with a water tank which is used to discharge the water condensed in the tubes. On the tube side the waste hot air is used as hot fluid and the room air of lower temperature is on the shell side. The flow rate of both fluids is controlled by two centrifugal fans. The properties of the waste hot air and room air are shown in Table 1.
Physical properties.

Structure diagram of HRU.
3. Numerical Method
The counter flow is used in the HRU, and the tube side is the waste hot air while the shell side is the room cold air. There are a total of 144 finned tubes in the heater. Computing a complete model with so many tubes will cost long time and the accuracy is closely related to grid. To build a simple and accurate model, we made the following hypotheses:
the hot and cold fluids can evenly pass through the tube side and the shell side, so the model contains only a pair of tubes;
the hot fluid evenly surrounds the finned tube, so the shell side is a coaxial Φ70 zone around the tube.
3.1. Governing Equations
The air flow in HRU is turbulent flow. The steady flow field was obtained by calculating Navier-Stokes equation with standard k-∊ model. The governing equations to be solved are
continuity equation:
momentum equation:

where p is the static pressure and
Energy equation is as follows:

where λeff is the effective conductivity, which consists of the thermal conductivity and the turbulent thermal conductivity; μ is the viscosity; the fluid energy E is defined as

The turbulent kinetic energy, k, and its rate of dissipation, ∊, are obtained from the following transport equations:

In these two equations, G k is the generation of turbulent kinetic energy due to mean velocity gradients; G b is the generation of turbulent kinetic energy due to buoyancy; Y M is the contribution of the fluctuating dilatation in compressible turbulence to the overall dissipation rate; and μ t represents the turbulent viscosity.
3.2. Coupled Method
The coupled method includes generation of two-side walls and setting of thermal condition. In Gambit the computational zone is divided into connected fluid and solid parts by solid splitting. Then the fluid parts are connected with the solid parts with a single joint surface, which is called two-side wall. In Gambit, those surfaces are set to be wall.
When the grid is imported into Fluent, a shadow zone will be created automatically so that each side of the two-side wall is a distinct wall zone. Material of the fluid side is air and material of the solid side is aluminum. To couple the two sides of the wall, the coupled option should be chosen. The solver can calculate heat transfer directly from the solution in the adjacent cells without additional thermal boundary conditions.
3.3. Mesh and Boundary Conditions
The simplified three-dimensional structure of HRU is shown in Figure 2. The structure contains three zones: shell side, tube side, and finned tubes. At the bottom the red region is the water tank connected with the tube side. Figure 3 shows the cross section of the finned tube and the smooth tube.

Simplified structure.

Cross section of the tubes: (a) finned tube and (b) smooth tube.
The computational domain is divided into fourteen parts. The six irregular parts are meshed with unstructured cell, and the eight straight parts are meshed with structured cell as shown in Figure 4. Table 2 lists the grid independence check of the finned tube model. Considering accuracy and computational time, the grid 3 of 764 224 cells was used for simulation and the same cell size grid was built for smooth tube model with about 520 000 cells.
Grid independence of finned model.


Meshing grid: (a) irregular parts and (b) straight parts.
The boundary conditions are as follows:
hot fluid: mass flow inlet with T = 343.5 K and pressure outlet of 0 Pa were used;
cold fluid: mass flow inlet with T = 302.1 K and pressure outlet of 0 Pa were used;
walls: outer surfaces of shell side were regarded as adiabatic; the surfaces of the tubes were coupled wall, on which heat conduction and convection were calculated simultaneously.
4. Theoretical and Experimental Methods
4.1. Theoretical Calculation
In HRU, heat transfer includes convection of fluids and heat conduction within tubes. For steady flow, the heat transfer rate equation and conservation equation are

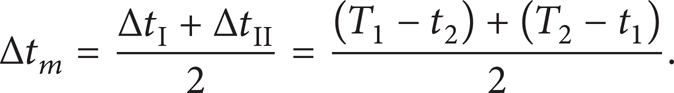
where Q is the heat transfer rate; A is the surface area; ms1 and ms2 are mass flow rate of hot fluid and cold fluid; cp1 and cp2 are the specific heat of hot fluid and cold fluid; T1 and T2 are inlet and outlet temperature of hot fluid; and t1 and t2 are inlet and outlet temperature of cold fluid. Δt m is the mean temperature difference, which is determined by
The overall heat transfer coefficient based on outer surface of tube K o is

where α1 and α2 are the heat transfer coefficients of hot fluid and cold fluid; Rs1 and Rs2 are fouling resistances of hot fluid and cold fluid; d o , d i , and d m are outer diameter, inner diameter, and average diameter of the tube; b is the thickness of the tube; and λ is the thermal conductivity of the tube.
Through (7) the outlet temperature T2, t2, and heat transfer rate Q can be solved.
4.2. Experiment Apparatus and Procedure
In the present work, heat transfer performances of HRU with finned tube are studied experimentally. The experiment apparatus includes HRU, drying oven, and two centrifugal fans as shown in Figure 5. The red arrows show the flow direction of waste hot air, while the blue arrows show flow direction of room air. Measurements of inlet and outlet fluid temperature are carried out using four thermal couples. According to actual operation conditions, four drying ovens were arranged in series to complete drying process. Figure 6 shows the photo of testing site. The centrifugal fans are located basically the same as in Figure 1. The drying oven and HRU were connected with two tubes.
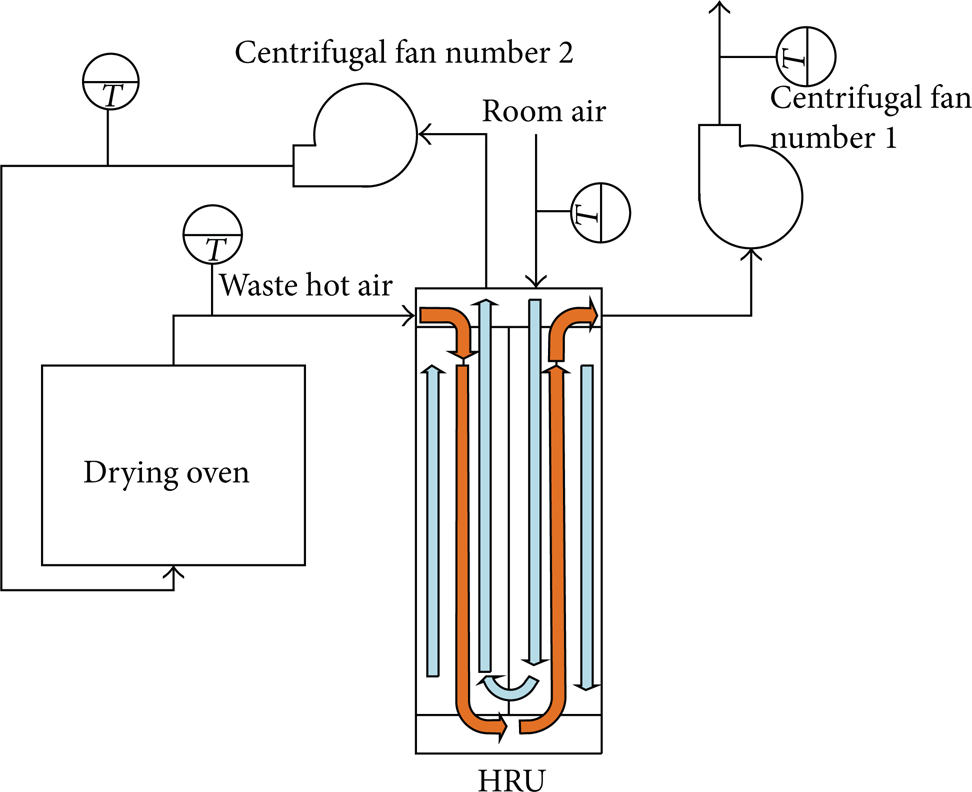
Schematic of experiment apparatus.

Photo of testing site.
To make sure steady gas flow, centrifugal fans were firstly started, and then the drying oven, in which the temperature is set as 107.5°C. Measurements are taken only after outlet temperatures attain steady values. The relative moisture at outlet of shell side was also measured to see whether phase transition happened and the testing data shows that the change of moisture is 7.6%. In order to assure the accuracy of experiments, the test procedures were repeated every thirty minutes for three times and the results were compared with theoretical calculations (in Section 5.1).
5. Results and Discussion
5.1. Comparison with Experiments
To validate the numerical method, the simulated results were compared with experiments and theoretical calculations. The experiment results are listed in Table 3. Under the same working conditions, the temperature of inlet and outlet was measured. The results error of the three tests is small and we used the average data for comparison as shown in Table 4. The maximum relative error of heat transfer rate between the numerical method and other two methods is less than 16%. The main causes of error could be the location of measuring points and phase transition of a small amount of steam. The measuring points are not exactly at the inlet or outlet, so along the pipeline there may be heat transfer between fluids and room air. Phase transition will release a great deal of latent heat even for little steam. In the numerical model, the fouling resistance was ignored, which may also result in deviation. For engineering analysis, the error is within a permissible range. Hence, the hypotheses are proved to be reasonable and the simplified method could be used in other researches of shell-and-tube exchangers.
Experimental results.

Results comparison.

5.2. Distribution of Temperature and Turbulence
The temperature and flow field in HRU were investigated. In Figure 7 the temperature of cold fluid increases gradually, and at outlet the temperature difference between two fluids is small. Figure 8 shows the temperature variation trends of hot fluid, cold fluid, and tubes. For the counter flow, the temperature difference of the fluids is Δt1 = 21 K and Δt2 = 23 K, and slopes of the three curves are almost the same.

Temperature contour on x = 0 mm plane.

Temperature variation along flow direction.
From the temperature contour of the cross section (Figure 9), we can see that the added heat transfer area of the longitudinal fins can increase heat transfer rate and the temperature gradient is larger. The turbulence intensity of the cross section is shown in Figure 10. The turbulence intensity around the fins is higher, which can improve the heat transfer coefficient of shell side. The turbulence intensity of tube side is apparently higher than that of shell side. Because of the larger thermal resistance of shell side, the total heat transfer coefficient is small. So increasing the flow rate of shell side could increase the turbulent intensity and enhance the heat transfer.

Temperature contour on z = 1600 mm plane.

Turbulence intensity contour on z = 1600 mm plane.
5.3. Effects of Re on Temperature and Nu
Figures 11 and 12 show the variation of cold fluid temperature t2 with Re. The numerical simulation results agree well with the theoretical calculation. The deviation of t2 is less than 0.3%. In Figure 11 t2 increases with shell side Re while tube side flow rate is constant. Conversely, in Figure 12 when the tube side Re increases, t2 decreases. This is because the faster the cold fluid passes through, the less heat is transferred to it; on the other hand, the faster the hot fluid passes through the tube side, the more heat it brings. Therefore decreasing ms2 and increasing ms1 could increase t2. It can be seen from the figures that t2 of the finned tube model is always higher than that of smooth tube model, which demonstrates the effective heat transfer in the finned tube model.
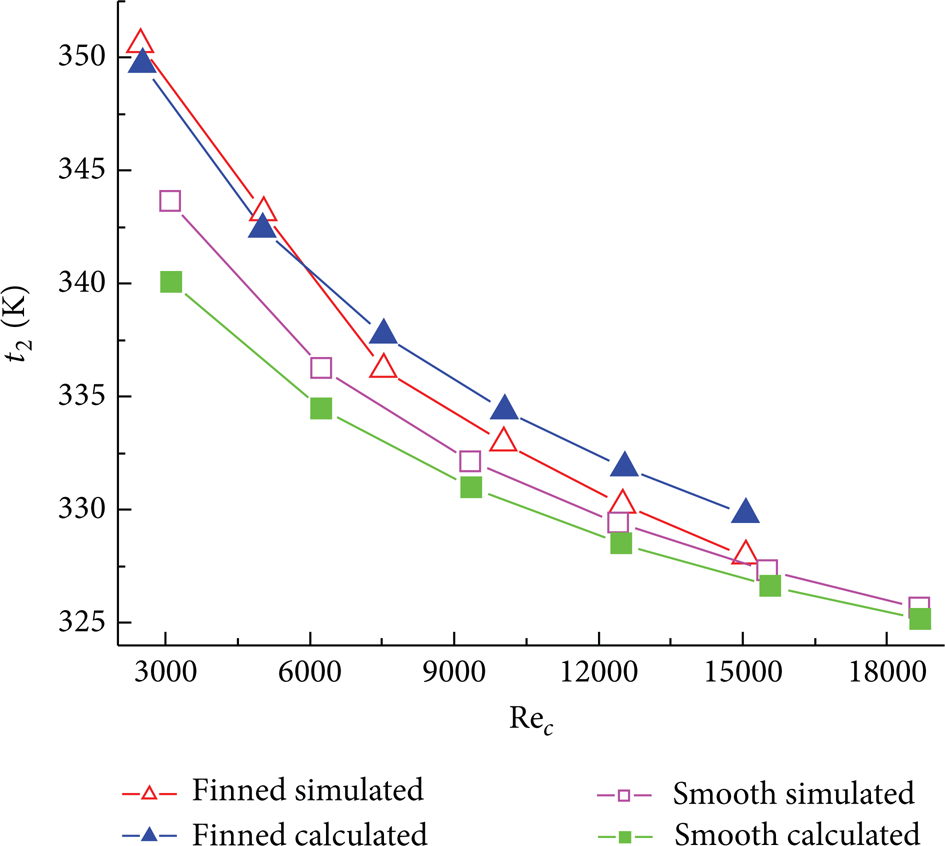
Cold fluid outlet temperature of shell side.

Cold fluid outlet temperature of tube side.
Nu, Re, and Prandtl number (Pr) are the three characteristic numbers to describe the forced turbulent heat transfer. Nu represents the intensity of heat convection, Re represents the flow status and turbulence intensity, and Pr represents the physical properties related to heat transfer. Their relationship can be expressed as a power function:

where Pr changing slightly with temperature and the value is approximately 0.7. Hence the effects of Pr are neglected, and the Re is mainly considered.
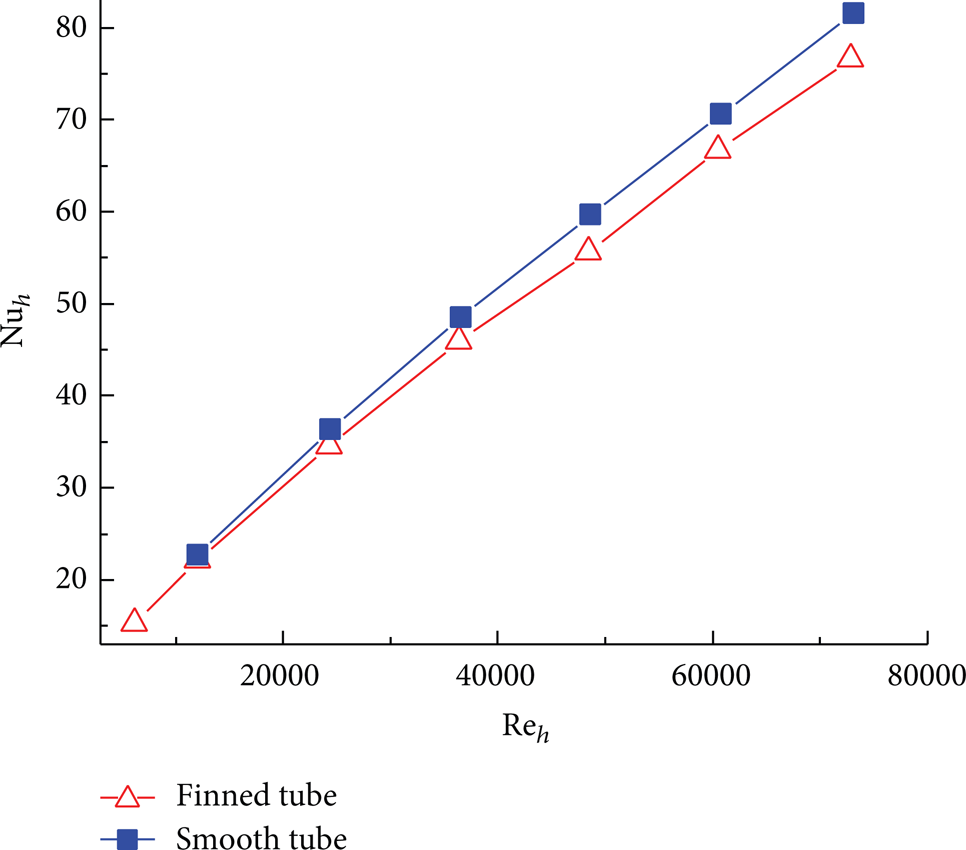
Figure 13 shows the variation of Nu with the shell side Re. Nu is almost proportional to Re within the range in the diagram. It is obvious that Nu and its slope of the finned tube model are larger than the smooth tube. Figure 14 shows the variation of Nu with the tube side Re. Nu is also proportional to Re and the difference of the two models is little.

Nusselt number of shell side.
Nusselt number of tube side.
5.4. Effects of Re on Pressure Drop
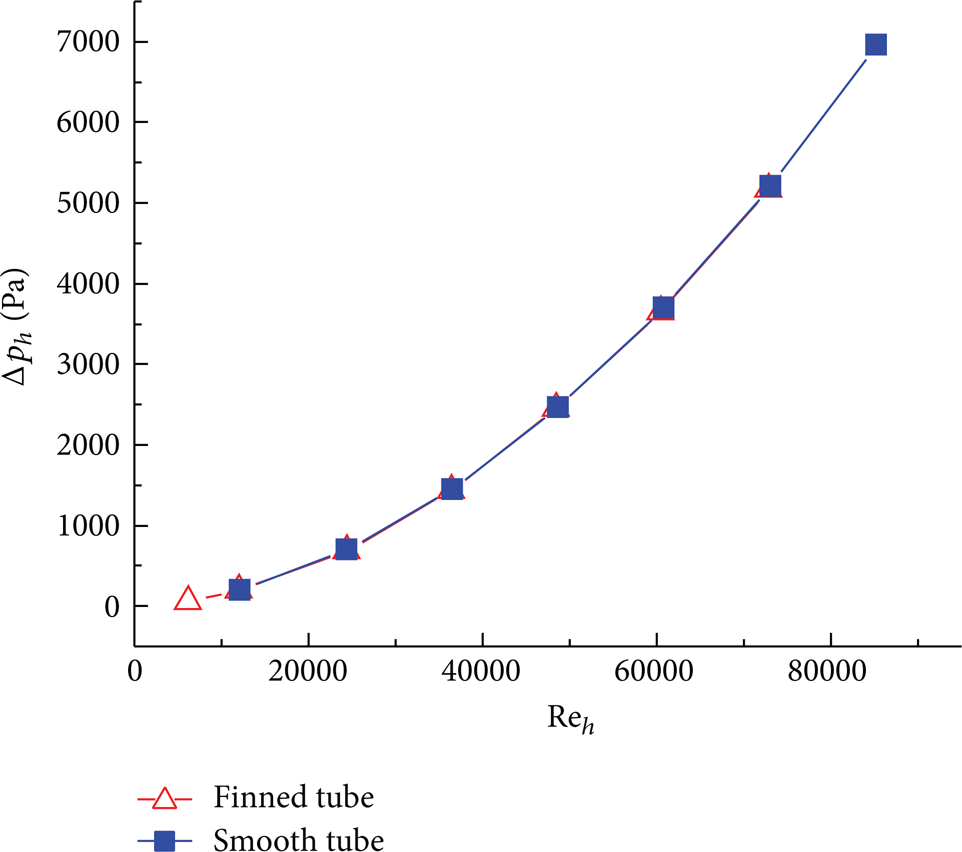
Figure 15 shows that pressure drop Δp increases with shell side Re for the two models. Δp of the finned tube is larger and growing faster than the smooth tube. At Re c = 15000, the Δp of finned tube is about 86% larger than the smooth tube. Figure 16 shows that Δp also increases with tube side Re. It is shown that the two curves overlap with each other; that is to say the structure of fin has no effects on the pressure drop in tube side. The finned tube will gain the shell side pressure drop. In the design and use of finned tubes the heat transfer efficiency and pressure drop should be both taken into consideration.

Pressure drop of shell side.
Pressure drop of tube side.
6. Conclusions
HRU is a heat exchange device in printing process, which preheats room air with waste hot air to save energy and improve efficiency. A fluid-solid coupled method was used to simulate heat transfer in HRU and the results were compared with experiments and theoretical calculation. Based on the investigation in this paper, the following conclusions can be drawn.
With the fluid-solid coupled method, the heat flux of fluid surface is computed directly rather than set as constant value. The results of simplified model with one pair of tubes agree well with theoretical calculation and experiments. The hypotheses were proved to be reasonable.
For counter flow, the three temperature curves of fluids and tubes are of almost the same slope. The turbulence intensity around the fins is higher, which can improve the heat transfer coefficient.
The effects of Re on characteristics of both finned tube and smooth tube were observed. Under working conditions, Nu and Δp increase with Re. The difference between finned tube and smooth tube is in the shell side. Larger Re of shell side leads to good heat transfer performance but also larger pressure drop which increases the flow resistance.
Research on HRU has important value to improve its performance and provides some references for using and designing energy-saving devices of other industrial processes.
Conflict of Interests
The authors declare that there is no conflict of interests regarding the publication of this paper.
Footnotes
Acknowledgments
This work is supported by the Science and Technology Department of Zhejiang Province, China, through no. 2012C11002, and Key Science-Technology Innovation Team of Zhejiang Province, China, through no. 2011R50005.