
Abstract
Fatigue characteristics of A7075-T651 aluminum material were studied with surface treatment of shot peening. The fatigue life was characterized by two fatigue testing methods, ultrasonic fatigue test (UFT, 20 kHz) and the rotary-bending fatigue test (RFT, 53 Hz). The fatigue life improvement was confirmed by rotary bending fatigue tester. However, the surface modification effects were hardly observed by UFT method. The RFT results validate that the fatigue properties of RFT show a fine congruence regardless of the test machine types. The results of hardness, compressive residual stress, fatigue strength, and mechanical properties of specimen were improved by shot peening.
1. Introduction
Fatigue crack occurs due to the cyclic loading, which will primarily cause progressive and localized damage in materials utilized at automobiles, aircraft, and equipment parts and may lead to permanent fatigue failure. Further, in many cases, the severe deterioration of the key components is mainly caused by the fatigue cracks [1–3].
The use of aluminum alloy A7075-T651 is increasing, in accordance with the current trend of weight reduction, such as the damping and braking system of the aircraft. Thus, the improvement of fatigue strength is required for the high reliability in the extended range of service life.
In that sense, fatigue crack characterization and improvement are of significant importance. There are well known techniques to generate intensive compressive residual stress in the subsurface of materials in order to prevent crack formation and crack propagation. This could dramatically diminish economic losses predominantly that resulted from the infrastructural accidents and the component replacement, since the crack preventing technology is inevitable to prevent the sudden fracture by fatigue [4–6]. Shot peening is one of the ways to improve the fatigue life of the material [7, 8].
Various fatigue tests were in accordance with the magnitude of the impinged steel balls. Previous studies on gigacycle fatigue testing of high carbon chromium steel regarding the durability and processing method of the material were performed with the correlation of shot peening impingement angle and the acceleration [9–11]. This study focused on the fatigue tests in the range of very high cycle fatigue (VHCF) and the fatigue characteristic improvement by the shot peening (SP). SP treatment was carried out to generate a compressive residual stress by altering the SP pressure (5, 10, 15, 25, and 35 psi) on the raw material. The prime target is to improve the fatigue characteristics in the regime of very high cycle fatigue, in order to overcome the limitation of well-known fatigue properties of specimens and to provide the novel data that could cover the conventional hand books which only supply limited data up to high cycle fatigue regime (HCF). The fatigue life was characterized by two fatigue testing methods, the ultrasonic fatigue test (UFT, 20 kHz) and the rotary-bending fatigue test (RFT, 53 Hz). For the RFT, simple beam type (single spindle) and cantilever type (dual spindle) fatigue test machines were utilized.
2. Experimental Procedures
Three kinds of fatigue specimens were prepared for the test. Surface roughness and residual stress were measured after the shot peening process. Mechanical properties were characterized to confirm the effects of SP. Fractured surface was observed with the scanning electron microscopy in order to understand the properties of the “before SP” (as-received, untreated speciment) and “after SP” (shot peened, treated specimen) on the A7075-T651 aluminum alloy.
2.1. Specimen and Configuration
The material used in this study is an aluminum alloy A7075-T651. Chemical composition of the specimen is listed in Table 1. The specimens are standardized in order to meet the stress concentration factor for each of different fatigue testing methods utilized by three different fatigue testing machines. The shapes and dimensions of the specimen for fatigue test are shown in the following figures. Figures 1(a) and 1(b) show rotary-bending fatigue test (RFT, 53 Hz) specimen for cantilever type and Ohno type, respectively. The diameter for the tested portion of the specimen neck of Figure 1(a) is 4 mm, and the concentration factor was K t = 1.08. Figure 1(c) shows the specimen configuration adopted for ultrasonic fatigue test (UFT, 20 kHz).
Chemical composition of A7075-T651 alloy.

Unit, %.

(a) Cantilever type fatigue specimen (RFT, 53 Hz, unit: mm), (b) simple beam type fatigue specimen (RFT, 53 Hz, unit: mm), and (c) configuration of ultrasonic fatigue test specimen (UFT, 20 kHz, unit: mm).
Fatigue properties were characterized after adopting shot peening treatment on aluminum alloy specimen with altering the SP process condition. Test specimens are sorted into two groups and designated as “before SP” and “after SP” treatments. For tensile test, KS standard tensile test specimen was used.
The plate was machined along with the rolling direction, which is the axis perpendicular to the direction of crack advance. Test specimens “before SP” were polished with emery papers from #100 to #2000, buffed with aluminum oxide (Al2O3) to be processed into mirror-like finished surface. The specimens “after SP” were processed with five different SP pressures (5 psi, 10 psi, 15 psi, 25 psi, and 35 psi) after machining.
Shot peening machine (RPB6052, Progressive Technology, USA) was utilized with the fixed conditions in a plurality of variables of SP process. The SP air pressure is the only variable with the other optimized conditions as follows: ball size S070, media flow 12 lb/min, impingement distance 60 inch, feed rate 20 in/min, table spindle 30 rpm, cast steel shot ball, and press blast type.
2.2. Surface Roughness and Residual Stress
Fatigue characteristic and other mechanical characters are closely related to the initial state of surface roughness and residual stresses before the test. Therefore, surface roughness and residual stress were measured in advance of mechanical tests.
Surface profilometer (Mitutoyo, Surftest-500, Japan) was used to characterize the specimen roughness. Gauge length was 1.6 mm against the “after SP” and “before SP” specimens. The mean value of 10 times of measurement was taken for average roughness (R a ) and roughness depth (R z ), respectively.
Electrolytic polishing was performed on the cross section of specimen. Compressive residual stresses were measured from surface to depth direction for interval of 5 μm by using XRD (X-Ray Diffractometer, XStress 3000, Japan).
2.3. Mechanical Properties
The hardness was measured at regular interval from the surface to center line direction in order to understand the surface characteristics of “after SP” specimens. Micro-Vickers hardness tester (Future-Tech, FM 700e, Japan) was used for hardness test and the average of 10 times measurement on each depth was determined; indentation load was 30 g and dwell time was 30 sec.
Tensile test was carried out at a loading rate of 1 mm/min for obtaining mechanical properties of “after SP” and “before SP” materials, by using a hydraulic universal testing machine (KSU-10M, Korea).
Cantilever-type rotary-bending fatigue testing machine (Yamamoto, YRB200, Japan) for specimen Figure 1(a) (RFT, 53 Hz) was used as shown in Figure 2(a). Dual spindle can mount 4 test specimens simultaneously with an individual control of load levels for each specimen. Ohno-type fatigue tester (Shimazu, H7, Japan) for specimen (Figure 1(b)) as shown in Figure 2(b) is well known for a long period and has been used in many studies. However, only one specimen can be mounted at a time, and it is relatively difficult to preserve the fractured surface. Rotary-bending fatigue test was conducted at 3,180 rpm (53 Hz) after mounting test specimens in order to prevent eccentricity in no-load state. The stress ratio of rotary-bending fatigue test was R = − 1 and the test was conducted at the room temperature [12].
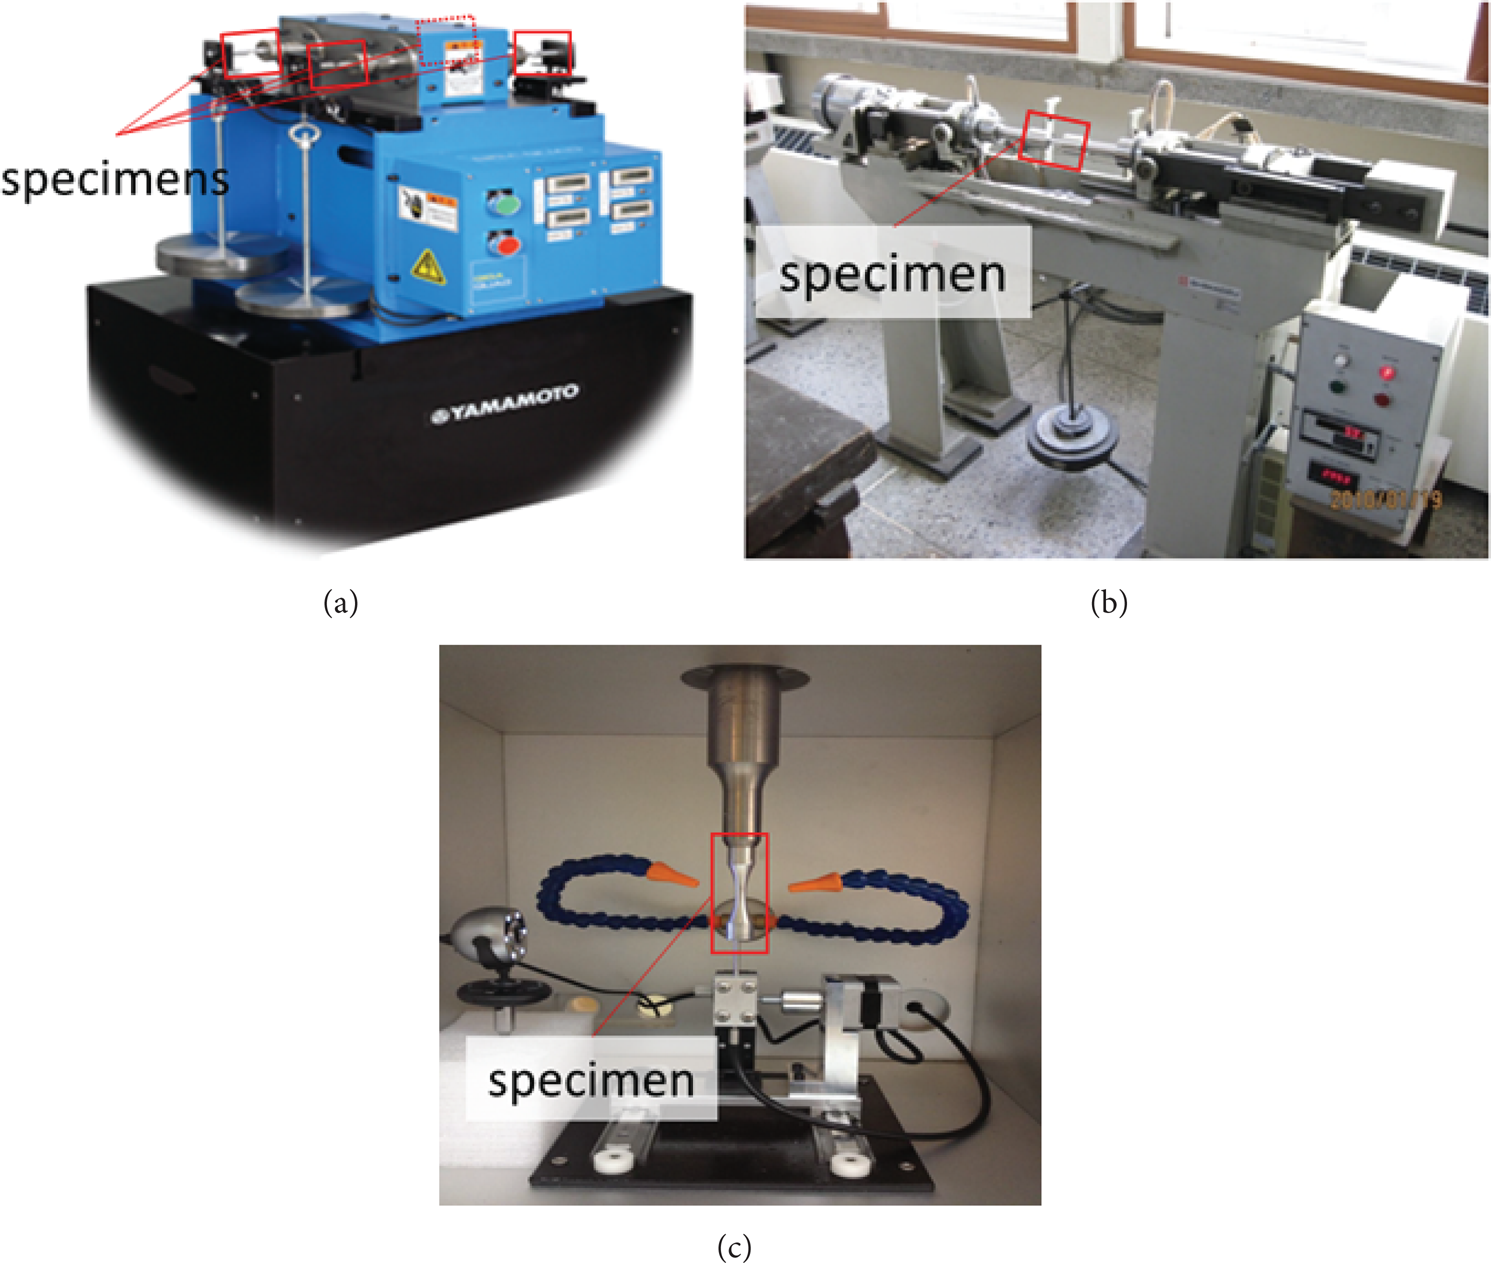
(a) Cantilever type dual-spindle rotary-bending fatigue testing machine for specimen Figure 1(a) (YRB200, Yamamoto, Japan, RFT, and 53 Hz). (b) Simple beam type rotary-bending fatigue testing machine for specimen Figure 1(b) (H7, Shimazu, Japan, RFT, and 53 Hz). (c) Ultrasonic fatigue testing machine for specimen Figure 1(c) (Mbrosia, UFT, Korea, 20 KHz).
The ultrasonic fatigue testing machine (Mbrosia, UFT, 20 KHz, Korea) for specimen (Figure 1(c)) as shown in Figure 2(c) was also utilized in order to compare the fatigue properties under the condition of R = − 1, at room temperature. In particular, the results of fatigue tests were compared for two fatigue test methods, the ultrasonic fatigue test (UFT) and rotary-bending fatigue testing (RFT). Fractured specimen after the fatigue test was observed by using scanning electron microscope (SEM, S-4700, Hitachi, Japan) to examine the crack behavior and unearth the main cause of fatigue crack initiation in test specimens of “after SP” and “before SP.” Some specimens were analyzed using energy-dispersive X-ray spectroscopy (EDS, H-7100, Hitachi, Japan) to analyze the compound in the specimen.
3. Results and Discussion
3.1. Surface Roughness
Surface roughness was demonstrated in Table 2 by comparing the state of the surface roughness for each test piece with different shot peened conditions. The results show that the higher SP pressure tends to increase the average roughness, R a , and roughness depth, R z , due to the severe plastic deformation by the ball impingement. Surface roughness of 15 psi condition is shown to be 3.6-fold times higher than that of “before SP” specimen, and 35 psi condition tends to increase 1.8-fold times higher than 15 psi.
Surface roughness “before SP” and “after SP.”

Figure 3 is an SE micrograph of surface conditions “after SP” with magnification of ×100. It can be seen that the SP pressure directly affected the surface state and altered the surface roughness intensively comparing the cases of 15 psi (Figure 3(a)) and 35 psi (Figure 3(b)). The dominant cause is severe plastic deformation (SPD) of the surface layer when the ball collision takes place during the SP process. It has been reported that this surface roughness has an important factor on the fatigue life under very long life region [9, 10, 13]. Figure 4(a) shows an example to understand the characteristics of the impinged ball used for shot peening. Through this SE micrograph, the size and shape were calculated. This shows the magnitude of balls as respective number. The ball size distribution shown in Figure 4(b) shows that the average size of the shot ball peening was 291.45 μm, maximum ball size was 358.5 μm, and minimum ball size was 210.9 μm.
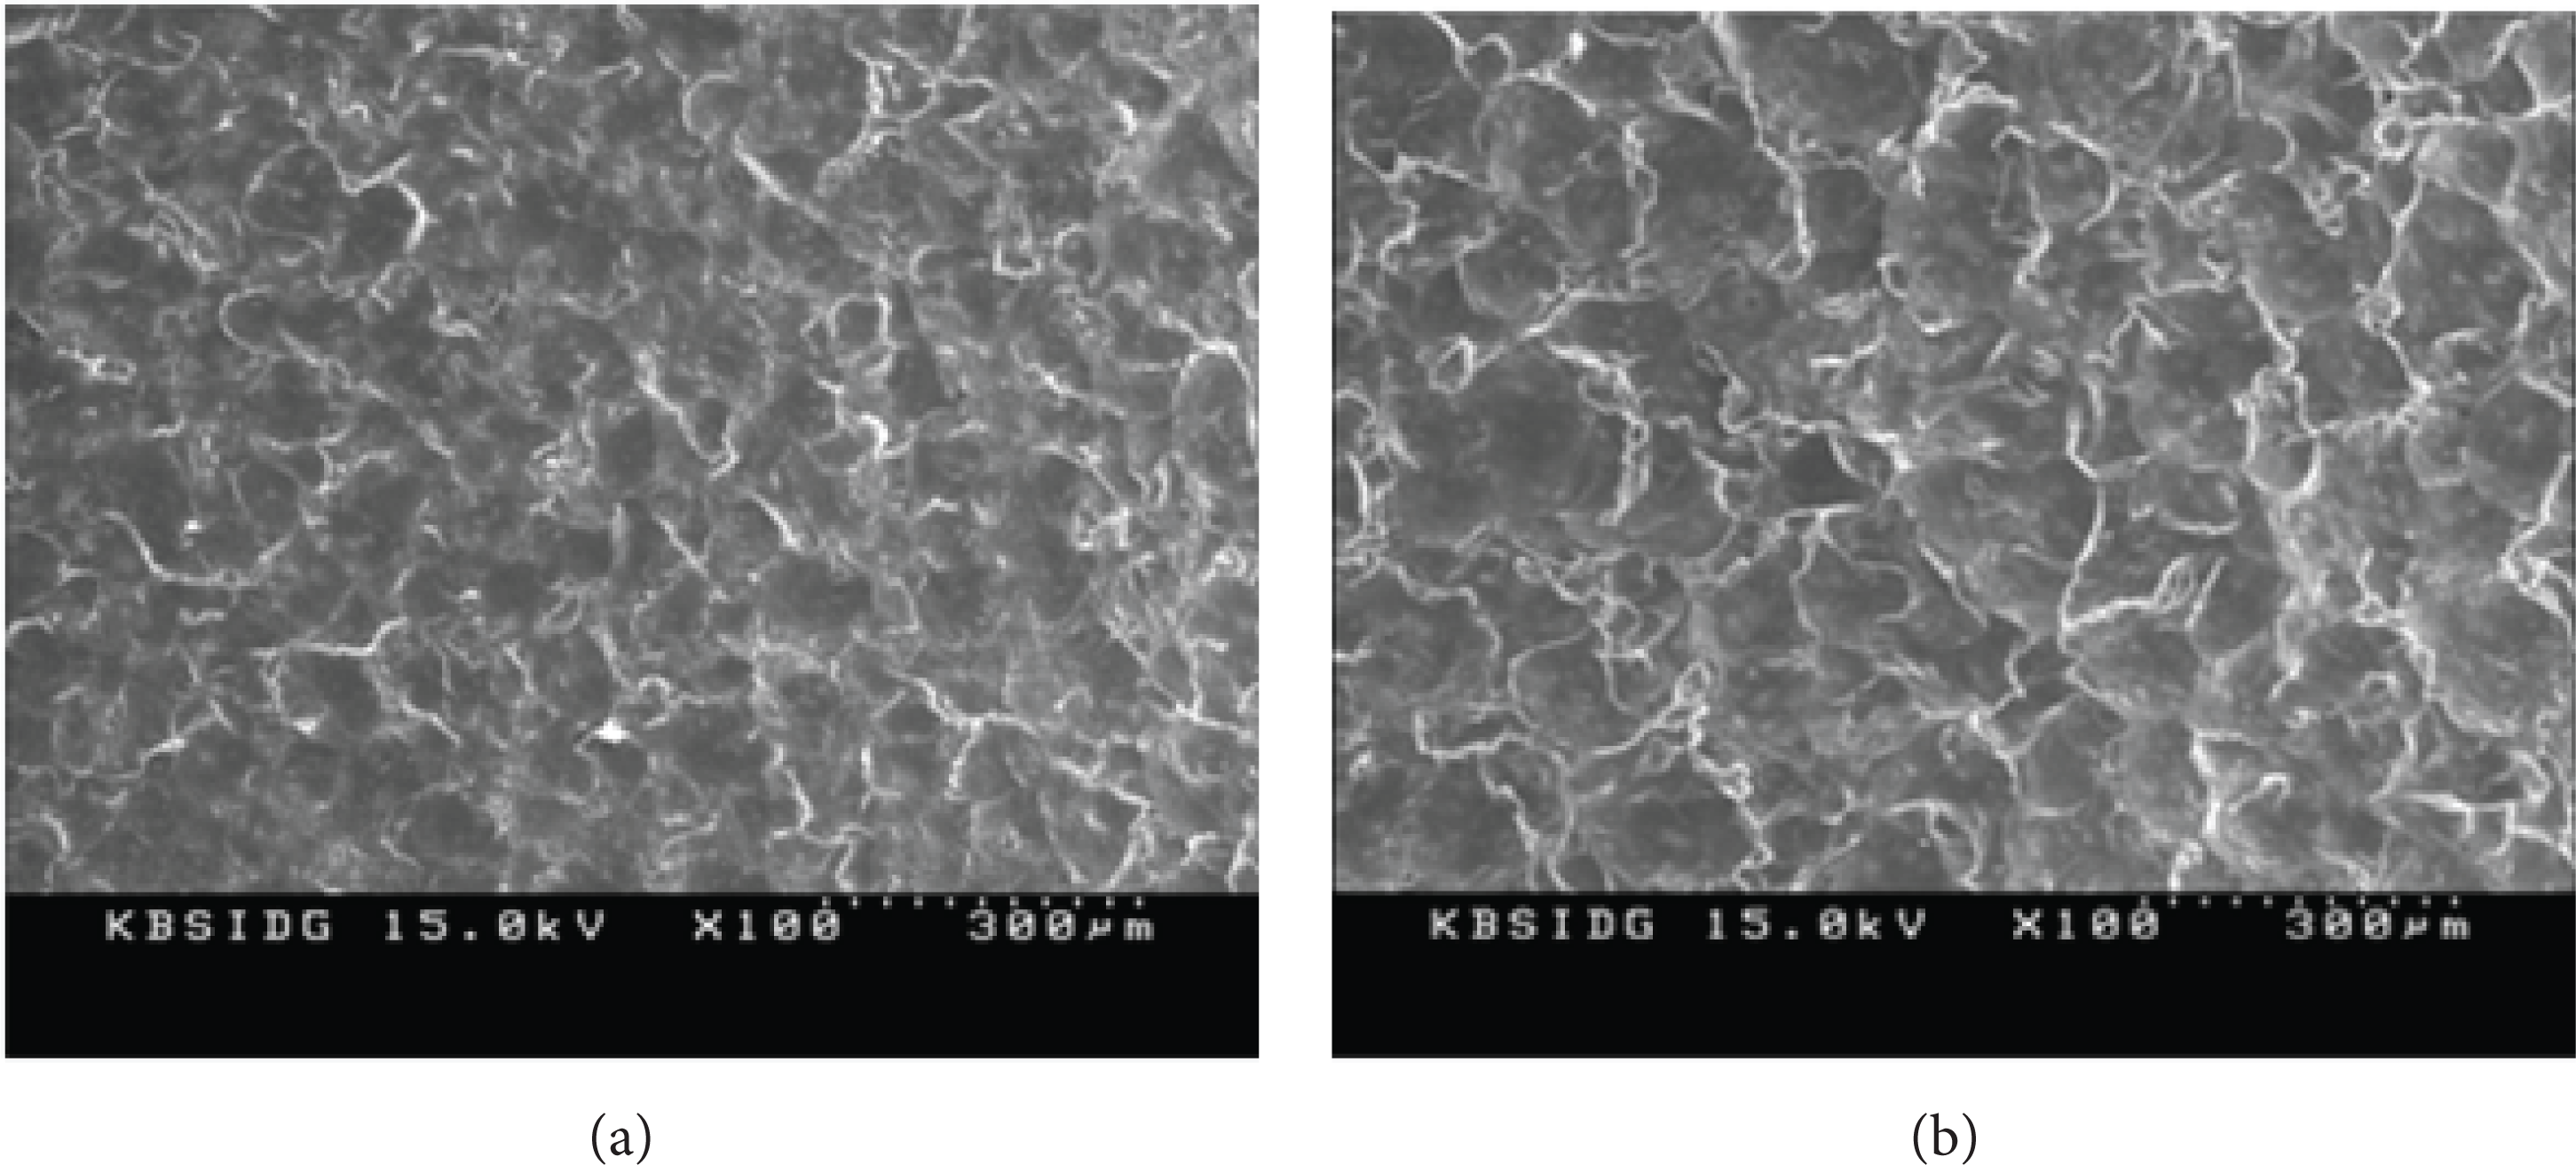
SEM observation of “after SP” specimens. (a) “After 15 psi-SP” and (b) “after 35 psi-SP.”
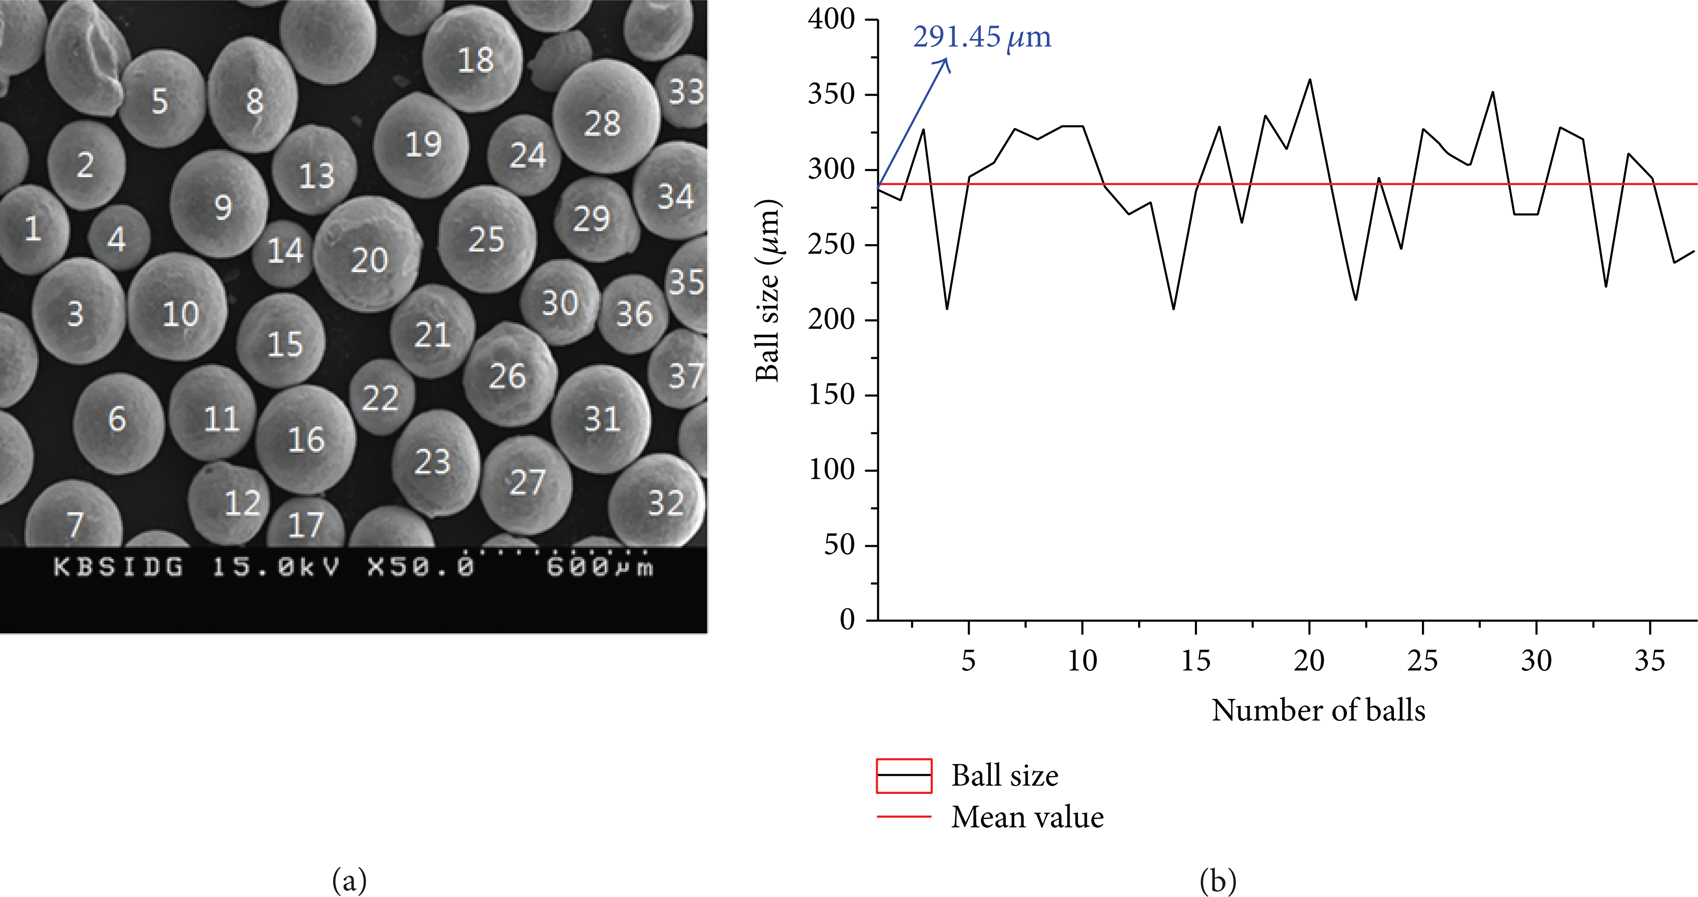
(a) SEM observation of shot balls (×50). (b) Distribution of the shot ball size.
3.2. Tensile Properties
Table 3 illustrates the overall mechanical properties of A7075-T651 material “before” and “after” the shot peening process. Shot peened materials show that the influence of the impingement pressure results in minute increase of mechanical properties. This is considered to be the cause of surface hardness improvement and the formation of residual stress up to a certain depth due to the severe plastic deformation (SPD) on the material surface [4–6].
Mechanical properties.

3.3. Hardness Test
Micro-Vickers hardness from surface to depth direction at interval of 20 μm is shown in Figure 5. The change of hardness was confirmed and gradually decreased from surface to the depth of 300 μm.

Variation of micro-Vickers hardness from surface to depth direction.
Each surface hardness of “35 psi-SP” and “15 psi-SP” is 14.3% and 11.2% hardened, respectively, regarding the hardness of “before SP.” Vickers hardness is in good accordance with the SP processing conditions that the surface hardness gradually increased as the increase of SP pressure.
3.4. Compressive Residual Stress
Compressive residual stress measured for “25 psi-SP” and “before SP” materials is plotted in Figure 6. Compared to the “before SP,” the compressive stress of “after SP” drastically increased from surface to depth of 300 μm, as shown in Figure 6. In case of the “before SP,” the depth of compressive residual stress was formed but only 70 μm depth. It is assumed that this is caused by the work hardening during the machining of the specimen. However, the SP effect is certainly larger for “after SP” specimens that the formation depth of the compressive residual stress was deeper and the overall area of residual stress was 5-fold times larger than “before SP.” The compressive residual stress formed on depth direction is known to attenuate the tensile loadings. Therefore, the initiation and growth of fatigue cracks may be suppressed by the compressive residual stress. The results show that the increase of fatigue life is quite remarkable. This tendency of life increase coincides with the previous findings of other studies [3–5].

Variation of compressive residual stress to depth of “before SP” and “after 25 psi-SP” specimen.
In case of “after SP,” we can observe severe plastic deformation (SPD) of approximately 0–100 μm from the surface to the depth direction of material. The SPD structure creates the synergistic effect on the hardness, compressive residual stress, and fatigue property within the range of plastic deformation caused by the microforging [4, 5].
This is caused by the vibration energy generated on the surface of specimen whilst the SP process where, the structural deformation changes into miniaturized texture due to the plastic deformation role was the dominant reason for the increase of hardness, material quality, resistance of abrasion, and fatigue property within the range of plastic deformation.
3.5. S-N Curves of Cantilever Type and Simple Beam Type
Figure 7 represents the S-N curve for two types of rotary-bending fatigue test, the cantilever type and simple beam type. The cantilever-type fatigue testing machine can simultaneously test four specimens, in great reduction of test period. However, the conventional Ohno-type fatigue tester can only test one specimen at a time. In this figure, by comparing both data of the rotary-bending fatigue testers, it was confirmed that the S-N curves of both tests coincide well with each other.
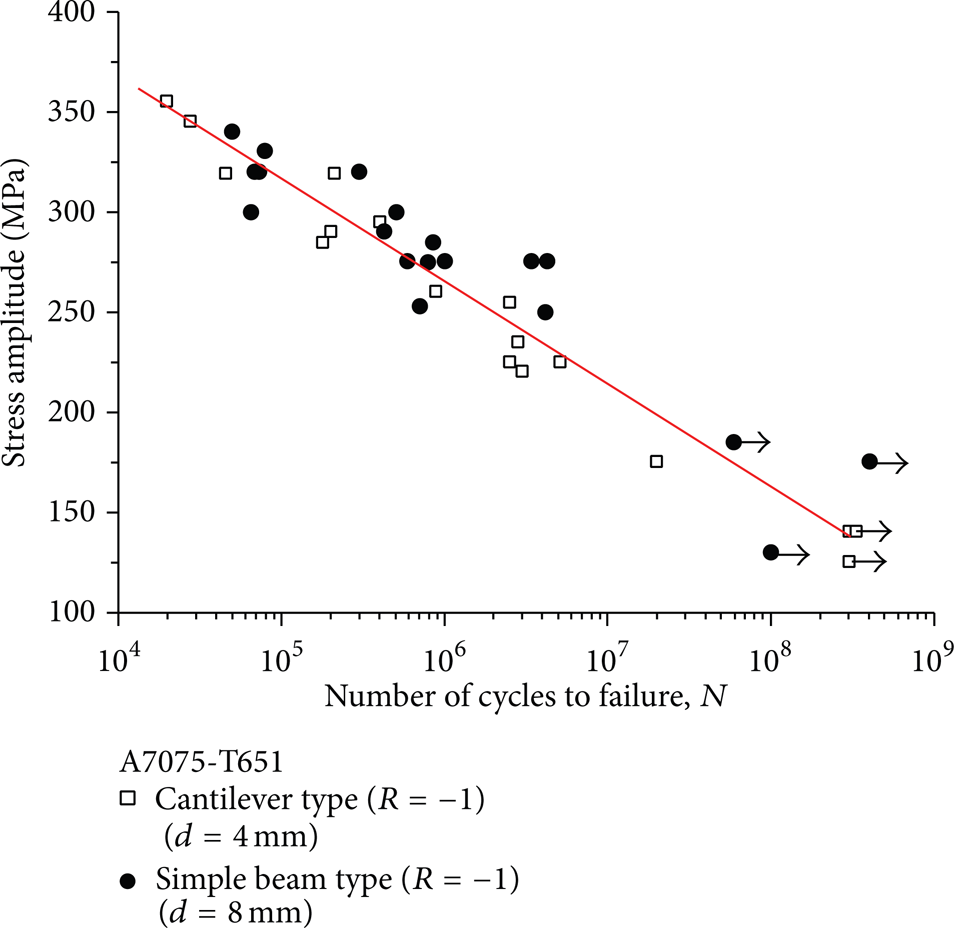
Comparison of the S-N curves from the cantilever type and the simple beam type fatigue testing machine using “before SP” specimen. The arrows indicate the stopped test specimen before the fracture.
The Ohno-type fatigue testing machine can only chuck one specimen at a time; the chucking method of the test piece is very difficult. In addition, the following reported issues are well known: severe vibration, loud noise, and difficulty to preserve the fracture surface.
However, the newly developed cantilever-type fatigue testing machine can simultaneously test four specimens at a time. In addition, test piece chucking method is very simpleand provide noiseless and vibrationless test environments. The fractured surface can be preserved as probability of near 100%. It is greatly efficient for over 109 cycles of fatigue testing in the regime of VHCF. Moreover, it could save time by three-fourths of conventional Ohno-type fatigue testing machine.
3.6. S-N Curves of SP Treated Specimen (RFT, 53 Hz)
As shown in Figure 8(a), the red colored solid line illustrates the S-N curve of the “before SP” of Figure 7. The “after SP” of 5 psi-SP and 10 psi-SP on aluminum A7075-T651 are plotted as dots. It shows that the stress amplitude tends to increase more for the shot peened specimens (5 psi-SP and 10 psi-SP) rather than the “before SP.”

(a) Comparison of the S-N curves between “before SP” and “after SP” treatments (5 psi and 10 psi). (b) Comparison of the S-N curves between “before SP” and “after SP” treatments (15 psi). (c) Comparison of the S-N curves between “before SP” and “after SP” treatments (5, 10, 15, 25, and 35 psi).
Figure 8(b) shows the comparison of 15 psi-SP as black line versus the red line as the S-N curves of “before SP” of Figure 7. In Figure 8(c), the stress amplitude of shot peened materials is compared for 25 psi-SP and 35 psi-SP specimens and that of “before SP” of Figure 7. It seems that the shot peening of 25 psi condition shows the most superior fatigue strength on A7075-T651 material among the other conditions of 5 psi-, 10 psi-, 15 psi-, and 35 psi-SP treatment. Fatigue life remarkably increased at the “25 psi-SP” treated A7075-T651 material compared to the other specimens at a stress levels of 250 MPa. Moreover, in the regime of low cycle fatigue (short life region), it shows lesser effect on fatigue life. However, in the region 109cycles fatigue (very long life region, VHCF), the effect on fatigue life was greatly increased, and the fatigue strength also increased remarkably. The effect of fatigue life increase by shot peening was confirmed as substantial; the similar results were also obtained from the surface treatment of DR (deep rolling) and UNSM (ultrasonic nanocrystalline surface modification) processing [4, 5].
Fatigue cracks were initiated on both surfaces of “before SP” and “after SP” specimens. The specimens were fractured from the surface originated fatigue crack. In case of “after 25 psi-SP,” fatigue endurance limit at 109 cycles was about 210 MPa. In case of “before SP,” the fatigue limit strength was about 125 MPa. The fatigue limit of SP specimens at 109 cycles was increased approximately 68% compared to that of the “before SP.”
3.7. S-N Curves of Ultrasonic Fatigue Tester (UFT, 20 kHz)
Figure 9(a) shows the S-N curves of an ultrasonic fatigue tester at 20 kHz frequency and a cantilever-type rotating-bending fatigue (R = − 1) at 53 Hz for the “before SP” specimen. The S-N curve of “before SP” as-received material by UFT shows a node around 3.5 × 10⁵ cycles. It is examined that the fatigue strength greatly reduced to that of cantilever-type fatigue testing machine (RFT, 53 Hz). However, in the regime of 5 × 10⁸ fatigue cycles or more, the gap is narrowing rapidly and both fatigue characteristics got similar.

(a) Comparison of the S-N curves between “before SP” specimens under UFT (20 kHz) and RFT (53 Hz). (b) Comparison of the S-N curves between “before SP” and “after SP” treatments under UFT (20 kHz) and RFT (53 Hz).
Ultrasonic fatigue test of R = − 1 caused the fatigue strength to be lower than the as-received material of RFT. The fatigue by UFT rapidly repeats in a very high speed; thus, the occurrence of fever directly affects the specimen. On the contrary, the rotating-bending fatigue test (RFT, 53 Hz) fully corresponds to the conventional industry application. The generated heat by the high frequency of UFT, which is 377 times greater than RFT, consequently deteriorates the original fatigue strength. As shown in Figure 9(b), the positive effect of fatigue life increased by shot peening of RFT is not observed for any of UFT tests. The green line represents the same UFT data plotted in Figure 9(a). Nevertheless, in order to verify the effect of shot peening for various treatment pressures of 15, 25, and 35 psi, the effect of surface treatment did not show any clear benefits under the test of ultrasonic fatigue environment, which is quite distinguished from the results of RFT as shown in Figure 8. “Why the SP surface treatment effects do not appear in UFT test” is likely to become an important issue that should be carefully handled before the selection of the UFT testing machine under VHCF environment.
3.8. Fractography
(a) Fracture Surface of RFT, 53 Hz. Figure 10(a) illustrated an example of the fracture surface which shows fatigue crack initiation, growth, and coalescence for 35 psi-SP treated specimen at stress of σ a = 280 MPa and cycle of N f = 2.65 × 10⁶.

(a) Small surface crack initiation sites and shallow multi-fatigue cracks (RFT, σ a = 280 MPa, N f = 2.65 × 10⁶, “after 35 psi-SP”). (b) Small surface crack initiation sites (RFT, σ a = 238 MPa, N f = 2.7 × 10⁶, “before SP”). (c) Fractography of small surface crack initiation site of shot peened (under 25 psi) specimen (UFT, σ a = 125 MPa, N f = 1.63 × 10⁸).
Several initiated minor cracks coalesced and become small major fatigue cracks at the surface. The surface cracks combined with other adjacent small cracks and grow into larger crack as shown as dotted area. The cracking phenomena were commonly observed for “after SP” specimens [14–17].
Figure 10(b) shows fracture surface which demonstrates an initiation and growth of surface crack behavior of “before SP” specimen at stress of σ a = 238 MPa, N f = 2.7 × 10⁶. However, the untreated “before SP” material showed typical fatigue behavior. As shown in Table 4 only few cracks are generated on the surface and cracks grow extensively as the cycle increases.
Fracture pattern and crack growth behavior of A7075-T651 alloy.
(b) Fracture Surface of UFT, 20 kHz. Figure 10(c) shows a fractography of 25 psi-SP treated specimen by UFT at stress of σ a = 125 MPa and cycle of N f = 1.63 × 10⁸.
For most of the fatigue test the fish-eye crack was not observed in the specimens treated by UFT. It is known to be caused by the cracks resulting from the internal inclusion, which is a feature of VHCF fatigue [13, 18, 19]. It was similar to the results of another study related to the UNSM treatment on the aluminum A6061-T6 [3].
The fatigue behavior was clearly classified by the regime of VHCF (very high cycle fatigue) and HCF (high cycle fatigue). For the result of rotary-bending fatigue, the small surface crack generation and its growth were certainly affected by the process of the shot peening. As shown in Table 4, for the “before shot peening,” the small crack easily grows into the major crack and deteriorates the fatigue properties and mainly causes material degradation. For the “after shot peening,” the crack growth into the major crack was hardly found but the number of small surface crack initiation increases as the fatigue cycle increases until the HCF regime. In the VHCF regime, the major cracks are developed by the small cracks. In addition, the ripples of crack propagation are very limited to the small area compared to the “before shot peening.”
On the contrary, for the result of ultrasonic fatigue test, the effect of shot peening was lower than RFT test result. The common behavior was that the small surface crack grows into the major crack as the increase of fatigue cycle. It was glaringly obvious that the dominant fracture behavior for RFT shows the crack propagation to vertical direction of the fatigue specimen. However, the dominant fracture behavior for the UFT shows that crack propagation to diagonal direction which is which is predominantly governed by shear force.
4. Conclusion
The A7075-T651 aluminum alloy was characterized by two fatigue test methods. Shot peening was carried out in order to enhance the surface for the fatigue life increase under rotary-bending fatigue and ultrasonic fatigue.
It was observed that after the surface modification by shot peening the microstructure encounters the severe plastic deformation; thus, the roughness, hardness, residual stress, and cycle to fatigue limit considerably increased.
The fatigue characteristic derived by two testing machines of rotary-bending fatigue testing for the cantilever type and the simple beam type was similar.
The 25 psi of shot peening condition shows the superior fatigue life improvement under rotary-bending fatigue testing among five kinds of the pressure (5 psi, 10 psi, 15 psi, 25 psi, and 35 psi).
The fatigue strength of ultrasonic fatigue test, (UFT, 20 kHz) was relatively lower than that of the rotary-bending fatigue testing, test (RFT, 53 Hz). However, in the 5 × 10⁸ up to the regime of VHCF, both fatigue characteristics became similar. The general mechanical characteristics including hardness and fatigue strength of RFT specimen were improved by the shot peening surface modification; nevertheless, the effects of surface modification were not prominent under ultrasonic fatigue testing machine.
Conflict of Interests
The authors declare that there is no conflict of interests regarding the publication of this paper.
Footnotes
Acknowledgments
This research was supported by the following: the Basic Science Research Program through the National Research Foundation of Korea (NRF) funded by the Ministry of Education, Science and Technology (2012R1A1B6001483), the National Research Council of Science & Technology (NST) through the Creative Allied Project (Development of Safety Measurement Technology for Conversion/Storage/Usage of Hydrogen Energy: 11601009), and the Korea Institute of Energy Research (KIER B4-2441). SEM (Hitachi S-4200) was used at the Korea Basic Science Institute (KBSI, Daegu).