
Abstract
A fatigue model for SAE 4130 steels is developed using a cycle-dependent cohesive zone law. Reduction of fracture energy and degradation of stiffness are considered to describe failure resistance after certain number of cycles. The reduction rate of fracture energy is determined with experimental stress (S)- number of cycles to failure (N) scatter found in the literature. Three-dimensional finite element models containing a cohesive zone are generated with commercial software (ABAQUS). Calculated fatigue lives at different stress ratios are in good agreement with experimental ones. In addition, fatigue behavior of hardened SAE 4130 steels is predicted with that of normalized material.
1. Introduction
SAE 4130 steels have been widely used for various mechanical components including aircraft engine mounts, bicycle frames, clutch and flywheel parts, and roll cages. For the purpose of increasing fracture toughness and hardness, a hardening process is often conducted after a normalizing process. In a hardening process, a normalized sample is heated to 845°C or 870°C followed by water or oil quench. Fracture toughness of SAE 4130 steels was investigated under various heat treatment and quench conditions [1–3]. It was identified that fracture toughness varies according to heating temperature. In addition, tempered steel sheets having lower yield strength showed higher plane stress fracture toughness.
Of practical interest to the mechanical engineer is fatigue behavior as well as fracture toughness of SAE 4130 steels. Fatigue behavior of steels is often evaluated with applied cyclic stress versus number of cycles to failure curves (designated as S-N curves). Typical S-N curves of steels, plotted as linear stress versus log number of cycles, exhibit two stages: a fairly straight slanting portion with a negative slope at low cycles and a straight horizontal line at higher cycles [4]. A number of studies on fatigue behavior of SAE 4130 steels are reported with useful S-N scatter. Soft and hard specimens made of SAE 4130 steels were subjected to cyclic rotating bending, and S-N curves were plotted [5]. Low-cycle and high-cycle fatigue tests for SAE 4130 steels normalized and hardened were conducted with consideration of range from 2 to 104 cycles [6] and of range from 104 to 108 cycles [7, 8]. Uniaxial tensile loading was applied to notched and unnotched specimens, and S-N plots were obtained at various stress ratios and stress concentration factors.
In spite of numerous experimental fatigue data, little is reported about the simulation of fatigue behavior of SAE 4130 steels. Several methods including fracture mechanics and continuum damage mechanics are being considered to describe fracture and fatigue behavior of metallic materials. Specially, a method using a cohesive zone law has been successfully used for describing interfacial fracture or low-cycle fatigue, since a cohesive model was proposed for concrete and cementitious composites [9, 10]. A cohesive fatigue model was proposed for crack propagation of a polymer [11] and a single crystal [12]. A typical bilinear cohesive law was combined with an evolution law related to cohesive stiffness, crack opening displacement rate, and number of cycles. Exponential cohesive behavior was used for energy dissipation.
A conventional cohesive zone law was implemented in finite element framework. In implicit finite element analysis, computation time is greatly dependent on total number of elements and total number of steps corresponding to a fatigue cycle. For this reason, a conventional cohesive zone law is ineffective for simulating high-cycle fatigue (e.g., 107 fatigue cycles). A few strategies have been taken into account for high-cycle fatigue modelling [13–15]. For a degradation process involving high-cycle fatigue, a cycle jump strategy was considered. In this strategy, fatigue damage variables were calculated after certain number of cycles with a quasi-static constitutive equation [13]. The extraction strategy of strain energy release rate from a cohesive zone was used for describing crack propagation under cyclic loading [14]. In the explicit finite element analysis, a fatigue damage model was developed using Paris-type crack growth law. In this model, the strain energy of a cohesive zone was released during cyclic loading without the degradation of material stiffness. For strain energy release, total displacement at failure after crack initiation was reduced in a bilinear cohesive zone law. A cycle jump strategy using the property of experimental S-N curves was developed for Al7050-T7451 [15]. A bilinear, time-dependent cohesive zone law was implemented in a three-dimensional finite element model. The stiffness degradation and reduction of fracture energy were applied with respect to number of cycles to failure. It was demonstrated that a calculated S-N curve was close to the one measured by fully reversed bending fatigue tests. Stress ratio is an experimental parameter affecting fatigue life. The effect of stress ratio on crack propagation and fatigue life for aluminium alloys was studied [16]. However, S-N curves at different stress ratios have not been predicted for SAE 4130 steels having different fatigue behavior from aluminium alloys.
In this study, a fatigue method for SAE 4130 steels is described using a cycle-dependent cohesive zone law; a cycle jump strategy using the property of experimental S-N scatter is taken into account. Experimental S-N scatter is statistically analyzed and standard error bands are plotted. S-N curves at different stress ratios are then calculated for normalized SAE 4130 steels. S-N curves calculated are directly compared with experimental ones found in the literature.
2. Fatigue Model for Low Alloy Steels
It was observed that the dynamic fracture toughness (KId) of steels decreases as the number of fatigue cycles increases [17, 18]. For a model 1 crack, fracture energy (G c ) and a critical applied stress (σ c ) are related by

where E is the modulus of elasticity, ν is Poisson's ratio, α is the ratio of the dynamic fracture toughness (KId) to the plane-strain fracture toughness (KIC) at a given loading velocity [19, 20], and a is preexisting crack size.
At different applied stress levels, the relation between the fracture energy values is

where G N c is fracture energy after the Nth fatigue cycle, G1 c is fracture energy for the initial cycle, σ1 is cyclic stress magnitude leading to failure after the initial cycle, and σ N is applied cyclic stress after the Nth fatigue cycle. The stress (σ N ) can be expressed as a function of number of cycles by fitting S-N scatter with an approximate mathematical form.
The typical S-N curve of SAE 4130 steels exhibits two distinct stages. In the primary stage, applied stress magnitude is decreased with increasing number of cycles to failure. In the secondary stage, applied stress magnitude maintains as constant. The relation between the stress and the number of cycles to failure (N f ) for SAE 4130 steels in each stage is given as

where c1, c2, and b are constants. N t is about 106 cycles for SAE 4130 steel.
Therefore, fracture energy of a material at the Nth cycle is expressed as
where β is the ratio of α N 2 to α12.
A cohesive zone law with the fracture energy allows characterizing the progressive degradation of material stiffness [21]. Instead of a cycle-by-cycle analysis, it is possible to simulate high-cycle fatigue by applying fracture energy of a fatigued material to the cohesive zone. In this model, a single fatigue cycle was considered by reducing stiffness and fracture energy according to (4) (so-called cycle jump strategy).
Figure 1 illustrates traction-separation response in a bilinear cohesive zone law with cycle jump strategy for high-cycle fatigue. In the proposed method, it was assumed that stiffness (k) and fracture energy of a cohesive zone are reduced with respect to number of cycles. For reducing fracture energy, the maximum nominal stress (Tmax) was decreased along a postyield softening line. In this study, linear softening was assumed after crack initiation. Meanwhile, the maximum value of a displacement (δ N max) after the Nth cycle was determined with maximum values of normal and shear displacements (δ L max and δ S max) attained during the loading history. The effective displacement at crack initiation (δ N o) was changed as T N max was reduced along postyield softening. Additionally, it was assumed that the total displacement to failure was maintained as constant. Thus, the effective displacement at failure relative to the displacement at crack initiation (i.e., δ f -δ N o) was reduced with respect to number of cycles.

Traction (T)- separation (δ) response of a bilinear cohesive zone law using cycle jump strategy. Reduction rates of fracture energy and of stiffness are determined on experimental S-N scatter.
3. Implicit Finite Element Simulation
A cohesive zone law is implemented in implicit finite element simulation. Commercial finite element software (ABAQUS 6.10) was used for generating a model and simulating high-cycle fatigue of SAE 4130 steel. In this study, SAE 4130 steel sheets found in the literature [6] were used as shown in Figure 2(a). A dogbone-type specimen (Figure 2(b)) was also taken into account for investigating the influence of specimen geometry.

Geometries and dimensions of specimens; the left hourglass-type specimen was found in the literature [6], and the right dogbone-type one was generated for this study. (All dimensions are in mm.).
Three-dimensional finite element models were generated as shown in Figure 3. It was assumed that intrinsic microcracks exist in the models. For reducing total number of finite elements, clamping parts of a specimen were not modelled. Tetrahedral elements were used for meshing a noncohesive part of a model. Particularly, a region close to a cohesive zone was meshed sufficiently finely for guaranteeing appropriate degree of resolution of local stress concentration effects; each global element size was 1 mm, and local element size close to the cohesive zone was 0.1 mm. For reproducing a crack, a cohesive zone was inserted in the middle of a specimen. Hexagonal elements were selected for meshing a cohesive zone; each cohesive element was 0.2 mm × 0.1 mm × 0.1 mm as shown in Figure 3. The left side of a specimen was fixed in all directions, whereas the right side was permitted to movement in the longitudinal direction.

Three-dimensional finite element models with a cohesive zone.
Table 1 shows the mechanical property of normalized SAE 4130 steels. In this study, it was assumed that elastic modulus of noncohesive parts was maintained as constant during simulation. Table 2 shows the mechanical property of a cohesive zone. The maximum value of a nominal stress was defined as imposed stress magnitude leading to complete failure of a specimen after the initial cycle. The stress magnitude determined with a fatigue test was used [6]. The total displacement to failure was calculated with fracture energy and stiffness; stiffness in normal and shear directions was determined as elastic modulus divided by the initial thickness of a cohesive zone.
Mechanical properties of SAE 4130 steel normalized.

Initial mechanical properties of a cohesive zone for the bilinear cohesive zone law.
Each simulation consists of a single loading-unloading cycle. A loading step was employed by inducing a predescribed displacement. After a loading-unloading cycle, the damage of a cohesive element is evaluated with the damage variable (D) proposed by Camanho and Davila [21]. If the damage variable of a cohesive element remains zero after a cycle, the element is nondamaged. Higher loading magnitude is then applied. When the damage variable comes to unity, the element is fully damaged and removed from a model. The removal of the elements was considered as cracking. When a cohesive zone was completely broken, the simulation was terminated, and then induced stress magnitude was recorded.
Convergence was often arisen from softening and failure of a cohesive element in the implicit analysis. For avoiding the convergence, viscous stabilization (dissipated energy fraction) was considered; in all calculations, dissipated energy fraction used for stabilization was lower than 0.02 percent.
4. Results and Discussion
The plot of stress (S) against number of cycles (N) is useful for evaluating fatigue behavior of material. S-N plots directly show the endurance lives of materials subjected to cyclic loading. Numerous S-N scatters for SAE 4130 steels are available in the literature. They can be directly used for determining fatigue limit and fatigue life of the steels. Figure 4 shows maximum stress (Smax) versus number of cycles to failure (N
f
) scatter of SAE 4130 steels exhibited in the literature [6, 22–24]. The scatter was obtained by conducting axial-load fatigue tests with unnotched specimens at stress ratio of −1. A given frequency in [6] was 30 Hz. Dimension and geometry of a specimen are the same as those shown in Figure 2(a). In fatigue testing of [22], a specimen was 1.91 mm thick and 38.1 mm wide. In [23], a specimen was smooth and cylindrical with a gauge length of 10 mm and a gauge diameter of 6 mm. Constant strain rate of 0.004/s was imposed to the specimen. The figure shows that there exist two stages in Smax-N
f
scatter. In the primary stage, imposed maximum stress is decreased with respect to number of cycles to failure. In the secondary stage, the maximum stress maintains as a constant. Transition between two stages is found at the 106th cycle. For the purpose of determining a fracture energy evolution for a cohesive zone, the mean values of fatigue lives (
Stress-life scatter of SAE 4130 steels at stress ratio of −1. –: the mean line (
Then, fracture energy evolution with respect to number of cycles was calculated with (4). Figure 5 shows the fracture energy evolution of SAE 4130 steels normalized. It presents fracture energy with respect to number of cycles. The calculated fracture energy was defined as the material property of a cohesive zone.

Fracture energy evolution of SAE 4130 steel normalized.
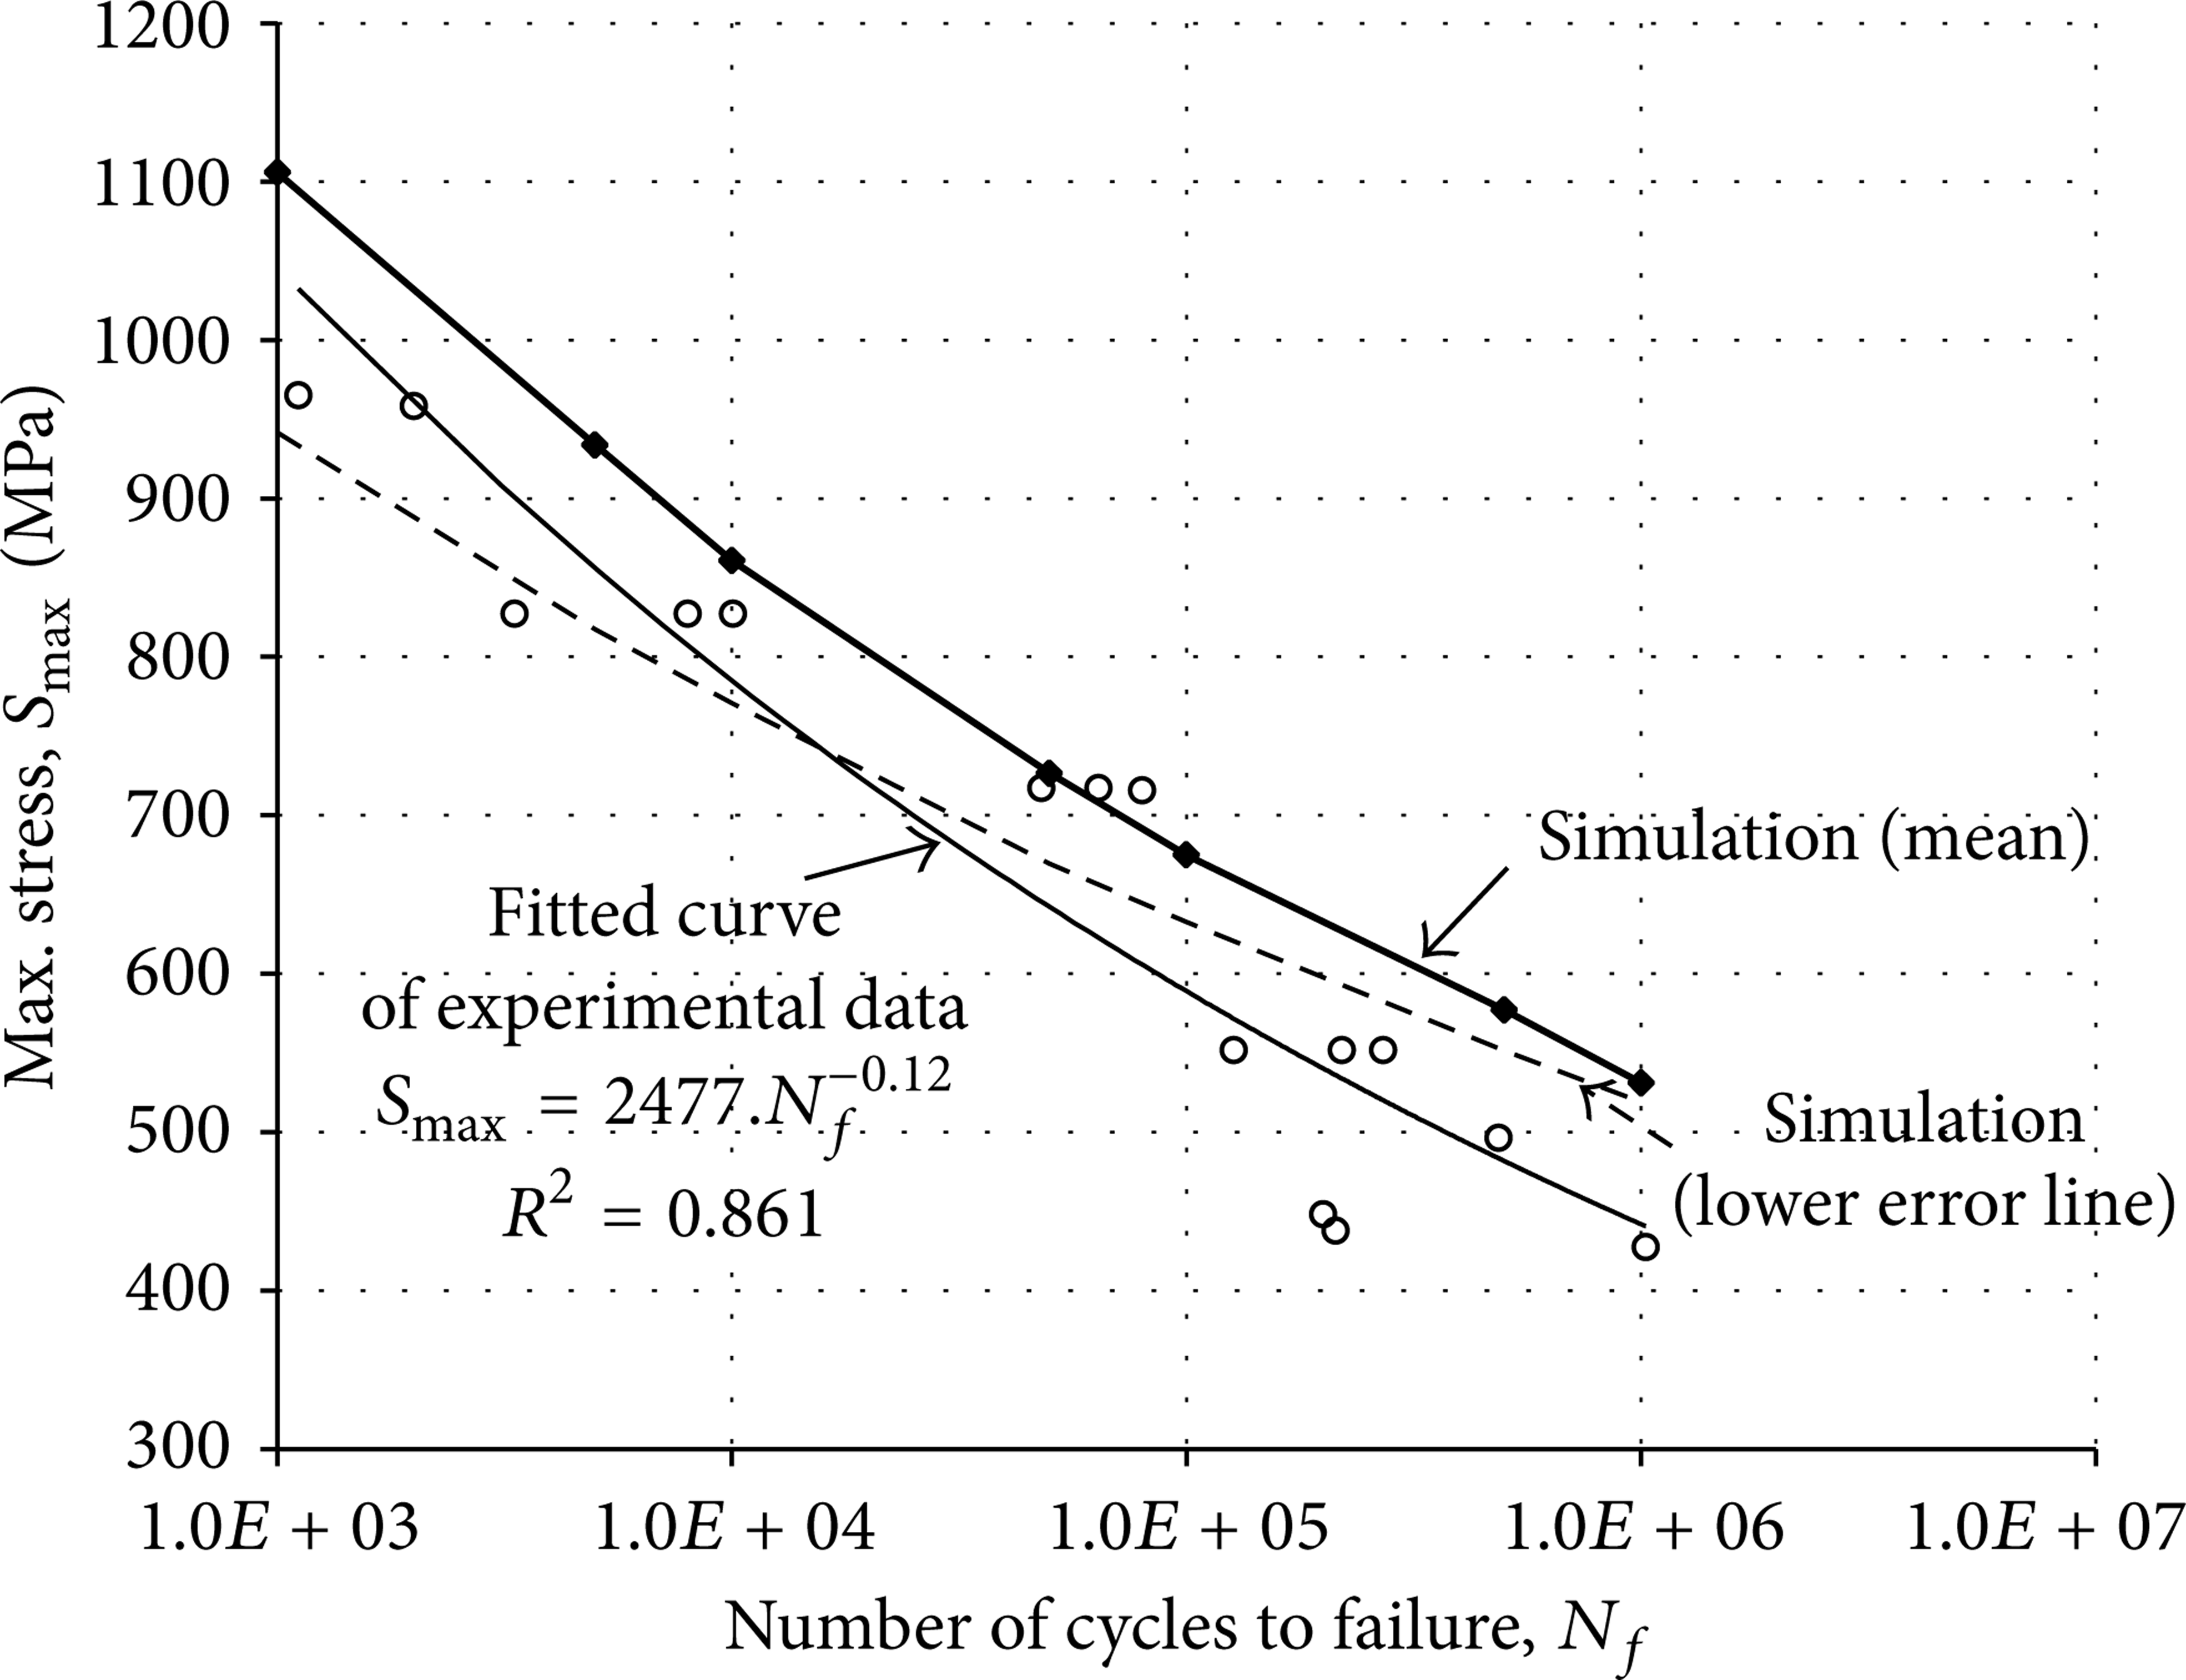
Finite element simulation was performed for determining the stress magnitude that leads to complete failure of a cohesive zone. In the simulation, tensile stress magnitude linearly increased from zero to a predefined maximum value. Considering that a cohesive element is not damaged under compression, one can assume that a predescribed loading corresponds to stress ratio of −1. Calculated S-N curves are shown in Figure 6, along with fitted curves of experimental data presented in Figure 5. Despite the slight difference between results, a close agreement is obtained, ensuring that the cycle jump strategy based on experimental S-N scatter allows reproducing the S-N curve of SAE 4130 steels.

Comparison between simulation and experimental data at the stress ratio of −1.
Following the simulation at the stress ratio of −1, other stress ratios (0.01, −0.3, and −0.6) were considered. Stress ratio (r) is defined as minimum stress to maximum stress. Maximum stress (Smax) and stress amplitude (S a ) are related by

At the stress ratio of −1, stress amplitude is equal to maximum stress. Thus, Figure 5 corresponds to the stress amplitude (S a )-number of cycles to failure (N f ) curve. By using Figure 6, at stress ratios of −0.6, −0.3, and 0.01, maximum stress (Smax)-number of cycles to failure (N f ) curves can be obtained as Figure 7.
Direct comparison between simulation and experimental data at different stress ratios.
In Figure 7, solid and dashed lines denote calculated S-N curves, while circle markers are experimental data measured at different stress ratios (found in [6]). At the stress ratio of −0.6, excepting two points, experimental data lie between standard error lines. At the stress ratio of −0.3, all experimental data lie between the standard error lines. Meanwhile, at the stress ratio of 0.01, experimental data are placed below the lower error line. Variance of experimental data is found to be about 100 MPa in stress magnitude. Nevertheless, there is difference between two results. S-N curves of SAE 4130 steels above zero stress ratio are not sufficiently predicted with a proposed method. One of possible reasons is that damage due to compressive cyclic loading was not considered in the proposed cohesive zone law.
In this study, unnotched hourglass-type specimens were used for leading to stress concentration in the middle of a specimen. For the purpose of investigating the influence of specimen geometry, a dogbone-type specimen was simulated under the same condition. Figure 8 shows Smax-N f curves of a dogbone-type specimen and of a hourglass-type specimen. Results show that there is only 0.8 percent difference between two geometry types at the 104th cycle.
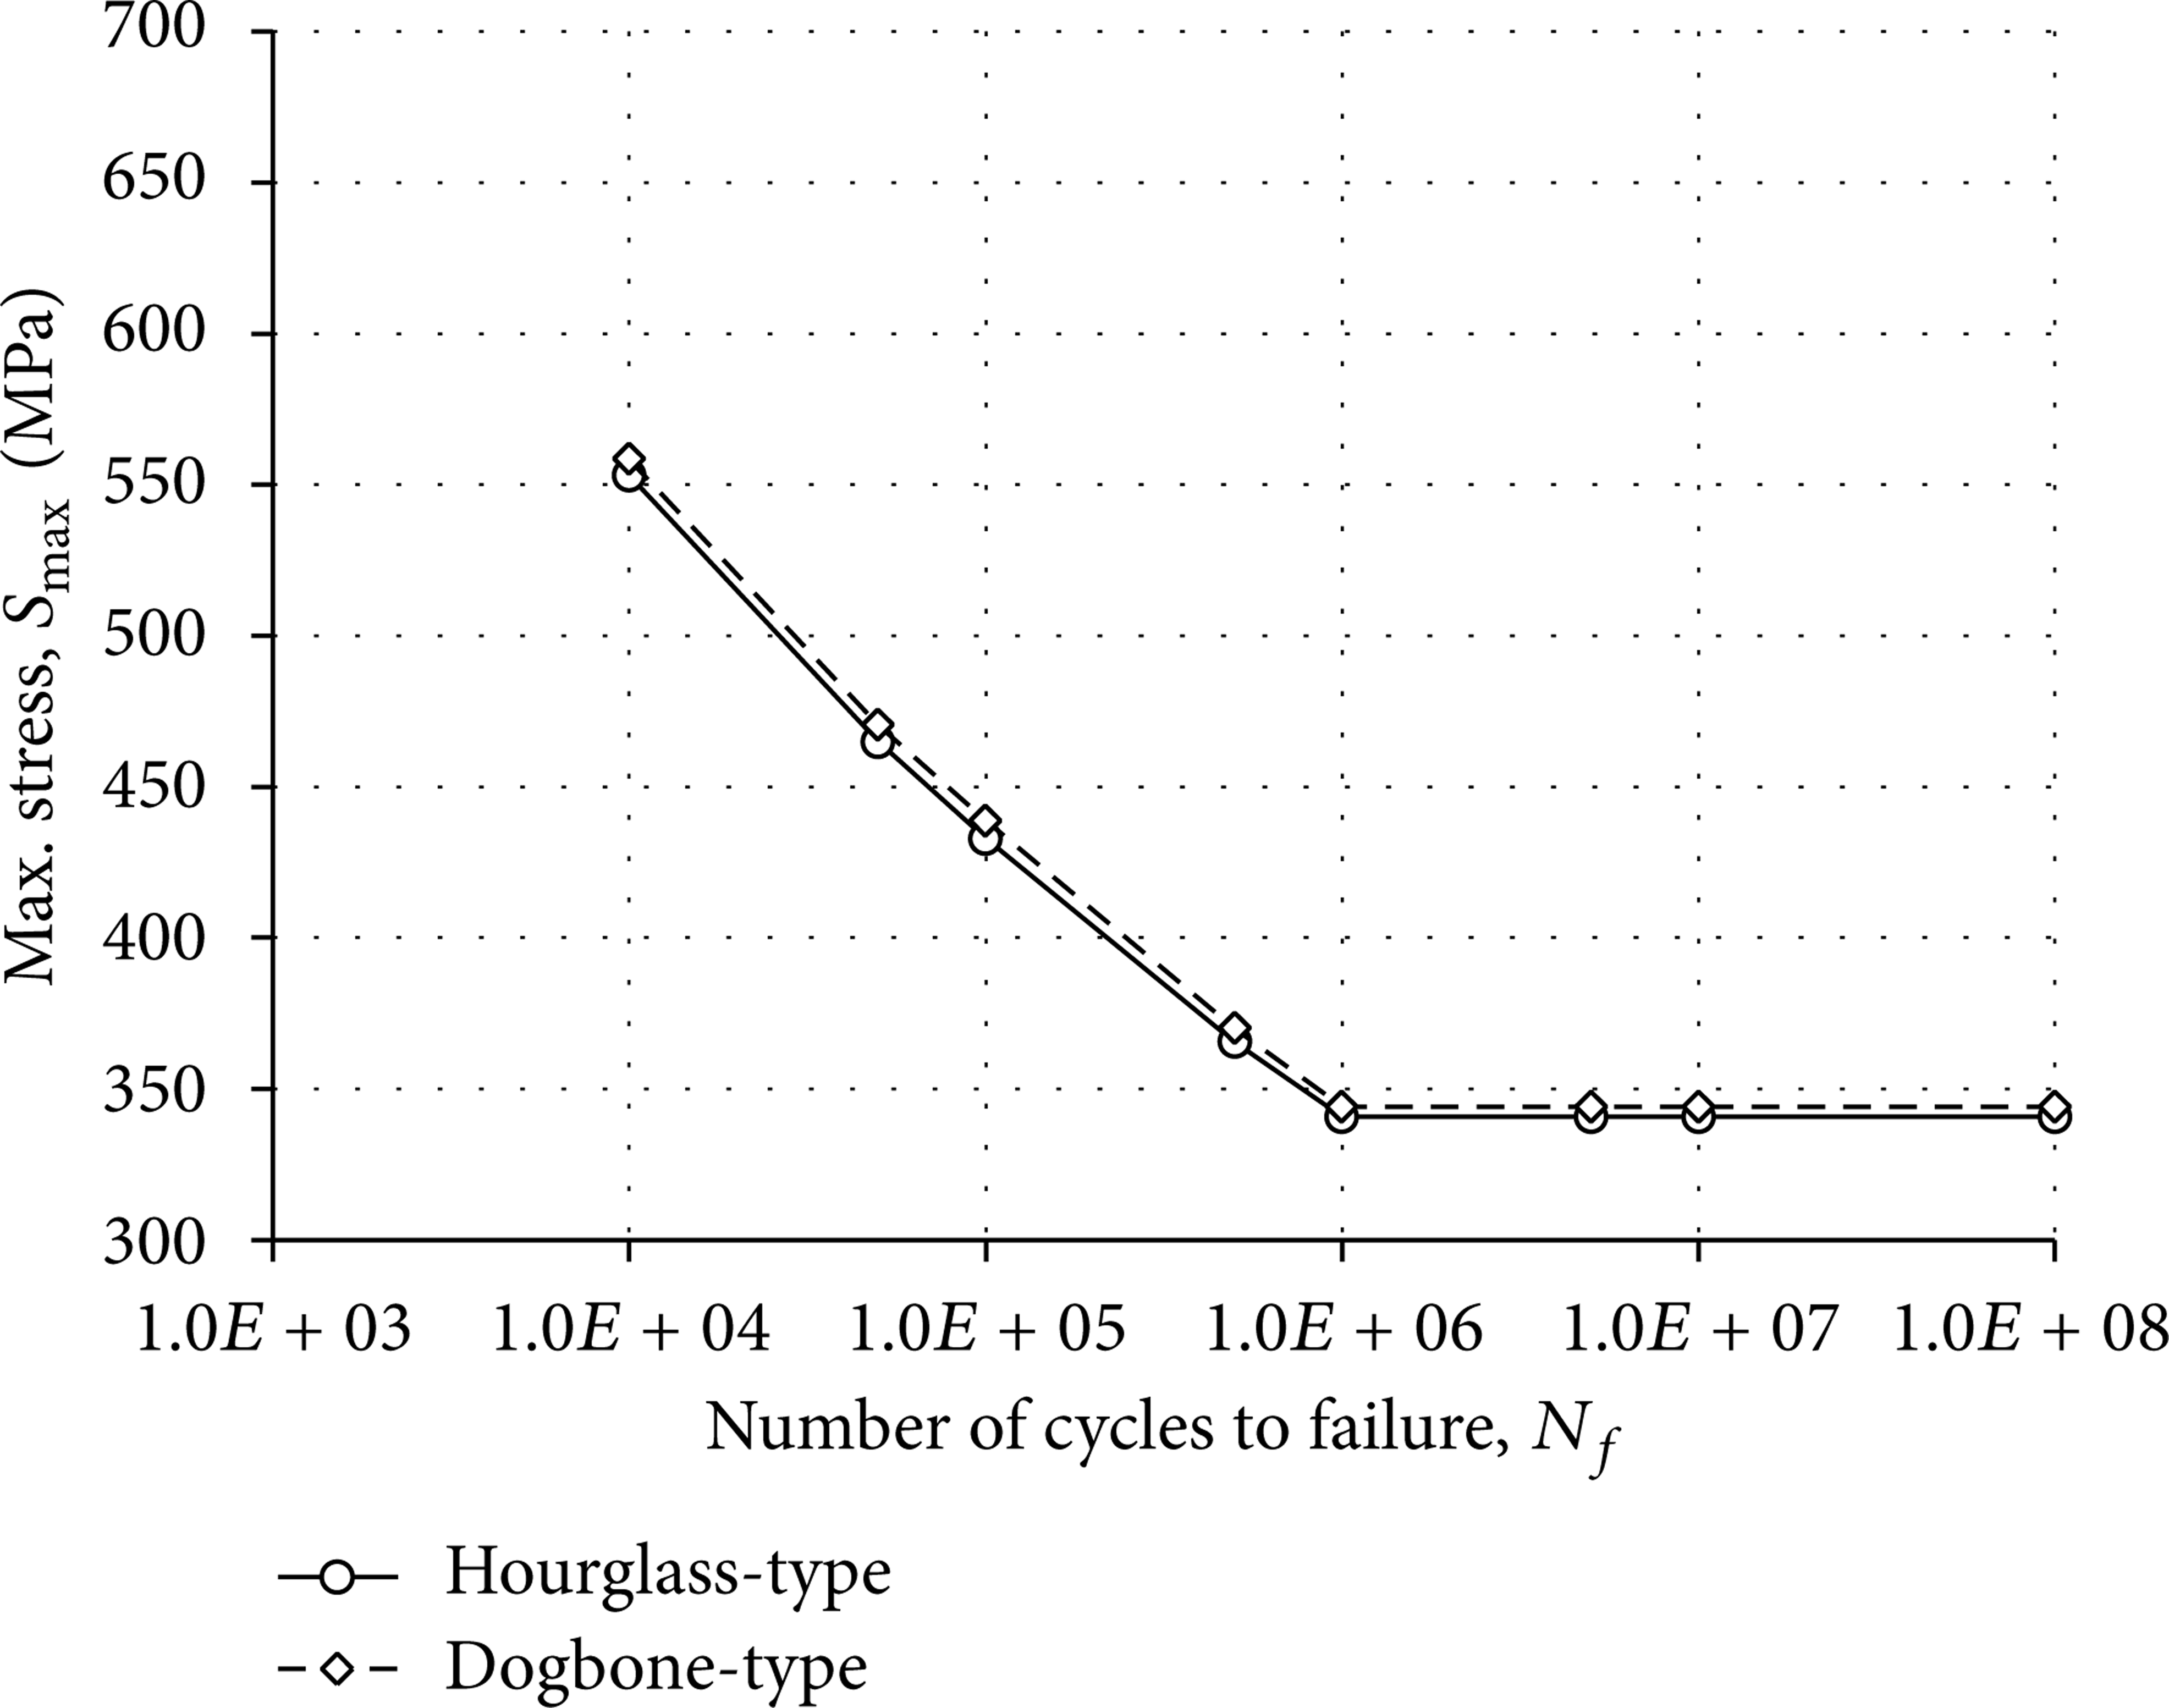
Influence of specimen geometry.
In the simulation, normalized SAE 4130 steels were used. However, in many cases, hardening process is carried out for increasing hardness, ultimate tensile strength, and fracture toughness. Attempt was employed for predicting the S-N curve of hardened SAE 4130 steels by using fatigue behavior of normalized 4130 steel. For hardening the specimen normalized, the specimen was heated to 860°C and quenched in warm oil. Then, the specimen was clamped to a heavy bar and drawn at 450°C [6]. Ultimate tensile strength and fracture toughness were increased to 1227 MPa and 170.9 MPa·m0.5, respectively.T1max of 1227 MPa and fracture toughness of 170.9 MPa·m0.5 were used for calculating an initial value of fracture energy. It was assumed that reduction rate of fracture energy was similar to that of SAE 4130 steel normalized.
Figure 9 shows the calculated Smax-N f curve for hardened SAE 4130 steels. In the figure, circle markers denote experimental data [6] and a smooth line is a fitted curve. The difference between the calculated S-N curve and the experimental one is found to be 19.3 percent at the 106th cycle. A possible reason includes the variance of fracture toughness of a specimen after a hardening process. Fracture toughness of 170.9 MPa·m0.5 was an approximated value on the basis of ultimate tensile strength by referring to [2]. Thus, further work should include investigation on the influence of heat treatment and prediction of S-N curves of heat-treated samples. Power law or exponential form for postyielding response will be taken into account.
Prediction of Smax-N f curve of SAE 4130 steels hardened. Circle markers are experimental data of SAE 4130 steel hardened.
Cyclic hardening or softening occurs under strain-controlled testing conditions. Change of plastic strain range during cyclic hardening or softening is not described with a proposed model. The exclusion of cyclic hardening or softening effect might bring about less accurate stress-strain behavior before fracture. For accurate description of stress-strain behaviour, cyclic strain hardening needs to be included in the proposed method.
It might be possible to predict S-N curves under bending, fretting, creep, or impact fatigue loading by this proposed method. In addition, fatigue simulation under various-amplitude loading is of practical interest to the mechanical engineer. Thus, further development will include cumulative damage theories using Miner's and Kramer's equations.
The region near the crack tip of a sample deforms plastically, suggesting that nonlinear deformation could occur during a postyielding process. A nonlinear postyielding process in a cohesive zone needs to be considered. In addition, fatigue crack growth is significantly affected by deformation history. The effect of deformation history on fatigue crack growth needs to be clearly understood and considered in further investigation.
In this method, fracture energy after the Nth cycle was uniformly distributed to a cohesive zone. Actually, fatigue damage is localized near the crack tip of a specimen. For modeling localized fatigue damage, it may be possible to define nonuniformly distributed fracture energy in a cohesive zone after the Nth cycle.
5. Conclusions
A fatigue model for SAE 4130 steels was developed using a cycle-dependent cohesive zone law. Stiffness and fracture energy of a cohesive zone were reduced with respect to number of cycles. A three-dimensional finite element model was generated for identifying validation of the fatigue model.
Various stress ratios were considered and S-N curves were predicted. Calculated S-N curves at the stress ratios of −1.0, −0.6, and −0.3 were close to experimental ones; that is, experimental S-N data lie between two standard error lines. Meanwhile, at the stress ratio of 0.01, experimental S-N data were placed below the lower standard error line. Possible reason is that damage due to compressive cyclic loading was not considered in the proposed method. Thus, further work will include prediction of S-N curves above zero stress ratios.
Influence of specimen geometry under cyclic loading conditions was identified with unnotched hourglass-type and dogbone-type specimens. It was identified that no significant difference between two geometry types exists on S-N curves.
Prediction of the S-N curve of hardened SAE 4130 steels was attempted with the fracture energy evolution used for normalized steels. It was identified that it is possible to predict fatigue behaviour of hardened steels with the proposed method.
Further development will be focused on the prediction of S-N curves of other materials including aluminium alloys. For accurate description of fatigue behaviour, cyclic strain hardening needs to be included in the proposed method. In this study, only uniaxial tensile loading was applied to a model. Thus, under cyclic bending, fretting, or impact conditions, fatigue behaviour will be predicted with the proposed method.
Footnotes
Nomenclature
Conflict of Interests
The authors declare that there is no conflict of interests regarding the publication of this paper.
Acknowledgment
This work was supported by 2013 Korea Aerospace University Faculty Research Grant.