
Abstract
Oscillating water column (OWC) wave energy converters, which are capable of extracting power from ocean waves, have been constructed and adopted worldwide. An essential component of an OWC system is the impulse turbine, which plays a significant role in converting the energy of bidirectional airflow into mechanical shaft power. To optimize the starting characteristics and conversion efficiencies of impulse turbines, a considerable number of studies have been conducted to improve their geometric construction. This paper verifies a numerical model established in FLUENT 14.5 with preexisting experimental data and subsequently explores the effects of the solidity ratio on turbine performance. The results show that the coherence between computed and measured data is satisfactory. In addition, they reveal that a solidity ratio of 0.63 is suitable and is recommended for future research.
1. Introduction
Among various marine energy conversion systems, the oscillating water column (OWC) wave energy converter has been proposed and utilized extensively throughout the world, especially in nearshore areas, such as 500 kW LIMPET in UK, 500 kW PICO in Portugal, and 2 × 250 kW Yongsoo in South Korea. As illustrated in Figure 1, an OWC system has an air chamber with a mouth at the bottom of the front wall to take in incident waves. The reciprocating air flows are driven by the oscillating water column in the air chamber, which are generated by the incident waves. Self-rectifying air turbines can rotate in one direction to drive the electricity generator under the bidirectional air flows, which are expected to improve the energy converting efficiency of OWC systems.

Schematic layout of oscillating water column (OWC) system.
Because of large wave heights and long wave periods, the wave energy flux density in Europe is good and suitable for the Wells turbine, which has high peak efficiency and narrow operating range around the small flow coefficients. On the other hand, the average wave heights are relatively small within shorter wave period in the Asian area especially the western Pacific. It means that the air turbine should operate in the lower flow coefficient ranges. Comparing to the Wells turbine, the advantages of the impulse turbine recently proposed include wider range of operating flow rates, better self-starting performance, and lower working noise. These characteristics indicate that the impulse turbine is more suitable for the wave conditions around the western Pacific. This type of turbine has now been employed in the Indian and Korean OWC pilot plants.
Since the impulse turbine is becoming a research and industrial hotspot for the energy conversion of OWC facilities, it has been studied in numerous reports which have employed both the experimental approach and numerical analysis. In a series of studies, Thakker et al. [1–3] established three-dimensional (3D) numerical turbine models to explore the influence of tip clearance, guide vane losses, and guide vane shape, respectively, on the performance of an impulse turbine and attained optimized geometric parameters. As discussed elsewhere [4, 5], Hyun et al. applied the method of computational fluid dynamic (CFD) analysis to study the impulse turbine for the 500 kW Yongsoo OWC plant. Takao and Setoguchi [6] provided an overview of current research results on air turbines and made recommendations for basic geometric parameters. Liu et al. [7, 8], by focusing on numerical simulations of an optimized impulse turbine under steady flow conditions, established a complete system and a series of procedures to achieve higher turbine efficiency.
It has been well known that the rotor and guide vane solidity has significant effects on the aerodynamics and operating performance of the air turbines. An increasing number of articles and reports have focused on the effects of blade and guide vane solidity of Wells and impulse turbines. As discussed elsewhere [9], Thakker and Abdulhadi summarized the effects of blade profile and rotor solidity on the performance of a Wells turbine under unsteady unidirectional flow conditions. Pereiras et al. [10] analyzed the guide vane solidity of a radial impulse turbine to determine the optimum value both experimentally and numerically. Okuhara et al. [11] experimentally investigated the characteristics of guide vane solidity of the unidirectional impulse turbine using a quasisteady analysis of experimental results.
As the above review shows, the solidities of the guide vane and rotor blade are reasonably speculated to have evident effects on turbine efficiency. However, few studies have been carried out on the solidity of the impulse turbine with fixed guide vanes, especially the change of the blade and guide vane numbers and related solidity variation. This paper aims to benchmark the numerical simulation results against the corresponding experimental data and to explore the effects of both blade and guide vane numbers, defined as the solidity ratio, on the operating characteristics of the impulse turbine. FLUENT and GAMBIT are employed to establish the numerical model based on the MRF and mixing plane model. The computational results are determined by means of dimensionless efficiency coefficients within distinct contour figures of velocity and pressure distributions.
2. Impulse Turbine with Fixed Guide Vanes
Figure 2 illustrates a 3D sketch and an outline of the impulse turbine used in this paper. The impulse turbine is composed of rotor blades and two rows of fixed guide vanes symmetrically installed on both sides of the rotor. The rotor blade, which has an “elliptic profile,” consists of a circular arc on the pressure side and a partial elliptic arc on the suction side. The “plate type” guide vane consists of a circular arc and a linked straight line to guide the airflow through the rotor. The fundamental geometry and profile parameters of the impulse turbine are based on those suggested by Setoguchi et al. [12].

3D sketch and profiles of impulse turbine.
The solidity ratio Ω is simply defined as the ratio of the number of guide vanes to that of rotor blades, namely, g n /b n , which can directly demonstrate the width variation of the flow passage determined by the two numbers. The solidity ratio has a direct influence on the air flow in the flow path and pressure distribution on the blade and guide vanes. Consequently, the operating performance of the impulse turbine is indirectly affected. Therefore, exploring the effects of the solidity ratio on turbine performance with the aim of obtaining an optimized value is of great significance. The detailed specifications of the impulse turbine are listed in Table 1.
Specification of the impulse turbine.

According to Setoguchi's suggestion, the performance of the impulse turbine in a steady unidirectional flow is usually evaluated in terms of four-nondimensional parameters: the input coefficient C A , torque coefficient C T , turbine efficiency η, and flow coefficient φ. Their definitions are given as follow:

The meanings of the variables in the above equations are demonstrated in Table 2.
Implications of relevant variables.

3. Numerical Simulation
In the present paper, all calculations are completed with the use of FLUENT software under steady conditions. Based on the finite volume method, the standard k-∊ turbulence model is employed to enclose the Reynolds averaged Navier-Stokes equations. Moreover, the SIMPLEC scheme, which has a faster convergence speed than that of the SIMPLE scheme, is chosen for pressure-velocity coupling and the second order upwind scheme for spatial discretization.
During the numerical simulations, the computational domain is separated into three parts: the upstream guide vane domain, rotor blade domain, and downstream guide vane domain. The guide vane domains are stationary, whereas the rotor blade domain is assumed to rotate at a constant speed. As illustrated in Figure 3, with a view to guarantee the sufficient development of airflow, the whole domain extends for three times the chord length of the guide vane in both the upstream and downstream directions.

Boundary conditions and computational domains of the numerical model.
Meanwhile, the velocity inlet and pressure outlet boundary conditions are applied at the entrance of the upstream guide vane domain and the exit of the downstream guide vane domain, respectively. To avoid the enormous amount of calculation that results from modeling all blades and guide vanes, the airflow through the turbine is assumed to rotate periodically. Hence, rotationally periodic boundaries are employed to create a model with a single blade and two symmetrical guide vanes.
In this paper, the axial incident velocity through the velocity inlet boundary remains unchanged and the revolutions per minute (RPM) of the rotor blade region is gradually varied to produce the range of flow coefficient.
The numbers of guide vanes and rotor blades are both changed to generate a series of solidity ratios. Hence, the flow passages and the periodic angles of the guide vane and rotor blade correspondingly differ, which makes the application of multiple reference frame (MRF) model unreliable. For this reason, the mixing plane (MP) model is adopted to solve the numerical flux exchange at the interface of the guide vane regions and rotor blade region. In MP model, each domain is treated as a steady-state problem and the flow data at the mixing plane interfaces of adjacent regions are averaged circumferentially. Reasonable approximations of the time-averaged flow field are provided for the following iteration [13].
The numerical frames and meshes of the impulse turbine are generated in the preprocess software GAMBIT. The mesh structures of the turbine models are presented in Figure 4. Cooper type meshes are created in the rotor blade domain, whereas the remaining regions are filled with tetrahedral cells. Boundary layer grids are employed around the blade surface to deal with the near wall flows. Moreover, the meshes are refined near the rotor blade and guide vanes so as to guarantee the precision of numerical calculations. The total mesh number is approximately 3.6 × 10⁵. The Reynolds number is correspondingly 0.36 × 10⁵.

Schematic of mesh structures.
4. Results and Discussion
4.1. Experimental Verification
Prior to investigating the effects of the solidity ratio, the numerical model based on CFD software is validated with experimental data provided by Setoguchi et al. [12]. The chosen data are derived from an impulse turbine with a 0.75 hub-to-tip diameter ratio. The comparisons for the input coefficient, torque coefficient, and turbine efficiency are illustrated in Figure 5.

Experimental verification of the numerical model.
Figure 5(a) shows that the numerical and experimental C A values are in good agreement. Only at higher flow coefficients (φ > 2) do the computed values underestimate the measured data to a small degree and show a slight growth trend. The results are due to the smaller pressure difference in computational calculations because of ideal set-up conditions in terms of surface smoothness and material characteristics. The experimental model is subjected to greater frictions and energy reduction, which results in a higher drop in pressure. Figure 5(b) shows that the computed and measured C T values are in perfect agreement. This implies that the normal surface forces of the rotor blade can be predicted precisely through computational calculations.
With regard to η, the difference between the computed and measured results is shown in Figure 5(c). Generally, the numerical and experimental results for η are in close agreement. A small discrepancy exists when φ < 1.25, which is consistent with the two figures above. At this range of flow coefficient, the computed C A is higher than the measured value and hence underpredicts the efficiency.
The above comparisons indicate that the numerical method used in this paper is satisfactorily verified. They also show that the method is highly practicable and has the reasonable capacity for the following investigation.
4.2. Effects of Solidity Ratio
As mentioned hereinbefore, the solidity ratio is varied by changing and coordinating the numbers of guide vanes and rotor blades as shown in Table 1. In the calculations, four turbine models with various solidity ratios (0.56, 0.63, 0.87, and 1.00) are formulated under the guidance of the 3D numerical method discussed above. For each model, the axial flow velocity is fixed. In addition, the flow coefficient ranges from 0.25 to 2.5 because of variation in the constant RPMs of the rotor blades. For Figures 6, 7, and 8, φ = 1.25 is set as the typical flow coefficient.
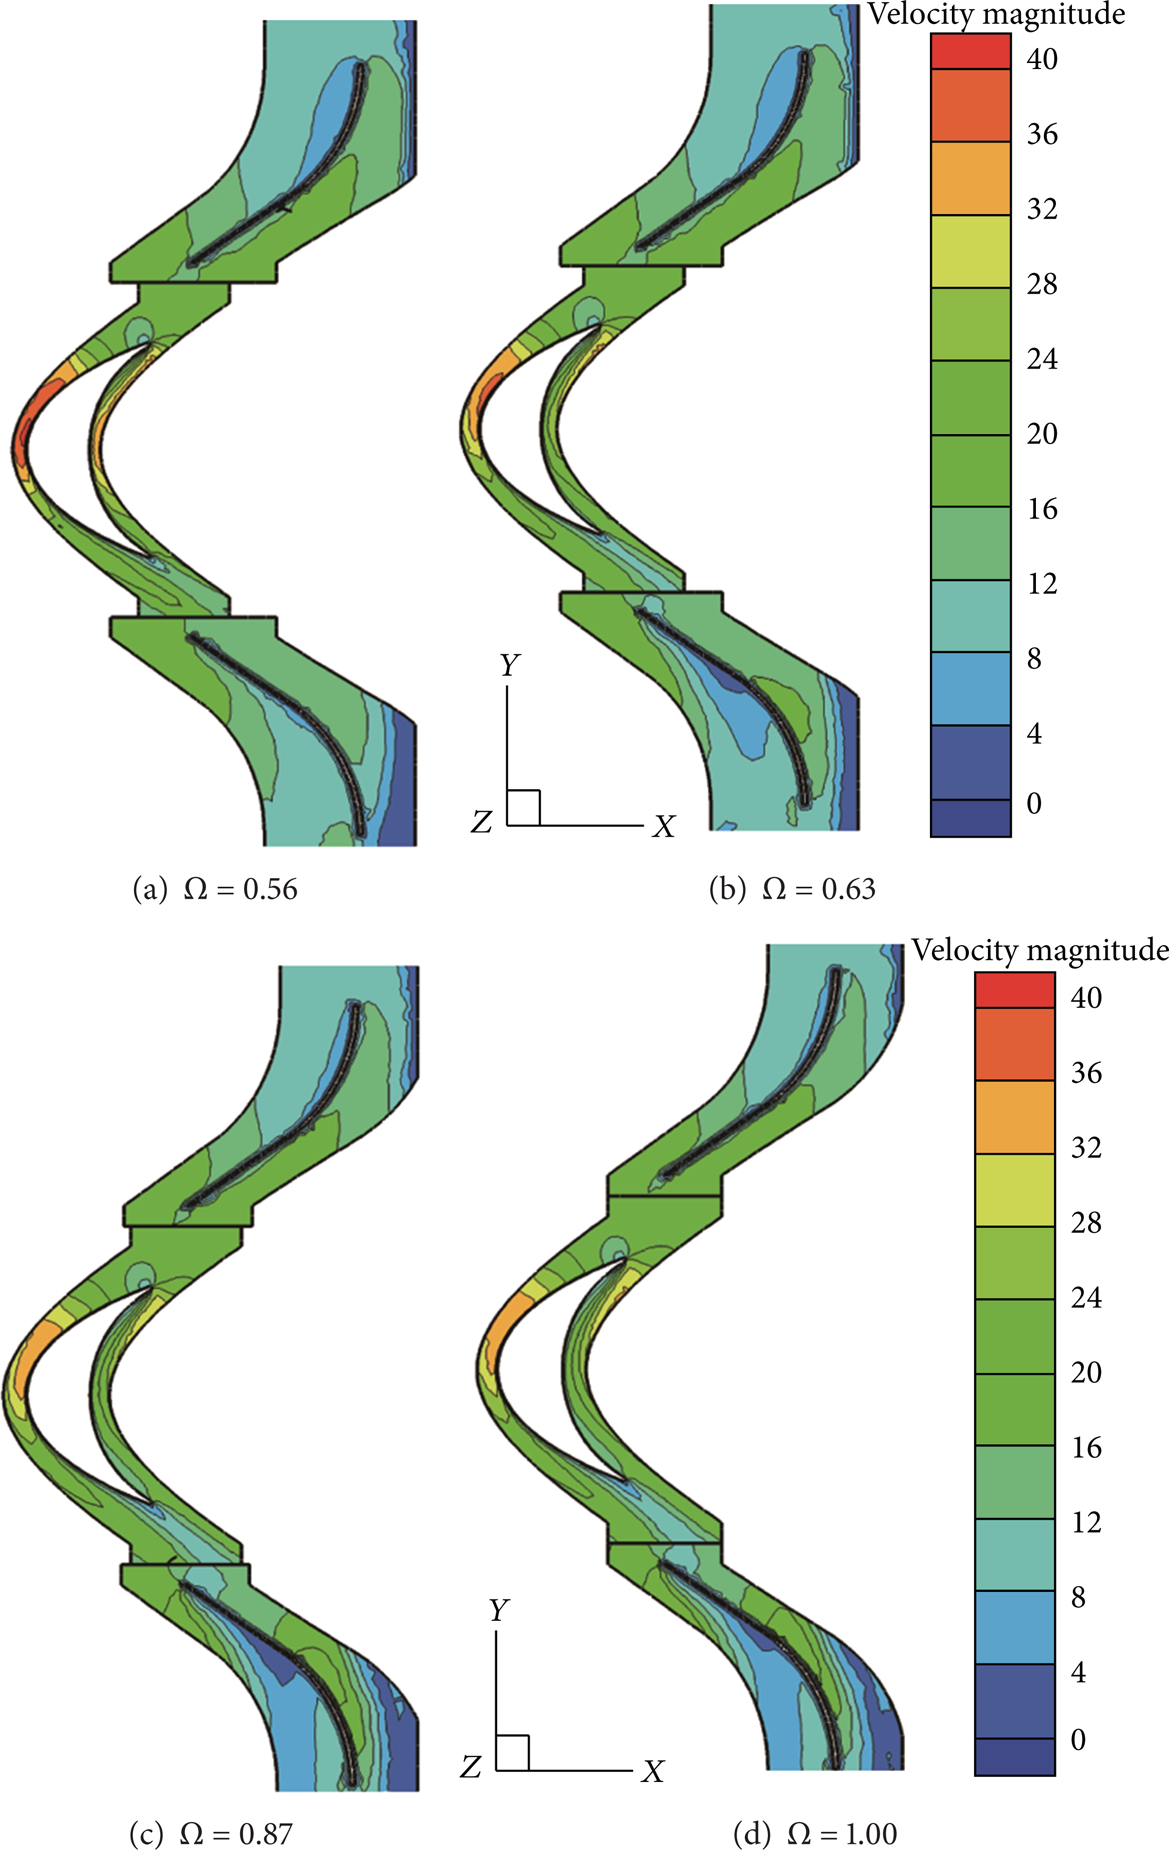
Velocity contour around the rotor blade (Unit: m/s).

Pressure contour on the suction side of the rotor blade (Unit: pascal).

Pressure contour on the pressure side of the rotor blade (Unit: pascal).
Figure 6 depicts the velocity contours around the guide vanes and rotor blade at mid-span surface. Under the lead of the upstream guide vane, the speed of the flow entering the rotor region is higher than the incident axial flow velocity. A high-velocity region appears near the lead edge of the center of the suction side. In addition, the areal ratio of this region to the flow passage near the blade reduces as the solidity ratio increases. After the half of the chord length, a vortex occurs away from the suction surface of the blade. Hence, a low-velocity or stagnating region subsequently emerges in the wake of the trailing portion, whose area grows as the solidity ratio increases. When the airflow reaches the downstream guide vane region, a lower-velocity region is generated on the left of the circular arc.
By comparison, Figures 6(a) and 6(b) show a larger velocity difference between the two sides of the blade and steeper velocity gradients on each side than do Figures 6(c) and 6(d). This indicates that the former models exhibit greater pressure differences and better performance characteristics.
The pressure distributions on the suction side are captured in Figure 7. In each case, the entire surface is divided into two distinct parts: a high-pressure triangular region in the front portion of the blade and a low-pressure region in the trailing area. For the high-pressure region, the pressure reaches the highest pressure region and its areal proportion reaches the largest pressure region when Ω = 0.56, whereas the model with Ω = 0.63 has the lowest and smallest pressure region. In contrast, a small negative pressure zone appears in both Figures 7(a) and 7(b). This may explain why in the second case with Ω = 0.63, a larger torque is produced.
As shown in Figure 8, the pressure distribution on the pressure side of the blade is more homogeneous without extreme conditions as the suction surface. A narrow region of lower pressure can be observed at the top of the blade. At the same time, a higher vertical jujube shaped area on the left increases in proportion to the solidity ratio. Although the peak pressure on the pressure side is lower than that on the suction surface, the torque resulting from the pressure difference is predominantly determined by the integration of forces on both sides.
Although the velocity and pressure contours can provide a graphical description of the operating condition of the impulse turbine, the performance of the turbine must be clarified and visualized on the basis of the four-nondimensional parameters, which are plotted in Figure 9.

Effects of guide number-to-blade number ratio on the turbine performance.
In terms of C A , the four models with different solidity ratios show similar changes in tendency (Figure 9(a)). First, the value ascends steeply as the flow coefficient increases when φ < 1.25. Beyond this range, C A begins to increase slowly and shows a limited reduction when φ > 2, except the model with a solidity ratio of 0.56, in which C A continues to increase moderately. Overall, a larger solidity ratio results in a higher C A , and the gap between Ω = 0.56 and Ω = 0.63 is relatively small.
Figure 9(b) shows that C T continues to increase as φ increases throughout the range of flow coefficients, in correspondence with the solidity ratio. That is, the curve for the model with Ω = 1.00 is situated above that for the other models, whereas the model with Ω = 0.56 shows the lowest torque coefficient. In addition, the curves for all models hardly diverge until φ reaches 1. This indicates that, despite the different solidity ratios, the shaft torque is the same when the turbine rotates at higher angular speeds. The difference between the model with Ω = 0.87 and that with Ω = 1.00 is almost negligible.
Figure 9(c) shows that all trends for the four models are identical and that the turbine efficiencies for the models with Ω = 0.63 and Ω = 0.87 are better than those of models with the solidity ratios of 0.56 and 1.00. In addition, with respect to Ω = 0.87, which is widely adopted for current engineering projects, the model with Ω = 0.63 shows superior performance throughout the operating range of the turbine. Furthermore, the percentage of enhancement is around 4.1%–6.6% at different flow coefficients. That is, the solidity ratio of 0.63 is precisely the optimal value that is numerically confirmed in this paper for the normal working condition of the impulse turbine.
5. Conclusion
In this report, a 3D numerical model was established based on the CFD software FLUENT and GAMBIT in order to investigate the performance of the impulse turbine for OWC wave energy conversion. The multiple reference frame model, mixing plane model, and the standard k-∊ turbulence model were validated with preexisting experimental results and utilized for further design analysis of the solidity ratio.
Contours of velocity and pressure distributions, as well as the dimensionless performance evaluating coefficients, were obtained to analyze the effects of the solidity ratio. Comparative analysis confirmed that the solidity ratio exerts substantial influence on turbine efficiency. For a solidity ratio of 0.63, a large velocity difference was also confirmed to occur on both sides of the blade with a steep gradient on each side. These observations support the fact that the model with Ω = 0.63 exhibits greater pressure differences and better performance than do other models. Because the shaft torque is predominantly determined by the integration of forces on both sides of the blade, 0.63 was numerically discovered to serve as the optimal solidity ratio for the impulse turbine.
This paper contributes to the study of impulse turbines for OWC under steady flow conditions to some degree. The employed numerical model and obtained optimized geometry parameter is of great reference value for future investigation both numerically and experimentally. Henceforth, unknown effects of other parameters such as the rotor degree and asymmetric ratio of the blade will be investigated further to promote the development of the impulse turbine.
Conflict of Interests
The authors declare that there is no conflict of interests regarding the publication of this paper.
Footnotes
Acknowledgments
This work was financially supported by the National Natural Science Foundation of China (Grant nos. 51279190 and 51311140259) and the Shandong Natural Science Funds for Distinguished Young Scholar (Grant no. JQ201314).