
Abstract
It is well known that intercity travel is an important component of travel demand which belongs to short distance corridor travel. The conventional four-step method is no longer suitable for short distance corridor travel demand analysis for the time spent on urban traffic has a great impact on traveler's main mode choice. To solve this problem, the author studied the existing intercity travel demand analysis model, then improved it based on the study, and finally established a combined model of main mode choice and access mode choice. At last, an integrated multilevel nested logit model structure system was built. The model system includes trip generation, destination choice, and mode-route choice based on multinomial logit model, and it achieved linkage and feedback of each part through logsum variable. This model was applied in Shenzhen intercity railway passenger demand forecast in 2010 as a case study. As a result, the forecast results were consistent with the actuality. The model's correctness and feasibility were verified.
1. Introduction
With the development of city agglomerations and regional economic integration, meanwhile with the improvement of urbanization and mechanization on transportation, great change is taking place in the connections between cities in the regional area quantitatively and qualitatively. However, the research of regional travel demand is still insufficient to meet the need of regional comprehensive transportation plan and construction work. There are big differences in travel behaviors between regional and urban trips. With the conventional four-step method, it is difficult to measure the changes in trip generation due to improved travel conditions, because the conventional trip generation methods are not sensitive to changes in the level of service and are not able to capture the effects of such travel time reductions [1]. These models that were taken for urban transportation demand analysis cannot be directly used in intercity demand analysis. New models which met the travel behaviors of regional trips should be developed to analyze and forecast intercity travel demands.
In recent years, with the development of high-speed railways in USA, lots of researchers put their research focus on intercity travel demands, such as the study on passenger flow volume forecasting and income on Bay/California high-speed railway. In this study, models which were developed to plan the intercity travel demands among several major cities crossing 14 main regions provide valuable and supportive quantized evidence for planning and implements [2, 3]. Besides, several cities in USA conducted external trip surveys to obtain the characteristics and laws of internal-external trip, external-internal trip, and external-external trip. External travel model was developed and became a very important part in regional travel model. The model was used to make regional transportation plan, evaluate transportation polices, and predict major transportation programs [4]. In addition, countries like Sweden, Swedish, and South Korea covering national region were developed by national authority departments which conduct transportation planning [5–8]. The models were mainly used to obtain the travel demands among major cities, traffic, and transportation volumes of each transportation means and to collect the characteristics of passenger flow between major cities. To summarize, the range of transportation demand research in western countries is expanding. Regional transportation demand analysis between cities and their satellite cities is becoming of more and more concern.
Research on intercity travel demand in China was respectively rare, whereas it is becoming a hotspot recently due to the rapid development of city agglomerations and regional economic integration. Lu studied the forecasting method for metro line passenger flow volume in intercity and agglomeration region and applied the method in Guang-Fo-Zhu intercity rapid metro line. Xie, He, and Luo conducted the research on intercity split model based on disaggregate model, and they get good results with its application in the projects including passenger volume forecasting for Guangzhou-Shenzhen railway, plan of Beijing-Taiyuan high-speed railway, and plan of Hangzhou external transportation system. Tang and his research team predicted the development direction of urban external travel spatial demand of Longnan city by force model. They found the seven main external travel directions of the city and presented the plan for the development of urban external transportation. By using the disaggregate theories and methods, Wang constructed two passengers' choice behavior models including the passengers' choice behavior model for high-speed trains and the passengers' choice behavior model for transfer modes and nonstop trains. Lei developed urban external travel demand analysis system with multiple structure based on nested logit model.
With the reviews above, we can draw the conclusion that no integrated method for external travel demand forecasting has been made in China due to the lack of research. Under the circumstance of great development which is taking place both in urban regional economics and integration of city and countryside, it has already drawn the attentions of relevant researchers that problem of transportation should be faced and considered in regional dimensions. The development of transportation model should be based on corresponding theory and methodology which are still insufficient in China. Thus, work should be made in this field.
2. Intercity Travel Demand Analysis Model System
Disaggregate model is widely used in travel demand field [10]. It was mainly applied in research of model split in early period. For the advantages which disaggregate model have on empirical statistical analysis of individual and household travel behaviors and on description of choice behaviors and process of individual and household choice, the disaggregate model has gradually been applied in other fields like the forecasting theory of travel demand based on activities [11]. What is more, disaggregate model is used to conduct trip distribution with the model of destination choice. Researches showed that it performs better than conventional gravity model.
In the intercity travel demand analysis model system studies, as Koppelman [12] indicated, the intercity travel-related decisions (trip generation including trip frequency and purpose, destination choice, mode and route choice, and “at destination” decisions such as lodging arrangement and local transport selection) are interrelated and cannot be dealt with separately. These relationships can be reflected in a hierarchical structure of submodels for each subchoice. Particularly, each travel choice in the hierarchy is made conditionally on the higher level choices; meanwhile, the higher level choice is influenced by the expected choices of lower levels. For example, the choice of travel mode choice is made conditionally on the selection of a specific destination city, while the effects of travel impedance should be considered in the destination choice step.
Based on the idea of hierarchy structure, Yao and Morikawa [9] built an integrated nested intercity travel demand model shown in Figure 1 for the consideration of induced demand. In this model, each travel choice is made conditionally on the higher level choices, while the higher level choice is influenced by the expected maximum utility (logsum term) of lower level choices. Finally, induced travel can be estimated through introducing the accessibility measure into the trip generation model.
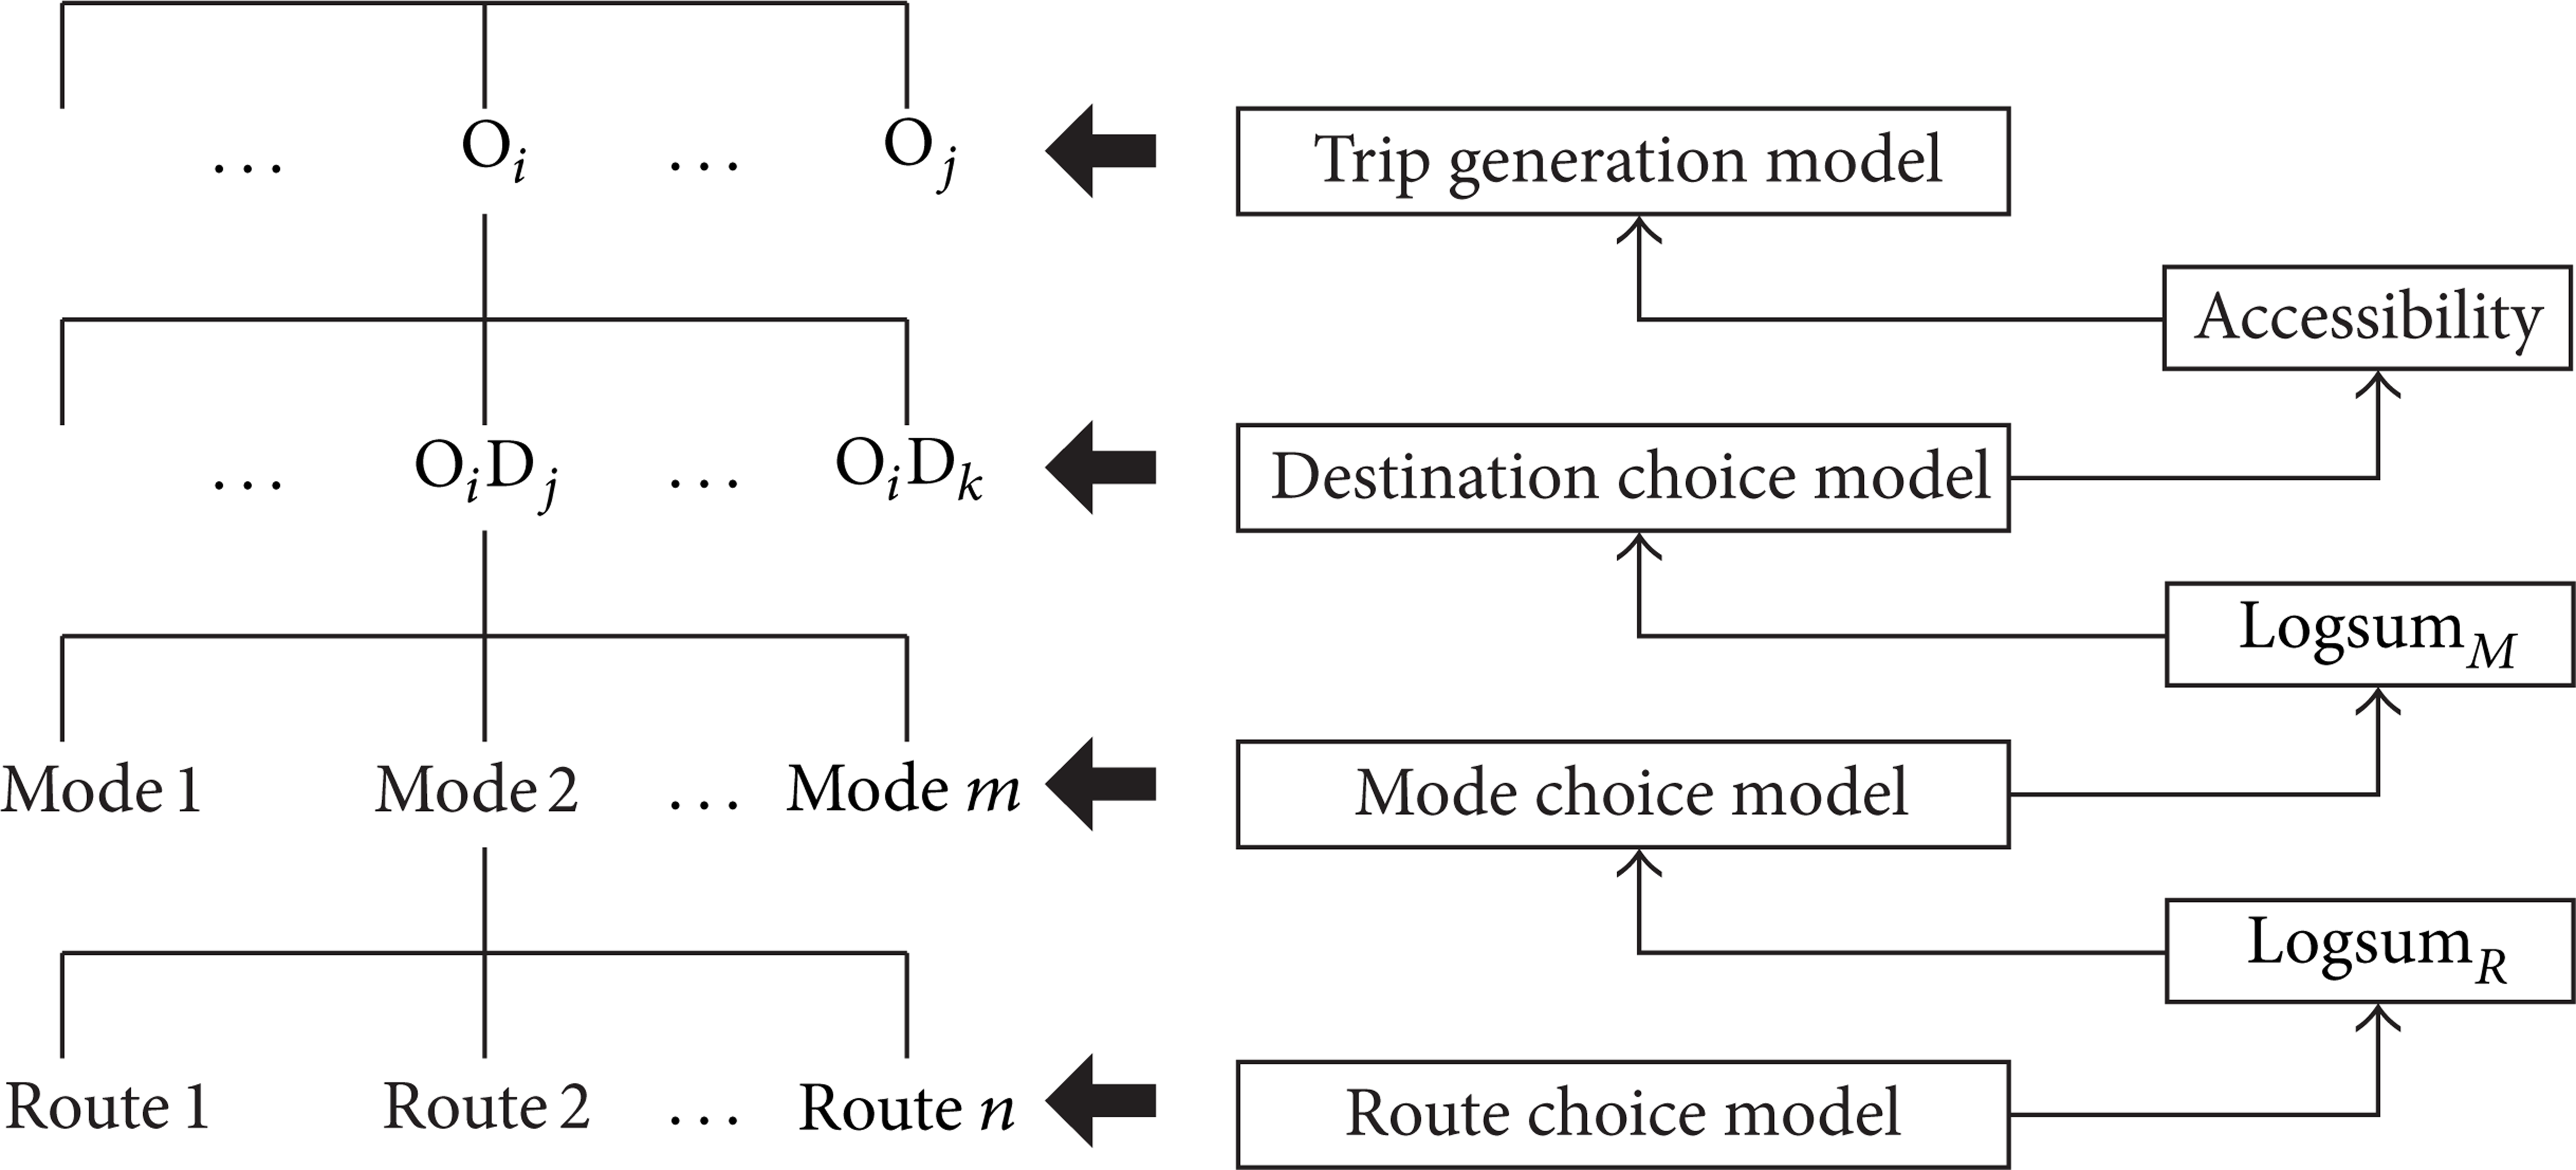
The nested structure of integrated intercity travel demand model [9].
Taking the intercity travel characteristics into account, the author improved the model system above. First, there are extremely limited routes combined with traffic mode in the main intercity transport corridor; unlikely, there are many even unlimited routes between origin and destination in urban areas. Therefore, the mode choice model and route choice model can be integrated into mode-route choice model. Besides, for intercity travel, the time spent from origin to station and form station to destination has a large proportion in total travel process, which has an impact on travelers’ choice of main intercity traffic mode. When building mode-route choice model, the access traffic model for origin and destination should be built to reflect utility for intercity travelers from access traffic mode to choose the main intercity traffic mode, as shown in Figure 2.

Improved integrated intercity travel demand model system.
3. Models
Based on the idea of model system construction, the author built an intercity travel demand analysis model system based on disaggregate model. This model is a complete multilevel model system including intercity trip generation, destination choice, and mode-route choice, where the mode-route choice mode includes main traffic mode choice model and access traffic mode choice model in origin and destination, as shown in Figure 3.

Multilevel model system.
3.1. Mode-Route Choice Model
The intercity mode-route choice model is the lowest level of the intercity travel demand model system. As shown in Figure 4, a total intercity travel process is from point O to point D. Traveler can choose public main mode such as intercity railway and expressway bus or private car. If traveler chooses public traffic mode, he must first travel by access traffic mode from point O to starting station, then travel by main traffic mode to the destination station, and finally travel by access traffic mode to point D. From Figure 4, we can see that a total intercity mode-route choice model consists of three parts, including main mode-route choice model and access mode choice model at points O and D, which can predict mode choice in each stage of travel process.

The total process of intercity travel.
3.1.1. The Access Traffic Mode Choice Model
As mentioned above, intercity travel should be considered in total travel process because access traffic process can affect traveler choosing main traffic mode. By building access traffic mode choice model, we can use Logsumaccess mode from access traffic mode choice model as a variable of main traffic mode choice model utility function to tell traveler how to choose main traffic mode.
Generally, there are five kinds of access traffic mode in bus station and train station, such as bus, metro, taxi, car, and walk. Because bus incidence with metro has correlation coefficient of a high level, we use NL model to avoid IIA characteristics, putting bus and metro into the same nest, as shown in Figure 5.
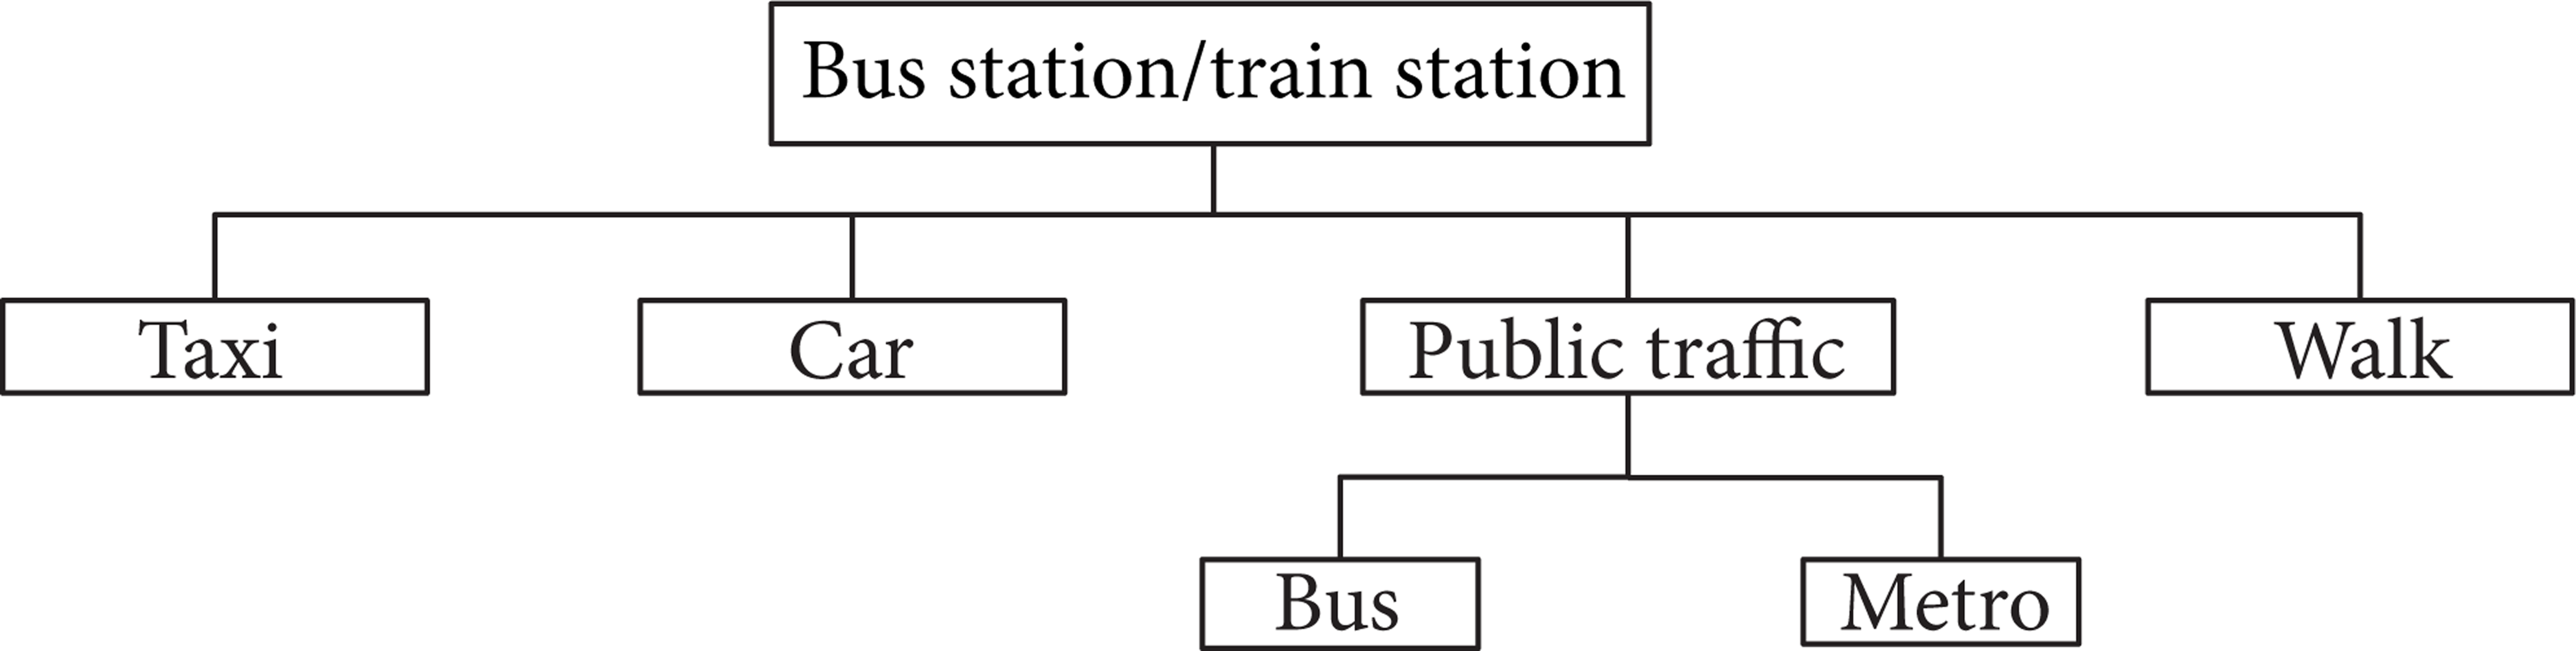
Access traffic mode choice model.
Due to need to consider the utility of access traffic mode both in the origin and the destination, the total utility of access traffic mode can be shown as
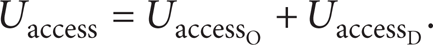
Consider the socioeconomic attributes, external trip characteristic, and access traffic mode characteristic for travelers, we can get the access traffic mode choice model utility function as below, where Ubus, Umetro, Utaxi, Ucar, Uwalk, and Utransit are utility of access mode for bus, metro, taxi, car, walk, and transit. ASCmetro, ASCtaxi, ASCcar, and ASCwalk are specific constants for metro, taxi, car, walk compared to bus. Time and Cost are symbiotic variables for each traffic mode and Income, Metroavail, Partysize, and Carown are specific variables which represent income, metro direct, peers, and car owner. β i (i = 1, 2,…, 8) and βLogsum are parameters which need to be calibrated.
Bus:

Metro:

Public transit:

Taxi:

Car:

Walk:

3.1.2. Main Traffic Mode Choice Model
We use NL model to build main traffic mode choice model the same as access traffic choice model which are nested together as shown in Figure 6.
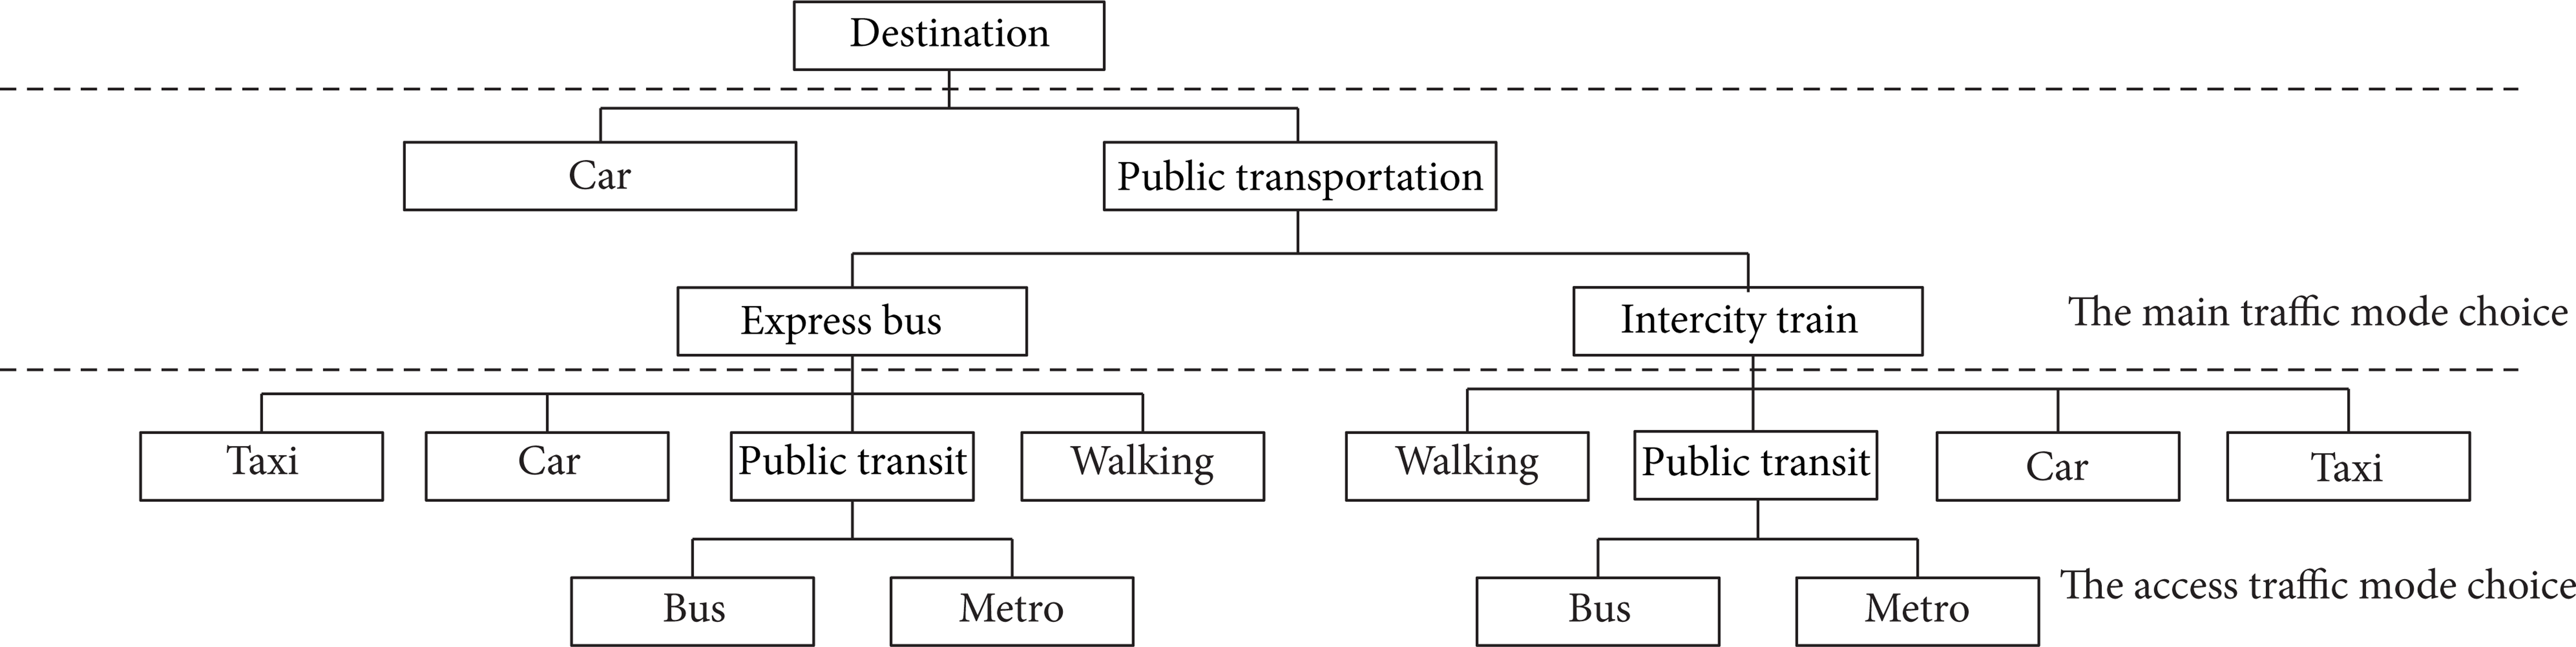
Main traffic mode and access traffic mode nested choice model system.
Similarly to the access traffic mode choice model, we can get the main traffic mode choice model utility function as below.
Express bus:

Intercity train:

Public transit:

Car:

3.2. External Trip Destination Choice Model
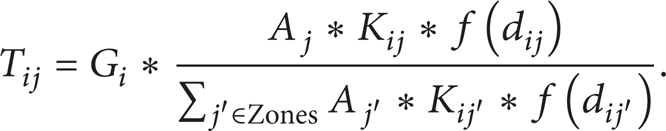
The purpose of destination choice model is to predict OD among cities after getting total travel in urban agglomeration, which is equal to trip distribution model. Compared with the gravity model in the traditional four-stage method, the destination choice model can better reflect individual travel behavior and easier be classified according to trip purpose based on utility. However, there is certain relationship between gravity model and destination choice model in essence. The double restraint gravitational model is as below.
The generation restrict:

The attraction restrict:

where T ij represents traffic volume from traffic zone i to j, G i represents trip generation in traffic zone i, A j represents trip attraction in traffic zone j, f(d ij ) represents traffic impedance function between zone i and j, and K ij is the traffic adjustment coefficient.
If

then
It can be changed as

Thus,

Thus,

Then, the probability of traveler from traffic i choosing traffic zone j is as

So the gravity model has changed to destination model based on logit model, where V j represents the utility that traveler chooses destination j. By calculating the probability of traveler choosing destination j, we can get traffic volume from one origin to each destination by aggregate method.
3.3. Intercity Trip Generation Model
The disaggregate trip generation model is based on individual behavior, imitating traveler's travel decision-making process including no travel, one-time travel, two-time travel, and three-time or more travel. The theory is to predict travel frequency probability in a certain period, and calculate the trip generation volume by aggregate method. In this paper, we use NL model as shown in Figure 7.

Intercity trip generation model system.
Specially, this disaggregate trip generation model is applicable to the resident population. For floating population, we can estimate by aggregate method

where T f represents intercity travel volume for floating population, N i represents the number of the ith types of floating population, D i represents average staying days for the ith type of floating population, and m represents the number of types for floating population.
3.4. Model Application
During the demand forecast, first input basic data into each stage model from bottom to top and calculate to get result from each stage model and logsum; then we can proceed demand forecast which is an iterative process as shown in Figure 8.

Model application process for intercity travel demand analysis.
4. The Case
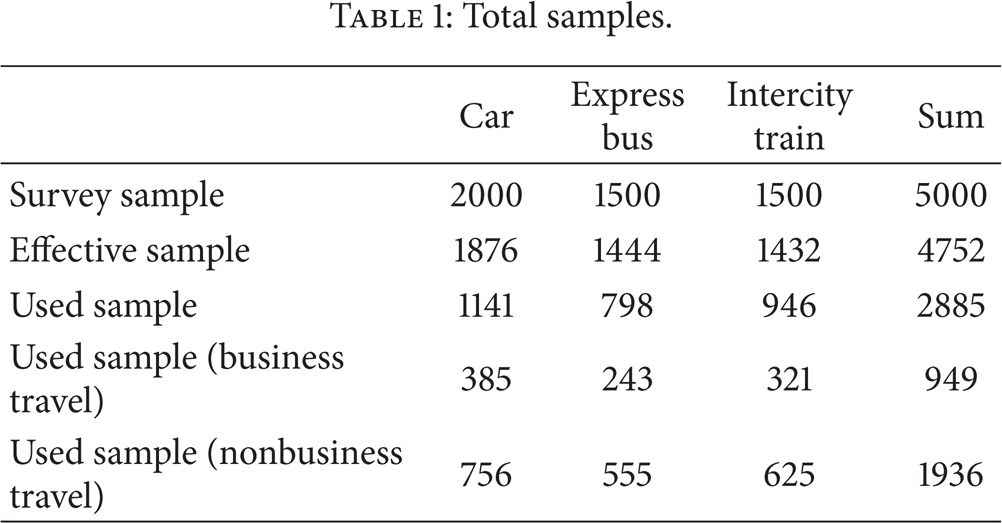
We use the model built in this paper to predict the Shenzhen to Guangzhou intercity railway demand in 2010. According to data survey, we classify these samples by travel purpose which is business travel and nonbusiness travel as shown in Table 1.
Total samples.
4.1. Parameter Calibration
Samples for access traffic mode choice model are shown in Table 2. With the estimation of parameters and test for the access traffic mode choice model by TransCAD and removing variables that the t-test value is less than 1.96 by several tests, we can get the result as shown in Table 3.
Samples for access traffic mode choice model.

Estimation of parameters and test for the access traffic mode choice model.

In Table 3, we can get that the symbols for all the parameters are consistent with the actual and the t-test values for all the variables are greater than 1.96, which means it has 95% certainty that these variables significantly affect the access traffic mode choice behavior. The inclusive value coefficients in the public transit nest are 0.387 and 0.442, which means there is a correlation between bus and metro. The Goodness ratios are 0.413 and 0.427, which means that the model accuracy can be accepted.
Samples for main traffic mode choice model are shown in Table 4. With the estimation of parameters and test for the main traffic mode choice model by TransCAD, removing variables that the t-test value is less than 1.96 by several tests, and trying, we can get the result as shown in Table 5.
Samples for main traffic mode choice model.

Estimation of parameters and test for the main traffic mode choice model.

In Table 5, we can get that the symbols for all the parameters are consistent with the actual and the t-test values for all the variables are greater than 1.96, which means it has 95% certainty that these variables significantly affect the main traffic mode choice behavior. The inclusive value coefficients in the public transit nest are 0.504 and 0.478, which means there is a correlation between express bus and intercity train. The Goodness ratios are 0.308 and 0.319, which means that the model accuracy can be accepted.
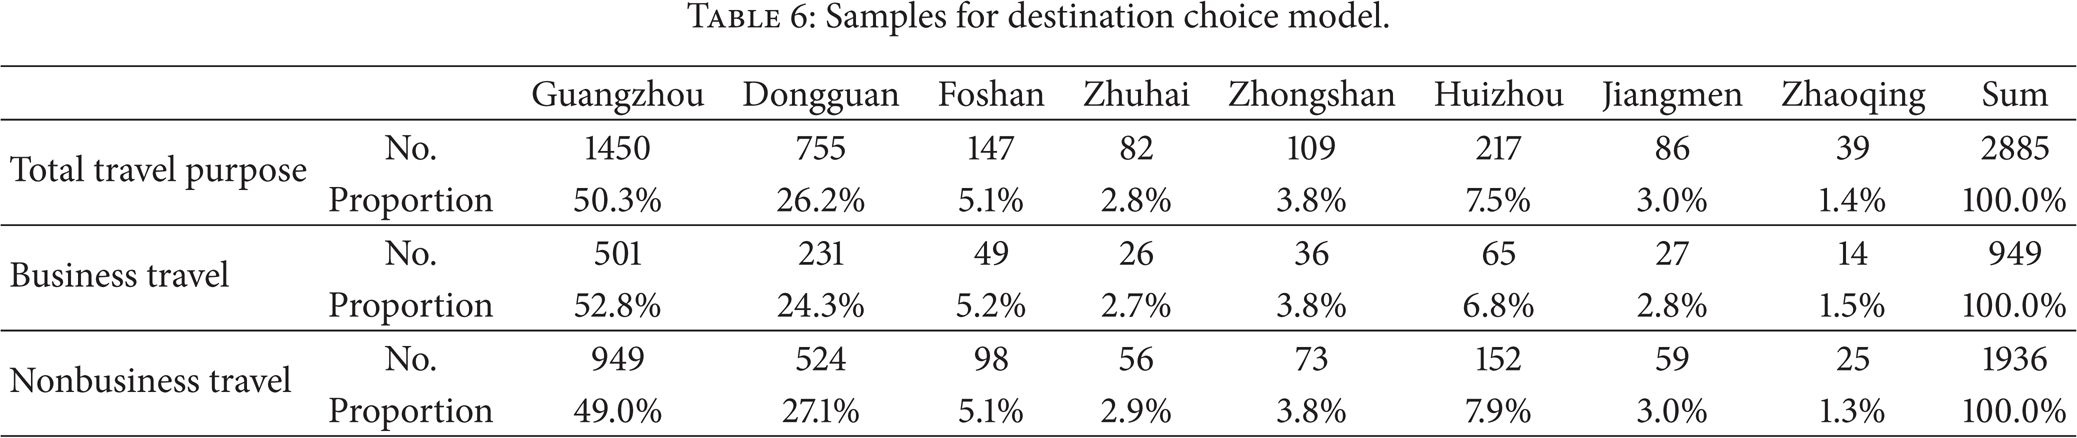
Samples for destination choice model are shown in Table 6. With the estimation of parameters and test for the main traffic mode choice model by TransCAD, removing variables that the t-test value is less than 1.96 by several tests, and trying, we can get the result as shown in Table 7.
Samples for destination choice model.
Estimation of parameters and test for the destination choice model.

In Table 7, we can get that the symbols for all the parameters are consistent with the actual and the t-test values for all the variables are greater than 1.96, which means it has 95% certainty that these variables significantly affect the destination mode choice behavior. The Goodness ratios are 0.181 and 0.203, which means that the model accuracy can be accepted.
Samples for intercity trip generation model are from the resident population survey. With the estimation of parameters and test for the intercity trip generation model by TransCAD, removing variables that the t-test value is less than 1.96 by several tests, and trying, we can get the result as shown in Table 8.
Estimation of parameters and test for the intercity trip generation model.
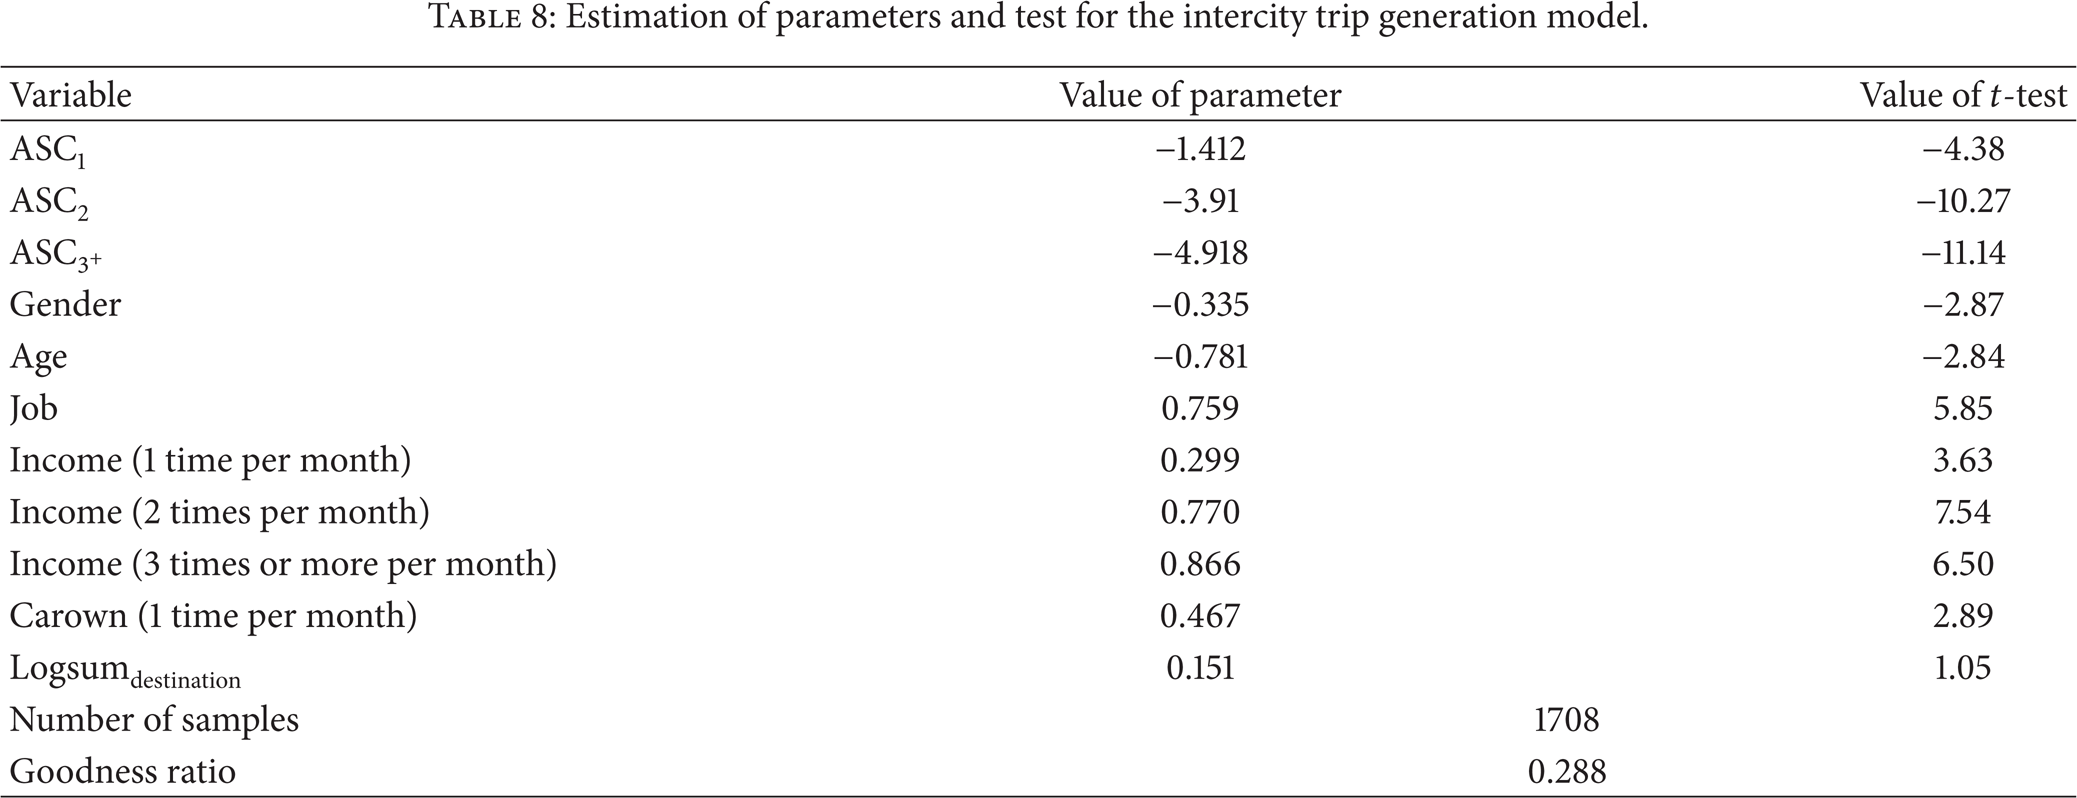
In Table 8, we can get that the symbols for all the parameters are consistent with the actual and the t-test values for all the variables are greater than 1.96 except for Logsumdestination, which means it has 95% certainty that these variables significantly affect the trip generation behavior. The Goodness ratio is 0.288, which means that the model accuracy can be accepted.
4.2. Access Traffic Mode Split
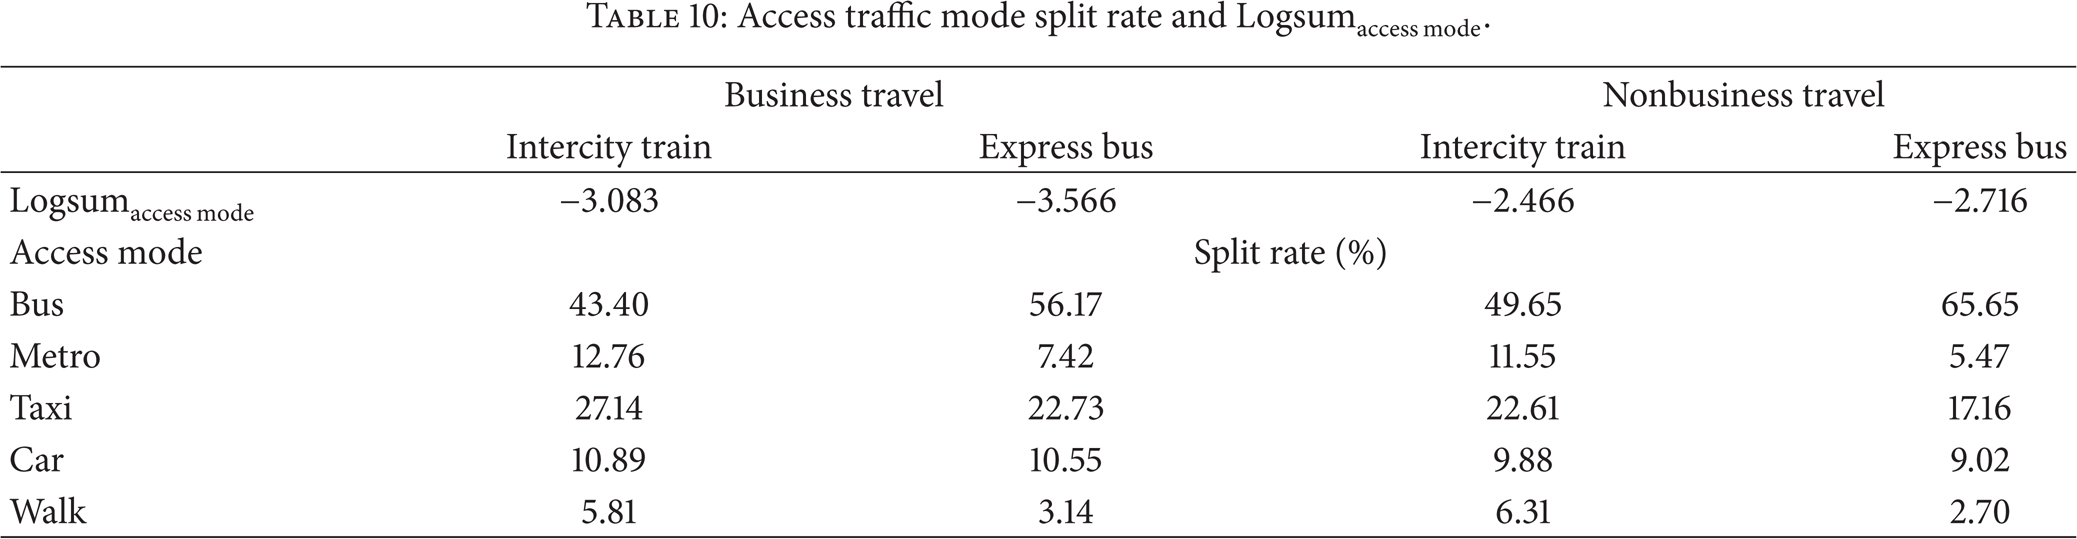
Input the basic data aggregated as shown in Table 9 into access traffic mode choice mode; we can get the access traffic mode split rate and Logsumaccess mode as shown in Table 10.
Access traffic mode indexes in 2010.

Access traffic mode split rate and Logsumaccess mode.
4.3. Main Traffic Mode Split
According to access traffic mode split rate and Logsumaccess mode, we can calculate the utility of each traffic mode in the main traffic mode choice model and get the main traffic mode split rate and Logsumaccess mode both in business travel and nonbusiness travel as shown in Tables 11 and 12.
Main traffic mode split rate and Logsummain mode for business travel.

Main traffic mode split rate and Logsummain mode for nonbusiness travel.

4.4. Destination Choice Probability
According to Logsummain mode and results in Tables 11 and 12, we can calculate the destination choice probability as shown in Tables 13 and 14.
Business travel probability from Shenzhen.

Nonbusiness travel probability from Shenzhen.

4.5. Trip Generation Frequency
According to Logsummain mode and indexes in Table 15, we can calculate the intercity trip generation volume in Shenzhen 2010 as shown in Table 16.
Intercity trip generation indexes.

Trip generation frequency per month in Shenzhen.

4.6. Intercity Railway Passenger Demand Prediction
According to destination choice probability, we can calculate the intercity travel demand in Shenzhen as shown in Tables 17 and 18.
Business travel demand in Shenzhen.

Nonbusiness travel demand in Shenzhen.

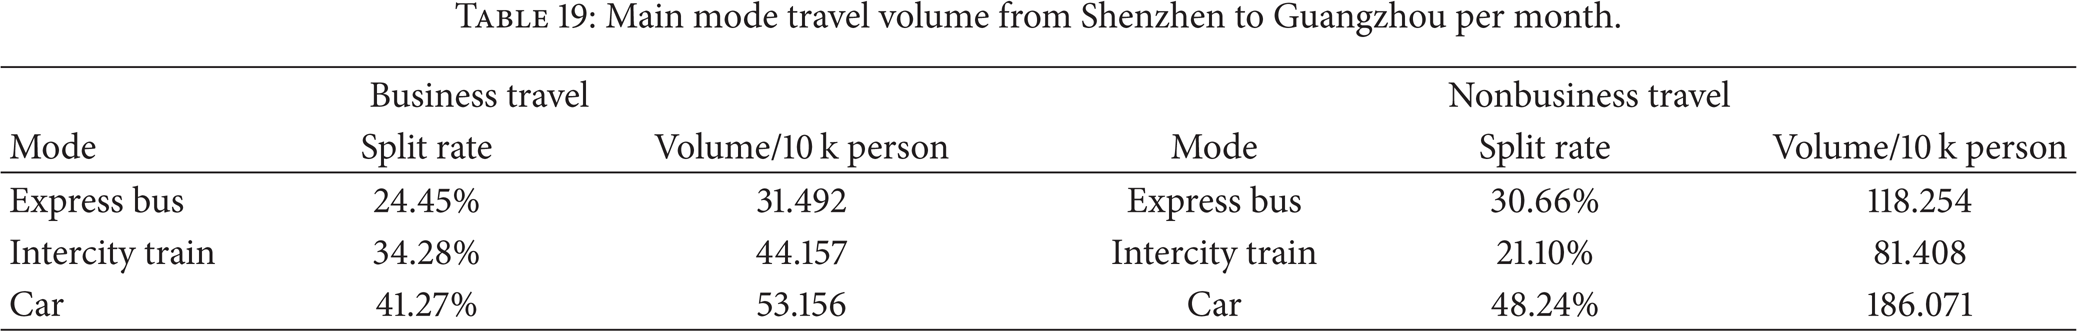
According to main traffic mode split rate, we can get the split volume as shown in Tables 19 and 20, so that we can calculate the intercity railway demand as 97.73 thousand persons per day, which is consistent with the actual value in Shenzhen 2010.
Main mode travel volume from Shenzhen to Guangzhou per month.
Main mode travel volume from Shenzhen to Dongguan per month.

5. Conclusions
In this paper, an integrated multilevel NL model structure system including trip generation, destination choice, and mode-route choice based on MNL model was built. The basic principle, the utility function settings, coefficient calibration, and statistical tests of each submodel were explained in detail and by description. Due to the shortness of distance of intercity corridor, the time spent on urban traffic and waiting time at the two terminals of the city occupy most of the time within the whole trip, and this fact influences the traveler's main mode choice the most. Therefore, a combined model of main mode choice and access mode choice was established to solve this problem. Then, the model was applied in Shenzhen intercity railway passenger demand forecast in 2010 as a case study. The forecast result was consistent with the actuality and the model's correctness and feasibility were verified. This paper made comprehensive and in-depth exploration and research on intercity travel demand model, which can provide theoretical and methodological support in regional comprehensive transportation system planning and demand forecasting.
Conflict of Interests
The authors declare that there is no conflict of interests regarding the publication of the article.
Footnotes
Acknowledgments
This research was supported by Technological Research and Development Programs of the Ministry of Railways (Project no. 2010X009-E), the 2013 Doctorial Innovation Funds of Southwest Jiaotong University, and the Fundamental Research Funds for the Central Universities, China.