
Abstract
A water-organic slug flow in a T-shaped microchannel was numerically studied due to its importance in the microreactor system. Various factors affecting the flow mode were studied, for example, channel width, fluid viscosity, interfacial tension, and inlet velocity. The volume of fluid (VOF) method was used to track the liquid-liquid interface, and the piecewise-liner interface construction (PLIC) technique was adopted to get a sharp interface. The interfacial tension was simulated with continuum surface force (CSF), model and the wall adhesion boundary condition was taken into consideration. The results show that strong vortexes appear in both phases at the meeting sites of main and lateral channels where an organic slug is producing. Inlet velocity influences the slug length and flow mode greatly. The ratio between the slug lengths of two phases in the main channel is almost equal to the ratio between their inlet velocities. If the slug is produced, the interfacial tension and organic viscosity have less effect on the slug length for 200 μm microchannel. The slug producing rate is much higher in a narrow channel than that in a wide channel.
1. Introduction
Nowadays microreaction technology is widely used due to the excellent mass and heat transfer properties as well as uniform flow patterns and residence time distributions of the small microfabricated reactors. Some of these devices even are available commercially and being tested by a growing community of researchers [1]. The spectrum of applications includes gas and liquid flow as well as gas-liquid and liquid-liquid multiphase flow. Recently, immiscible liquid-liquid slug flows in microchannels absorb extensive attentions due to the segmentation of the two fluids, in which the chemical reaction, mixing, and diffusion of the solutes can be enhanced greatly. On the other hand, microdroplets can be produced in such a liquid-liquid system in the microchannel under some certain conditions, for example, small slug, large interfacial tension and small contact angle between fluid and solid wall. The efficiency and properties of the slug flow in microreactors are mainly influenced by the channel geometry, viscosity ratio between two fluids, interfacial tension, and the flux of two liquids [2]. The various affecting parameters mean that optimizing the slug-flow system in micro-eactors needs extensive experimental work. Therefore, numerical study on such a system is indispensable to provide a reasonable and economical designing process.
As we know, the variety and complexity of flow phenomena clearly pose major challenges to the modeling approach. Accurate simulation of a multiphase flow problems with a moving interface lies in the obtaining of a sharp interface, which is quite difficult and a great challenge for the CFD researchers. Several techniques were developed in the last 25 years and can be classified into three main categories according to physical and mathematical approaches: capturing (Lagrangian), tracking (Eulerian), and combined methods. Reference [3] presents the detailed review of these methods. Among the various approaches of multiphase flow simulation, volume-of-fluid (VOF) [4, 5], level set method [6], front-tracking method [7], and lattice Boltzmann method [8] are known as useful tools. Further new developments on capturing interface include particle-mesh method [9] and CIP method [10].
The VOF method is widely adopted by in-house codes and built-in commercial codes. It is a popular interface tracking algorithm which has proved to be a useful and robust tool since its development decades ago, in which a color function C k is set as 1 for the kth fluid and 0 for the void, so that the interface locates in the computational cells in which 0 < C k < 1. However, a sharp interface is hard to obtain when solving the color function equation due to the numerical diffusion, which is the key point for this method. Therefore, the reconstruction of the interface is required. Several interface reconstruction technique were developed. for example, donor acceptor, flux line-segment model for advection and interface reconstruction, simple line interface calculation, and piecewise linear interface calculation. The historical perspective and comparison of these interface reconstruction techniques were introduced in detail in [11].
In the multiphase flow, interfacial tension force plays a crucial role. A popular model for the interfacial tension force is continuum surface force (CSF) model, which was developed by Brackbill in 1992 [12]. In CSF model, the interfacial tension was interpreted as a continuous, three-dimensional effect across an interface, rather than as a pressure boundary condition on the interface. It is widely used in the multiphase simulation due to its easy implementation and high accuracy. On the other hand, using CSF model, the wall adhesion/wetting effect can be easily simulated by a simple boundary condition on the interfacial tension force, which is an important phenomenon in a microsystem [13].
In the present study, using PLIC-VOF method combined with CSF interface tension model, a water-organic slug flow in a T-shaped microchannel was numerically studied including the effects of channel size, viscosity of organic phase, interfacial tension and inlet velocities of two fluids.
2. Model System
Figure 1 shows the present model system. Water and organic phases were simultaneously injected into the microchannel from the inlets of main channel and lateral channel, respectively. The inlet velocities were indicated as
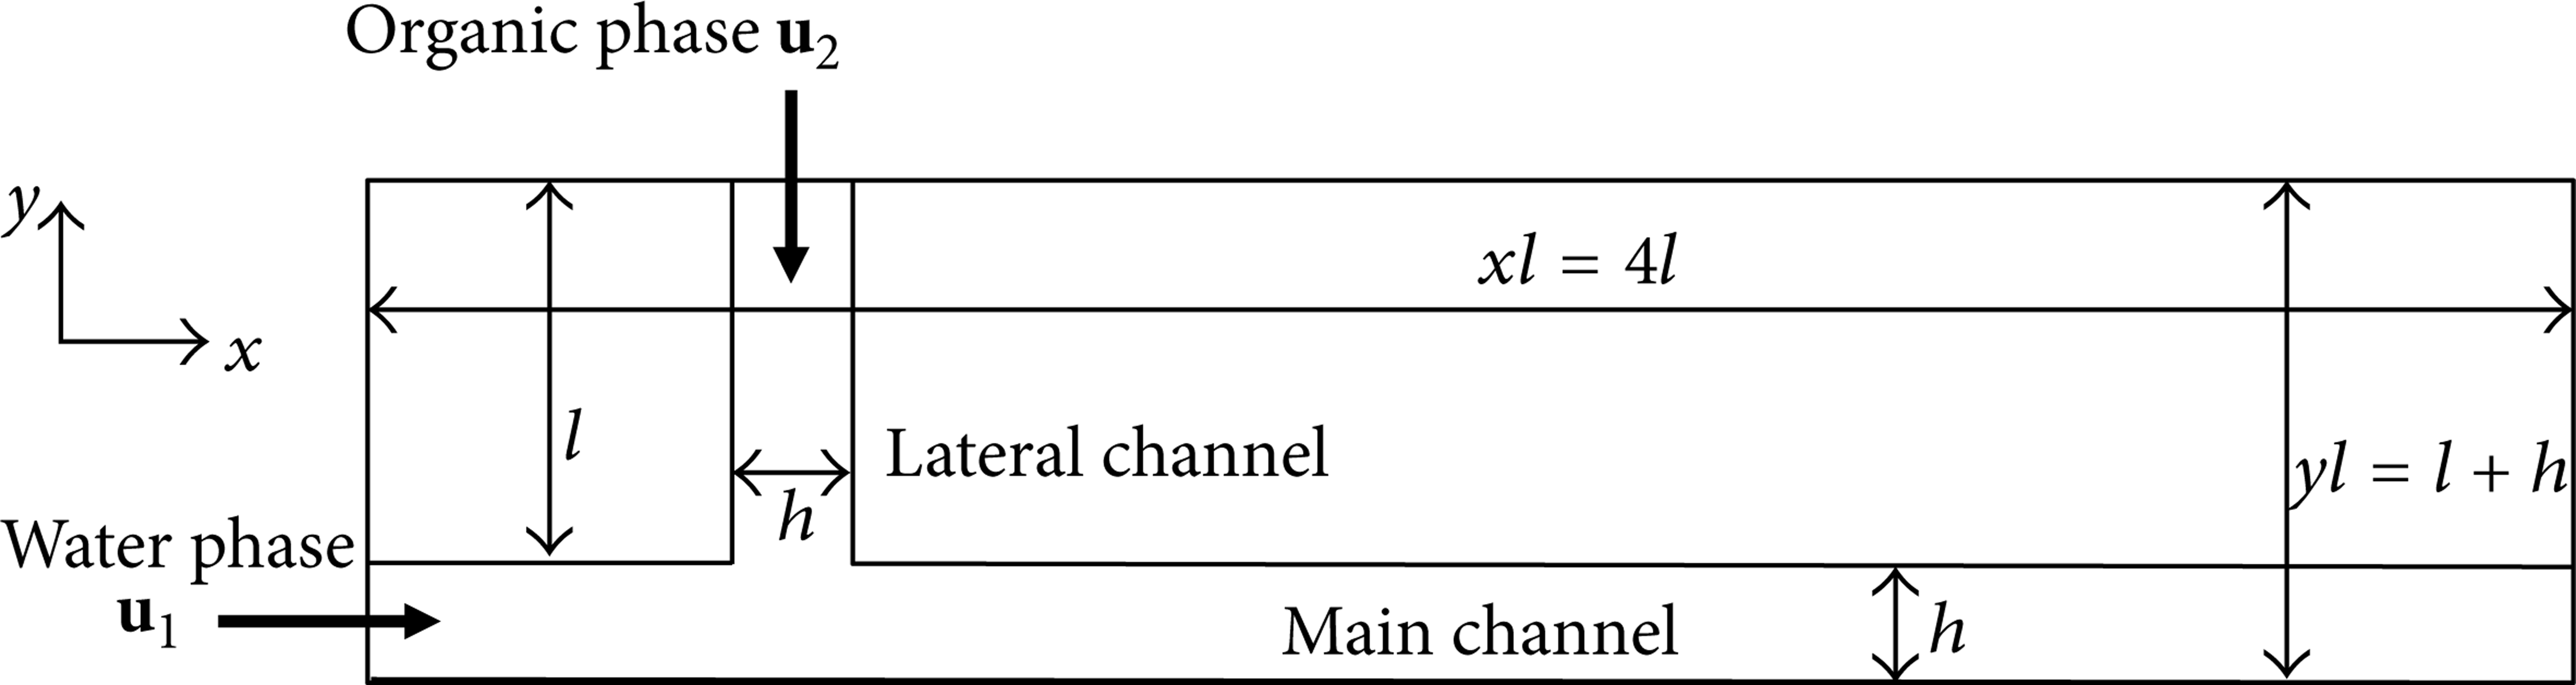
Computational model system.
In the present work, two-dimensional computation was considered. The computational domain (xl × yl) is shown in Figure 1. Here, xl = 4l and yl = l + h.300 × 120 rectangular grids were adopted. Since the T-shaped flow region occupied only part of the computational domain (xl × yl), the velocities outside the T-shaped region were set to zero manually in the computation.
3. Computational Methods and Governing Equations
In the present computation, the immiscible interface of the two phases was tracked by volume-of fluid (VOF) method [4, 5] on Eulerian grids. The color function C was set as 1 for water and 0 for organic phase. The interface was reconstructed by piecewise liner (PLIC) technique which was initially proposed by Youngs [14]. The surface tension was computed by continuum surface force (CSF) model [12].
3.1. Dimensional Governing Equations
The dimensional governing equations are as follows.
Color function:

Continuity equation:

Momentum equation:

where ρ = ρ2 + C(ρ1 – ρ2) and μ = μ2 + C(μ1 – μ2). Subscripts 1 and 2 stand for water (fluid 1) and organic phase (fluid 2), respectively. In the present computation, the physical properties ρ1 = 1000 [kg/m3], μ1 = 1.0 × 10⁻³ [Pa·s] were adopted for the water phase and ρ2 = 800 [kg/m3], μ2 = (1~20)μ1 for the organic phase.
The flow field was solved with finite difference method on a staggered mesh system. The highly simplified marker and cell (HSMAC) algorithm [15] was adopted to solve the pressure field and to improve the velocity field.
3.2. Interfacial Tension-CSF Model

where σ is the interfacial tension coefficient [N/m] and κ is the local curvature of the interface curve [1/m]. To avoid the acceleration due to surface tension depending on the density, (4) is improved as

Thus, when (5) is applied on (3), the last term, that is, acceleration due to surface tension, is independent on the density. The curvature κ is calculated from
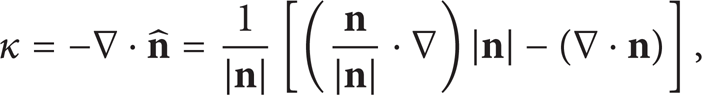
where,
For example;
Then, we get

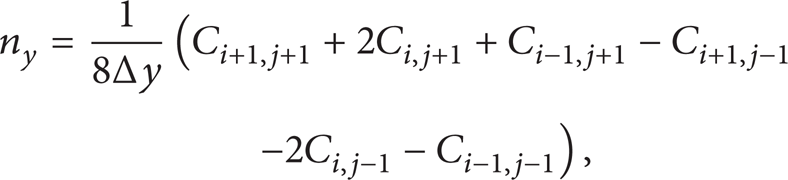
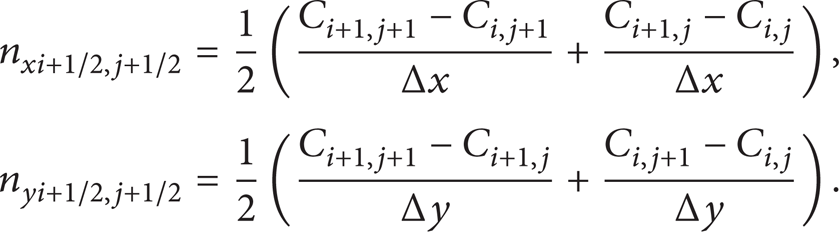
where Δx and Δy are the dimensions of a grid in x and y directions.
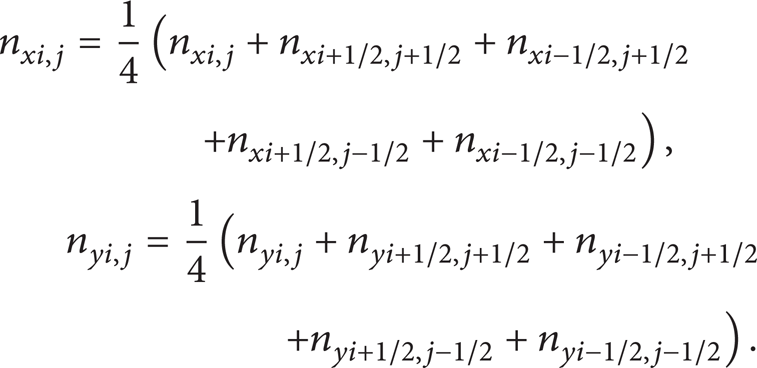
Cell-centered tension force

The required face-centered values
The effect of wall adhesion at fluid interfaces in contact with rigid boundaries, which is very important in a microflow, can be estimated easily in CSF model by applying a boundary condition in (11) as follow:

where θca is contact angle between fluids and solid wall. Contact angle is influenced by various factors, for example, the species of the fluids, the smoothness, and geometry of the solid wall. The static contact angle can be measured experimentally when the fluids are at rest.
3.3. PLIC Reconstruction of the Interface
To get a sharp interface, PLIC technique [14] was used to make reconstruction of the interface, in which a cell-centered line segment is used to simulate the interface and the flux of fluid is computed geometrically according to the interface location and slope. The line segment is described as

where n x and n y were computed according to (9) and (10), respectively.
Figure 2 shows four typical illustrations of the moving interface reconstruction in a computational grid. The dark area is full of fluid 1 and the light one fluid 2. Based on the sign of n
x
, n
y
, 16 reconstruction images can be obtained. Assuming β is the acute angle between the line segment and x-coordinate, then cot β = |n
x
/n
y
|. Assuming
type (a): C ≤ 0.5cot α or C ≤ 0.5cot−1 α,
type (b): C ≤ 1 – 0.5cot α,
type (c): C ≤ 1 – 0.5cot−1 α,
type (d): C ≥ 1 – 0.5cot α or C ≥ 1 – 0.5cot−1 α.

Sample illustrations of the moving interface reconstruction in a computational grid.
Other 12 types can also be decided by the same way. Besides, there are two special cases: n x = 0 and n y = 0, that is, the interface is horizontal and vertical. They should be considered separately from the above 16 cases.
After deciding the type of the line segment, the flux of fluid 1 whose color function is equal to 1 can be calculated analytically. In the present computation, the out-flow flux in a grid was computed, and the in-flow fluxes was corrected by the out-flow fluxes in the four neighbor grids. This is because the in-flow flux should be computed according to the value of C in the neighbor grids. Figure 3 shows the example of flux calculation. Assuming the velocities on the four sides are all positive, that is, u l , u b , u r , u t > 0, the out-flow fluxes on the left and bottom sides of the grid f l , f b are zero. The ones on the right and top sides f r , f t are the shaded areas S r and S t , respectively, which can be computed geometrically by β and C. The volume of fluid 1 in the grid (dark area) is CΔxΔy for two dimensional computation. Then, the color function C was computed as follows:

where superscript * stands for the value before the current correction. It should be noted that, in the boundary girds, both the in-flow and out-flow fluxes at the boundary side should contribute to the flux change at the same time.
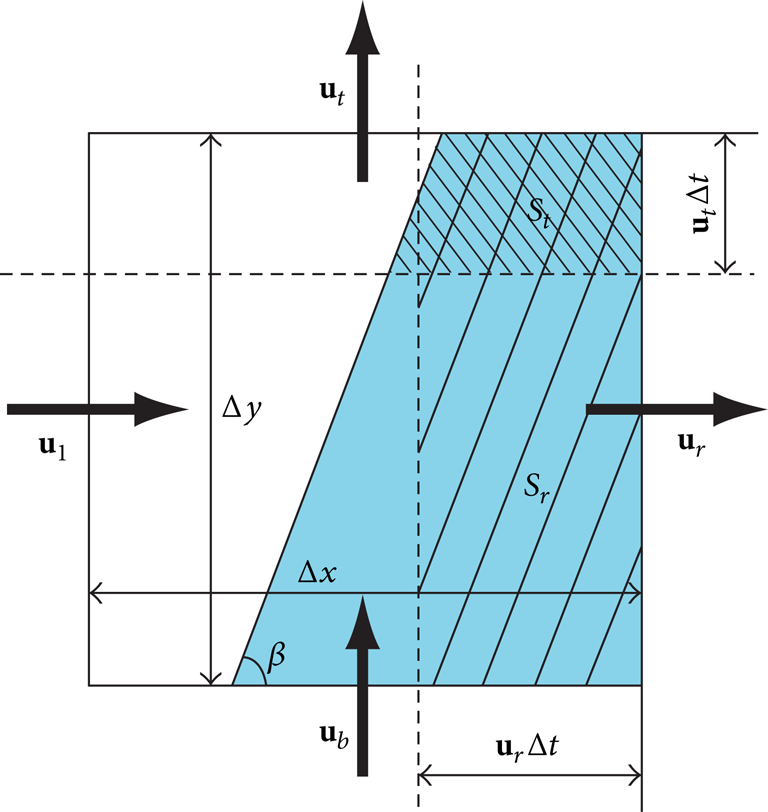
The sketch of flux calculation in a computational grid.
Figure 4 shows the performances of our PLIC-reconstruction method on Zalesak's slotted cylinder test problem [17]. The solution region is 1 × 1 and grids are 200 × 200. Time step Δτ = 10−4. It shows clearly that the present PLIC reconstruction tracks the sharp boundary efficiently.
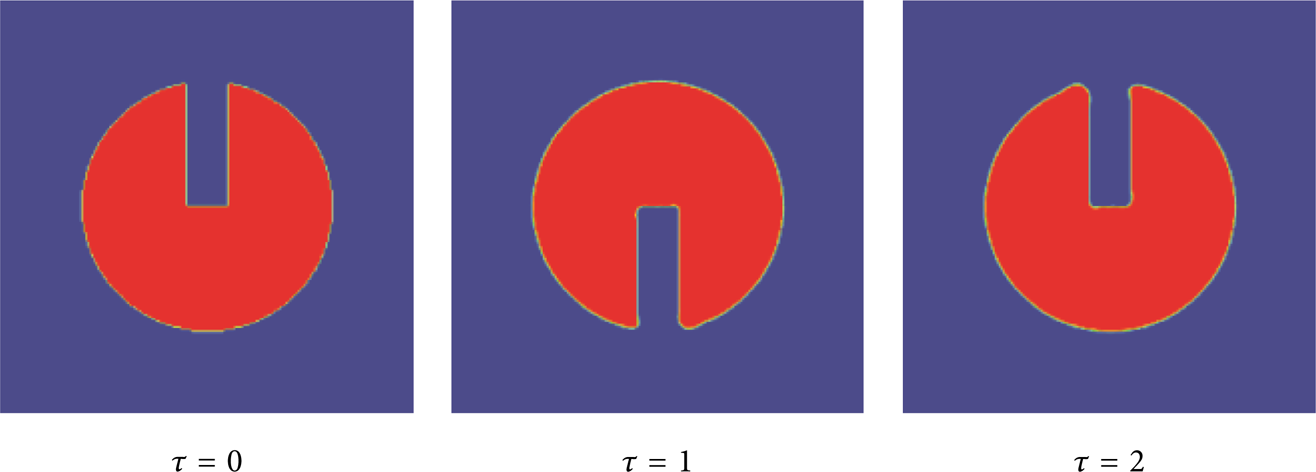
Performance of VOF-PLIC reconstruction on Zalesak's slotted cylinder test problem using 200 × 200 grids.
4. Result and Discussion
4.1. Transient Flow Mode and Velocity Field
Figure 5 shows the transient flow modes at h = 200 μm, |
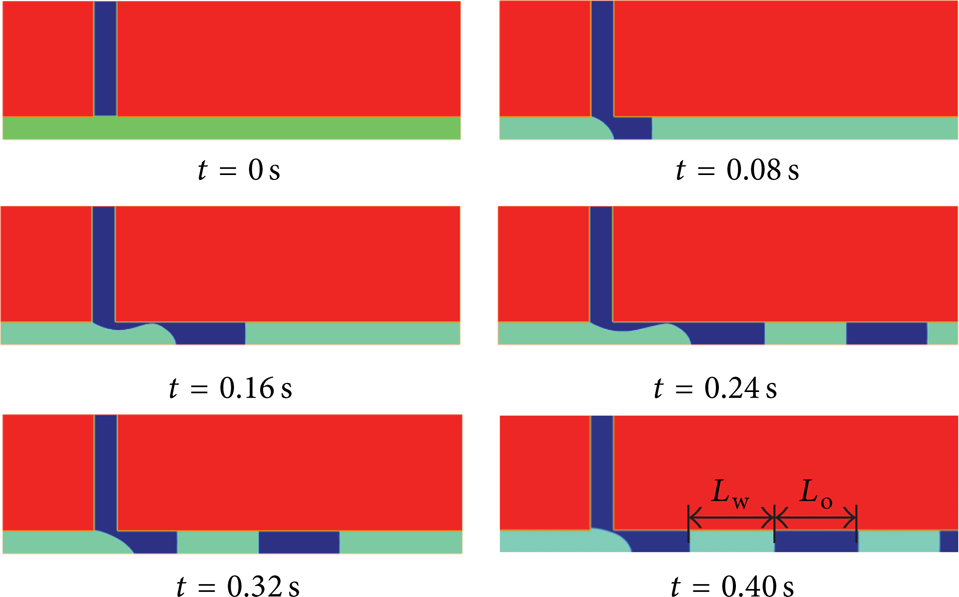
The transient flow modes at h = 200 μm, |
Figure 6 shows the local fluid streak lines and velocity vectors at t = 0.2–0.34 s for h = 200 μm, |
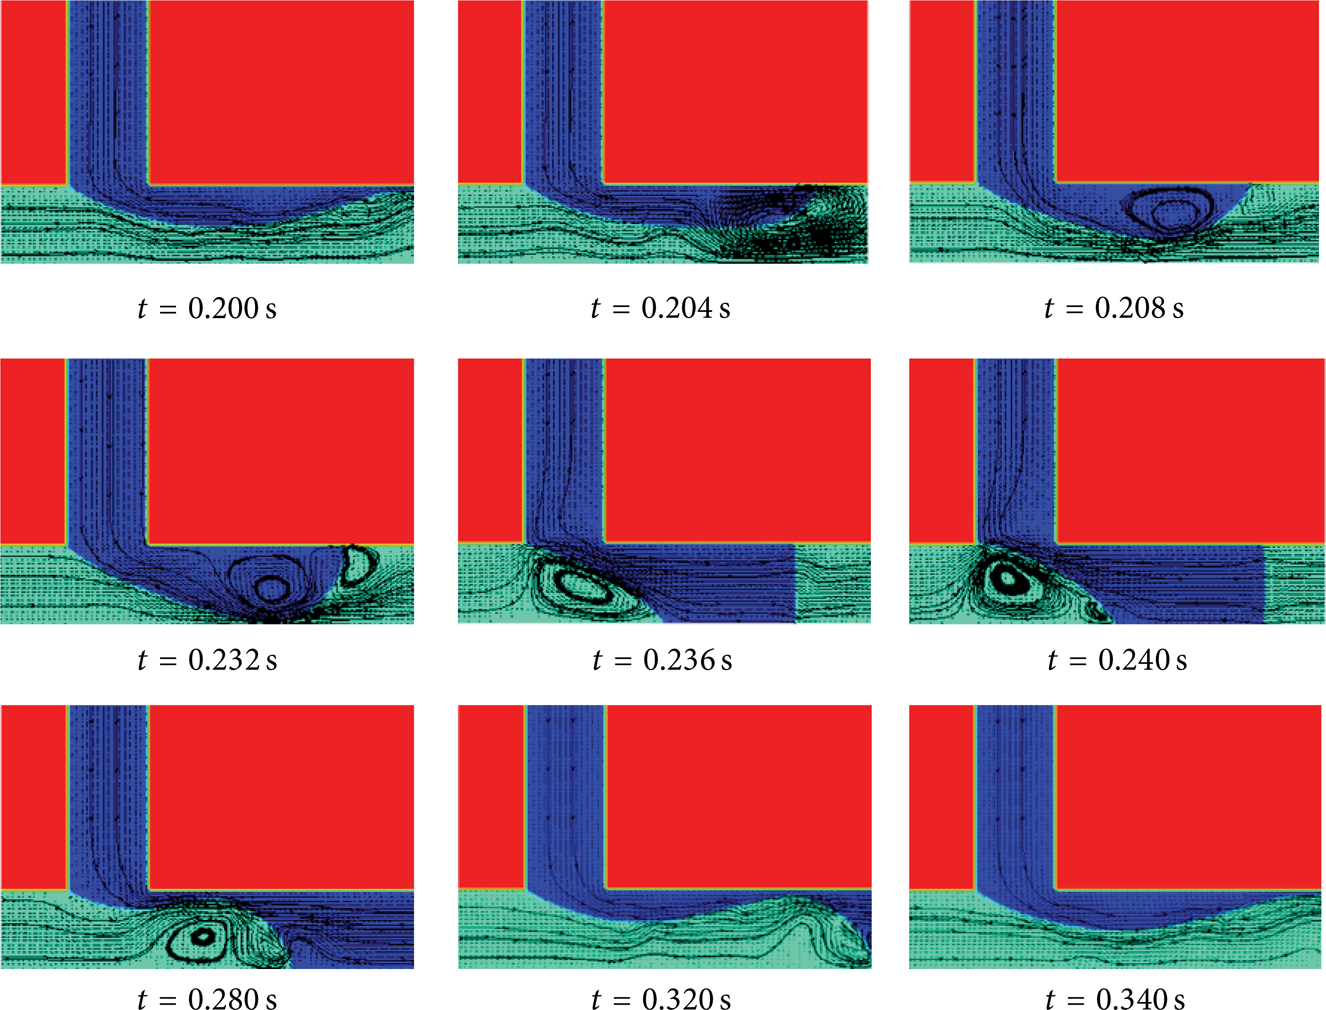
Local fluid streak lines and velocity vectors at t = 0.2–0.34 s for h = 200 μm, |
4.2. The Effects of Channel Width h, Interfacial Tension, σ and Organic Viscosity μ2
The channel width h affects the length of slug to a large extent. The cases of h = 500, 200, 100 and 50 μm at |
Table 1 shows the length of organic slug L
o
[μm] under various interfacial tensions σ and organic viscosities μ2 at h = 200 μm and |
The length of organic slug L
o
(μm) under various interfacial tensions σ (N/m) and organic viscosities μ2 (Pa·s). Other conditions are: h = 200 μm and

4.3. The Effect of Inlet Velocity of Water u1
In this section, the effects of the inlet velocity of water phase on the organic slug length (L o ) and water slug length (L w ) are studied. Although it is reasonable to study the effect of inlet volume flow rate [m3/s], due to the two-dimensional computation, the cross section area cannot be evaluated correctly. Since the lateral and main channel have the same-sized cross section, the inlet velocity ratio of two phases is equal to the ratio of their inlet volume flow rates, and we use the inlet velocity to study the effect of inlet volume flow rate. To show this effect clearly, the main channel length is increased to 8l in this section.
Figure 7 shows the flow modes under various inlet velocities of water |

Flow modes under various inlet velocities of water |

Slug lengths L
o
and L
w
[μm] against |

Figure 10 shows the producing rate of organic slug N [s−1] against |
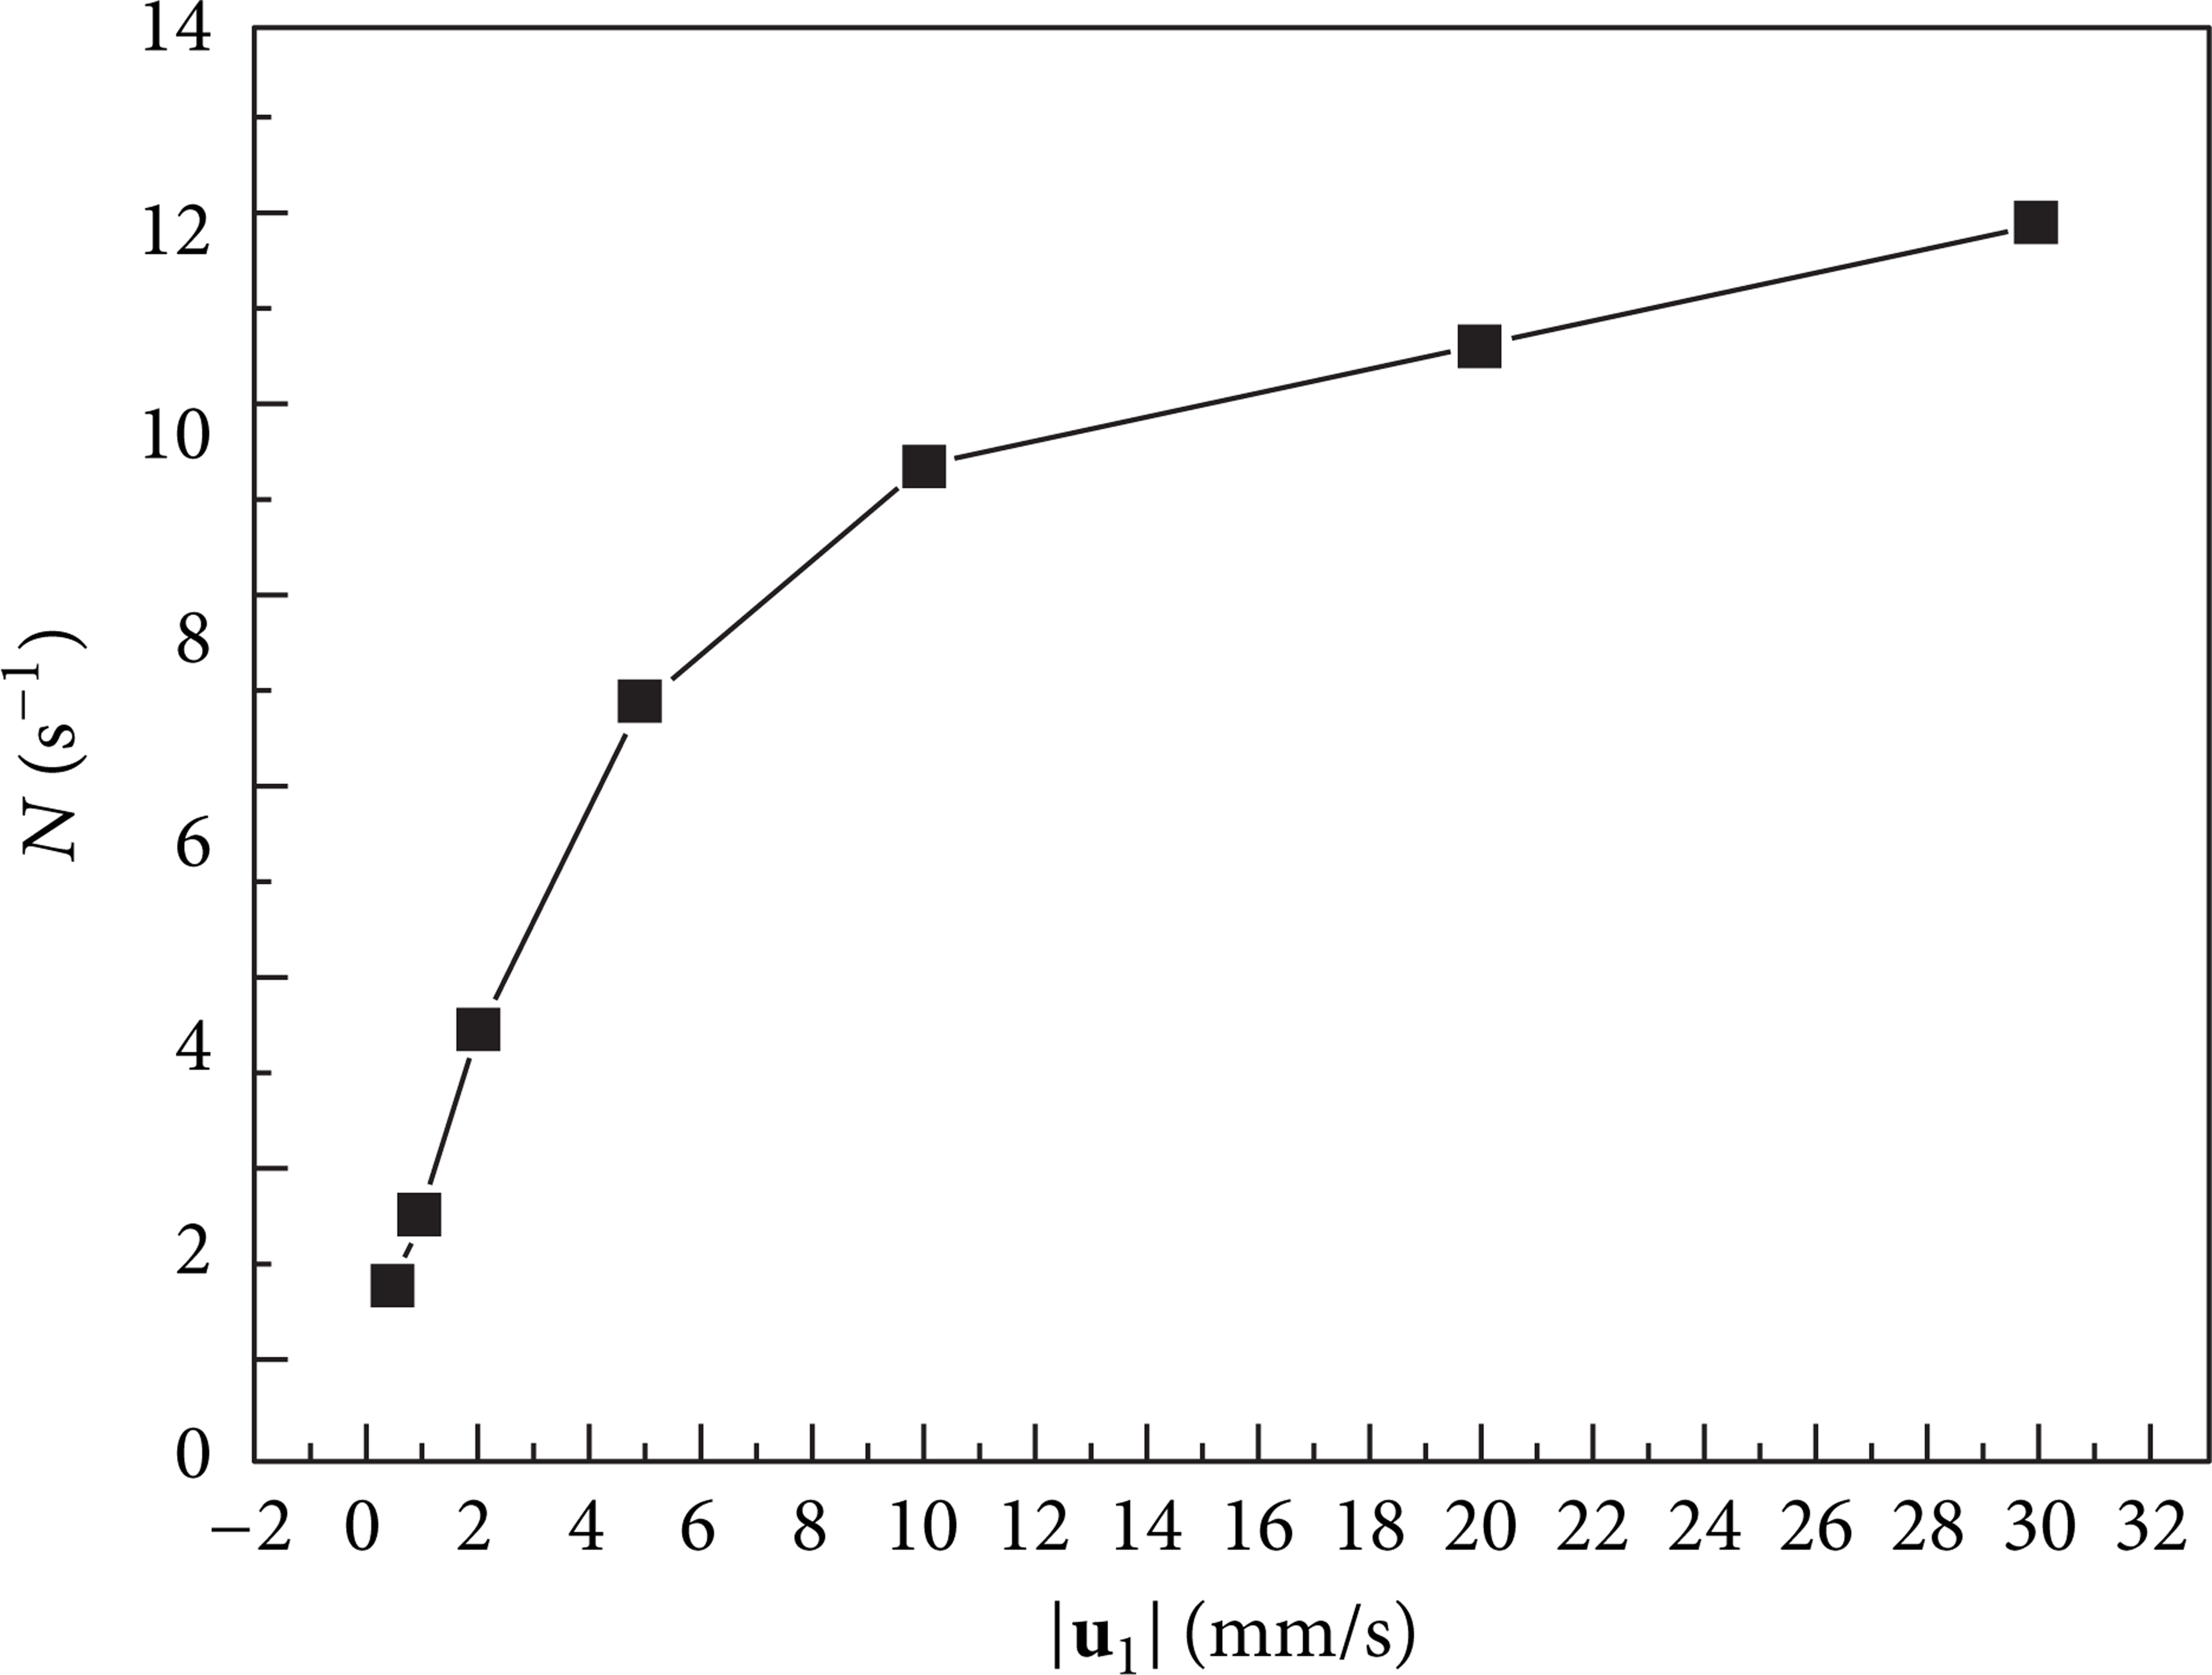
Producing rate of organic slug N [s−1] against |
5. Conclusion
The fluid-fluid flow plays an important role in micro-reactor for the enhancement of heat, mass, and momentum transfer. In the present work, we numerically studied water-organic flow in a T-shaped microchannel which is often met in the microreactor. Several important factors affecting the flow mode were studied, for example, the channel width, inlet velocity, fluid viscosity, and interfacial tension. These factors influence the flow mode, slug length, slug producing rate in the microchannel, especially the inlet velocity. It is also found that when a slug is producing, strong vortexes appear in both fluids. After a slug is produced, it moves along the channel, and there is no vortexes founded in the downstream of the main channel. The numerical results are expected to be a guide for various experimental works.
Footnotes
Nomenclature
Acknowledgments
The authors would like to acknowledge the financial support for this work provided by the National Natural Science Foundation of China (no. 11242010) and by the project of Cooperation of Innovative Technology and Advanced Research in Evolutional Area by Okayama Prefecture Industrial Promotion Foundation from the Ministry of Education, Culture, Sports, Science and Technology, Japan.