
Abstract
One of the most important applications of the wireless sensor networks is the widely applied smart environment. To prolong the network lifetime, it is important to develop the protocols for reducing energy consumption because the sensor nodes are constrained by limited energy. In the cluster based on energy-efficient method, the fixed cluster head number, the energy of the node, and the transmission distance are the keys to extending the network lifetime. In this paper, we propose an improved grouping protocol, which considers the distance between the sensor node and the sink node in order to allocate total energy of a group. The proposed method is compared with previous works of simulations to show the advantages of extending the network lifetime.
1. Introduction
Since the informatics technologies are rapidly developing, wireless sensor network (WSN) is also a technology which matures quickly [1–3]. WSN shows a great promise in the health care, environment monitoring, and ubiquitous computing applications. It can be combined with sensing, machine learning, pervasive computing, and communication technologies, assisting humans with valuable functions [4, 5]. It is easy to see that WSN applications will change human life.
A WSN consists of a large number of sensor nodes, which have small volume, low cost, limited computation, and limited power capacity [6]. Each node is used to sense and to transmit the sensed data to the base station (BS) for application. Since sensor nodes are small and the energy supplied by its battery is limited, development of the energy efficient method for extending the network lifetime becomes an important issue [7].
To reduce energy consumption, we can enhance the hardware efficiency or improve the network performance. There are many proposed network routing protocols [8–14]. The most common routing protocol is the cluster-based protocol [15]. In the cluster-based protocol, the nodes transmit the sensed data to the cluster head. The cluster head forwards the received data to the BS [16]. The most popular cluster-based method is called low-energy adaptive clustering hierarchy (LEACH) [15]. When we apply LEACH, the probability is used to determine if the node is a cluster head or not. All the nodes take turns to be the cluster heads. Probability makes the distribution of the cluster heads non-uniform, and the actual cluster head number may be different from the expected cluster number. Moreover, LEACH does not consider energy consumption in the algorithm of the cluster head selection.
To improve the cluster-based method by taking the energy consumption into account, stable election protocol (SEP) [10] and distributed energy-efficient clustering (DEEC) [12] are proposed. LEACH, SEP, and DEEC are similar in that they are divided into the clustering stage and the data transmission stage. During the clustering stage, the cluster heads are generated by probability. Data transmission operation is broken up into rounds. Each node sends the sensed data during each round. Compared with LEACH, the difference between SEP and DEEC is that they both consider the residual energy in the probability of the cluster head selection. However, the random selection makes the number of cluster heads not fixed.
The steady group clustering hierarchy protocol (SGCH) and the balanced energy-efficient grouping (BEEP) are proposed to fix the random selection [17–19]. These methods are divided into the grouping stage and the data transmission stage. The data transmission stage is the same as the SEP and DEEC. In the grouping stage, all sensor nodes are uniformly divided into groups, while the number of groups is equal to the expected number of clusters. In each round, the node with the maximum energy remaining in a group is selected as the cluster head. However, the residual energy of sensor nodes and the transmission distance are not considered in the SGCH and BEEP.
To make the energy efficient, we have to fix the number of the cluster heads and consider the energy of the nodes. Since energy consumption depends on the transmission distance, the distance should also be considered. In this paper, we propose an improved grouping protocol based on SGCH to make the cluster head number the same with expectancy. The total energy of a group and the distance between nodes and the BS are both used to generate the group. The proposed method is compared with LEACH, SEP, and DEEC by simulation to evaluate the performance.
2. The Proposed Method
The proposed method is based on SGCH and BEEP protocols. We call the proposed method adaptive grouping protocol (AGP). It is also divided into the grouping stage and the data transmission stage. In the grouping stage, the sensor nodes are divided into several groups. Compared with the SGCH and BEEP, the main difference between them and the proposed method is in the grouping stage. The proposed method considers not only the number of nodes but also the energy allocation in each group. The distance is also used to estimate the energy allocation. The following summarizes the details of grouping stage of the proposed method.
In the grouping stage, the distance ratio between each group and the BS will be computed. The distance ratio is used to calculate the total energy of each group. We expect the amount of clusters and groups to be the same. The distance ratio is set as

where

where

The timing diagram of the group stage.
Step 1. The BS broadcasts the group header request (GHR) message to all nodes.
Step 2. Every node returns the ACK message to the BS upon receiving the GHR. The ACK contains the ID and the initial energy of the node.
Step 3. The BS assigns a serial number to each node in the order of the received ACK messages. The BS then uses (1) and (2) to calculate the total energy of all sensor nodes and the energy of each group.
Step 4. The BS selects the node with the largest serial number as the head of the first group. The first group head is denoted as GH1, and the first group is set as G1. The BS sends the group head (GH) message containing the calculated total energy of G1 to GH1. We use
Step 5. When
Step 6. If a node does not belong to any group, upon receiving the GR message it returns an ACK (which includes the ID and the initial energy of the node) to
Step 7.
Step 8.
Step 9. The BS selects a node which does not belong to any group but has the largest serial number to be the next group header. The selected group head is set as
Step 10. Steps 5–9 are repeated until
Step 11. The last group head,
Data transmission stage is broken up into rounds. Each round begins with a cluster setup phase followed by a steady-state phase. The clusters and cluster heads are formed in the cluster setup phase. The data are transmitted to the BS in the steady-state phase. At the beginning of the data transmission stage, a node is waiting to broadcast a message that would declare it as a cluster head. The time of waiting is inversely proportional to the node's residual energy. Therefore the node with a higher residual energy waits for a shorter time to broadcast the declaration. We can see that, in a group, the node with the maximum residual energy will send the declaration message for being a cluster head first, while the other nodes will simultaneously abort the attempts to become the cluster head. In other words, a group will elect a node with the maximum residual energy in the group as the cluster head. After the node receives all declaration messages, it will send the join request message to the cluster head from which it has received the strongest signal strength. In the steady-state phase, nodes send data to the cluster head during allocated time slots. The data contains node ID and the sensed information. Each cluster head aggregates received data and forwards them to the BS.
3. Simulations and Results
In the simulations, MATLAB is used to compare the proposed method and the previous works, that is, LEACH, SEP, DEEC, and SGCH. We compare the network lifetime and the amount of packets received by the BS. The time variance of the node death is recorded to analyze the performance.
The proposed method is designed for the network model with 100 immobile sensor nodes deployed in a 100 m × 100 m square region uniformly. The BS is fixed and located outside the sensing area. The node senses at a fixed rate and always has data to transmit to the BS. The energy consumption is dependent on the distance between the transmitter and the receiver. A simple radio model is used to simulate the energy consumption of the nodes [20]. The radio electronics and the power amplifier consume the energy of the transmitter. The energy of the receiver depends on the radio electronics. Power control can be set using the power amplifier to ensure a certain power level in the receiver. When a node transmits a message with l bits through a distance d, the energy expended is

When the node receives this message, the energy expended is

where
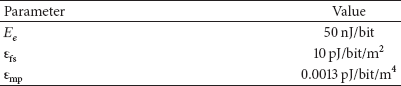
Parameters of the radio model.
In the first simulation, we set 100 immobile sensor nodes uniformly deployed in a 100 m × 100 m square region. Each sensor node had the same initial energy. In other words, a homogeneous wireless sensor network is set to simulate the smart environment sensing. The number of clusters (or the groups) is five. The BS is located outside the sensing area (50 m, 175 m). The simulation topology of the network is shown in Figure 2.
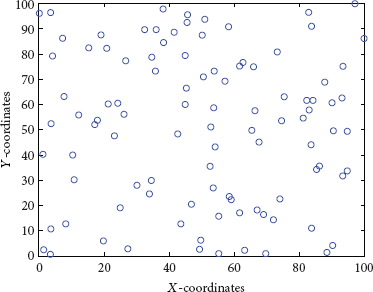
The topology example of the network.
The grouping results of SGCH and the proposed method after the grouping stage are shown in Figures 3 and 4, respectively. In Figures 3 and 4, G1, G2, G3, G4, and G5 are denoted as □, ◊, ∗, ×, and ☆, respectively. In the grouping result of SGCH (Figure 3), most nodes of G5 (☆) lie in the left-top corner, and there are two nodes of G5 that lie in the right-top corner. We can see that the grouping result of the proposed method makes the nodes of G5 gather at the same side (Figure 4).
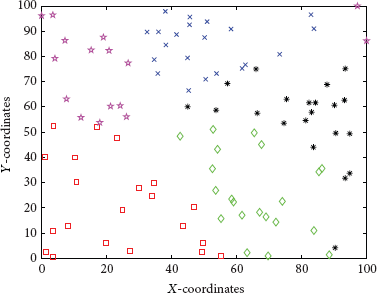
Grouping result of SGCH of Figure 2.

Grouping result of AGP of Figure 2.
The average number of nodes alive over the simulation rounds is shown in Figure 5. We can see that when we use that AGP, the time interval before the first node dies is the longest. Figure 6 shows the average number of messages received by the BS. The proposed method is obviously more efficient than the previous ones.

The number of nodes alive over round in the homogeneous simulation.

The number of messages received by the BS in the homogeneous simulation.
We have deployed the random network topology 10 times. In each topology, we evaluated the performance. We recorded the death rounds of the sensor nodes. The average and the variation of the node death rounds are shown in Figures 7 and 8, respectively. We can see that the performance of the proposed method is higher than that of the others.
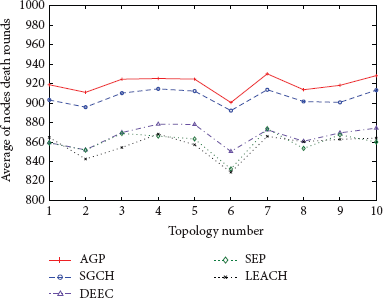
The average of the nodes death rounds in the homogeneous simulation.

The variation of the node death rounds in the homogeneous simulation.
The node dying distribution over rounds in the simulation can represent the performance. We record the rounds when the node dies, and the results are shown in Figure 9 with 3D diagrams. According to the results, in LEACH and SEP, the nodes near the BS have the longer lifetime. We can see that the node death distributions of LEACH and SEP are not uniform. In the results of the DEEC and the SGCH, the nodes death distributions are more uniform. The proposed method obtains a better average lifetime of nodes.

The node death distribution in the homogeneous simulation. (a) AGP, (b) SGCH, (c) DEEC, (d) SEP, and (e) LEACH.
In the second simulation, we set 10 high advance nodes and 90 normal nodes, which are uniformly deployed in a 100 m × 100 m square region. The initial energy of the high advance node is 4 times higher than that of the normal node. In other words, a two-level heterogeneous wireless sensor network is set for simulation. The number of clusters and the location of the BS are the same as in the first simulation. The average number of nodes alive over simulation rounds and the average number of messages received in the BS are shown in Figures 10 and 11, respectively. We can see that AGP is obviously more efficient than the other methods. We also deployed random network topology 10 times in order to record the node death distributions. The results are shown in Figure 12 with 3-D diagrams. According to the results, the proposed method allocates energy efficiently and performs well in the two-level heterogeneous wireless sensor network.

The number of nodes alive over round in the heterogeneous simulation.

The number of messages received by the BS in the heterogeneous simulation.

The node death distribution in the heterogeneous simulation. (a) AGP, (b) SGCH, (c) DEEC, (d) SEP, and (e) LEACH.
4. Conclusion
WSN shows a great promise in many applications, such as smart environment. Since the sensor node battery power is low, to reduce energy consumption for extending WSN lifetime becomes a key challenge. In this paper, an improved grouping protocol is proposed. The proposed method is called the adaptive grouping protocol (AGP). The AGP considers the distance, while allotting the energy to nodes for the grouping stage. In the simulations, the homogeneous and heterogeneous wireless sensor networks were set to evaluate the performance. The performance of the proposed method is better than that of the previous ones. The proposed method is suitable for the smart environment created by the wireless sensor network while the BS is located outside and far away from the sensing area. In the future, we will try to design the energy allocation protocol for the application, in which the BS is located near or inside the sensing area.
Footnotes
Acknowledgment
This work was supported by the National Science Council, Taiwan (NSC 100-222-E-324-011).