
Abstract
This paper calculates the carbon dioxide mitigation benefit of high-speed railway based on the carbon dioxide tax policy. We define the carbon dioxide emission system boundary for high-speed railway in its whole life cycle and estimate the life cycle carbon dioxide inventories during its construction, application, and recovery stages. And then we establish a theoretical model to calculate the life cycle carbon dioxide mitigation quantity for high-speed railway when compared with road transport and then calculate its carbon dioxide mitigation benefit. The numerical example shows that the carbon dioxide mitigation benefit of high-speed railway is better than that of road transport from the whole life cycle perspective.
1. Introduction
Nowadays, more and more countries pay their attention to climate change. The Intergovernmental Panel on Climate Change reported that lots of greenhouse gases were emitted by human activity was the main reason for global warming in 2007 [1]. As one of the basic economic and social activities, transport sector affects world energy demand and the environment, which covers a significant 32% of final energy use [2] and is responsible for about 25% of global CO2 emission in the world [3]. Road transport is responsible for 75% of the emission from the transport sector [4], which is a very serious threat to urban air quality and global warming [5–7]. Kok et al. [8] gave a review on cost-effectiveness analysis of transport greenhouse gas mitigation measures, for example, fuel economy and carbon dioxide standards for road vehicles in the USA and the EU. Ong et al. [9] attempted to review emission from road transport using COPERT 4 model and examined possible carbon dioxide mitigation strategies. In order to reduce energy consumption in transport, people pay more attention to high-speed railways because they have a technology and economic advantages as energy saving and large carrying-capacity. Åkerman [10] found that the life cycle emission reductions are found to be 550000 tons of CO2 equivalents per annum by 2025/2030 with almost 60% of this coming from a shift from truck to rail freight and 40% from a shift from air and road travel to high-speed rail travel. Chester and Horvath [11] found that high-speed rail has the potential to be the lowest greenhouse gas emitter, but continued investment and appropriate planning should be needed to ensure sustained high occupancy. Chang and Kendall [12] estimate the life cycle greenhouse gas inventory for construction of high-speed rail infrastructure from San Francisco to Anaheim and calculate its emission quantity during its construction stage. Those papers calculated the carbon dioxide emission for one kind of transport mode, but there are no comparative study on the carbon dioxide emission between different transport mode. It is very meaningful to analyze what is the mitigation comparative superiority of high-speed railway when comparing with road transport and to account its mitigation benefit.
The paper is structured in five sections. Section 2 introduces basic theory and then, in Section 3, the mitigation benefit accounting model is established. Section 4 follows with a numerical example, and, finally, Section 5 draws a conclusion. Because carbon dioxide is the main greenhouse gas and plays the most important role in global warming [13], so we will take carbon dioxide as an example to calculate the greenhouse gas mitigation quantity and benefit of high-speed railway.
2. Carbon Tax and Life Cycle Assessment
2.1. Carbon Tax
In order to prevent hazardous consequences of GHG concentration, governments are adopting some policies [14]. The carbon tax policy originated from Finland in 1990 which was expected to control and reduce carbon dioxide emission based on the theory of “Pigouvian tax.” Arthur Pigou who was a famous economist thought that environmental pollution had negative externality, and the tax should be levied to deal with it and then the whole social cost of a production or a system would be accounted. Most economists think that the main impact of carbon emission is that it leads to the climate change which produces more disastrous consequences. And the climate change is directly related to the concentrations of carbon dioxide rather than the annual carbon dioxide flow. In addition, the carbon tax has the stronger policy compatibility, and the government can promote low carbon development by means of carbon emission standards and renewable energy quota system, encouraging and supporting clean energy technology at the same time. It is found that the carbon tax policy had played an important role in reducing carbon dioxide emission quantity in Norway, Sweden, Denmark, and Finland. The tax has delivered substantial revenue to government [15]. The carbon tax in Greek is an environmentally effective policy for mitigating global warming, although a costly one [16].
2.2. Life Cycle Assessment
International Organization for Standardization defines Life Cycle Assessment as a method to summarize and to evaluate the potential impact on the environment produced by all the inputs and outputs of a product or a service system in the whole life cycle [17]. The United Nations Environment Program defines it as a tool to evaluate the environmental impact of a product system in its whole life cycle. Though the concrete contents of the above definitions are different, their cores are consistent. Usually the Life Cycle Assessment includes three steps: to determine the evaluation object and scope, to estimate the greenhouse gas inventory, and to assess the environmental impact.
(1) To Determine the Evaluation Object and Scope. It is a process to summarize and evaluate the inputs, outputs, and potential environmental impact of a product system and to characterize its degree of impact on the environment.
(2) To Estimate the Greenhouse Gas Inventory. It is a process to abstract and to generalize the material and energy flow of a product system in its whole life cycle and to analyze the resource, energy input, and environmental emission (e.g., waste gas, waste water, and solid waste) in its whole life cycle, whose essence is to collect, to arrange and to analyze those data.
(3) To Assess the Environment Impact. It is a process to assess those relative factors according to a certain method in order to demonstrate the potential impact of a product, a process, or an activity on the environment.
With Life Cycle Assessment theory, we can comprehensively calculate the carbon dioxide mitigation quantity of high-speed railway. And, with carbon tax theory, we can calculate the mitigation benefit of high-speed railway from the capital perspective, which is helpful to measure its mitigation benefit.
3. Mitigation Benefit Model of High-speed Railway
3.1. Evaluation Object and Scope
The life cycle carbon dioxide emission of high-speed railway refers to the total carbon dioxide quantities emitted by high-speed railway because it consumes lots of energy and resources. The environmental impact evaluation system boundary interior of high-speed railway should include a series of intermediate product and unit process flow, which are shown in Figure 1.

Carbon emission evaluation object and scope.
3.2. Inventory Analysis
When estimating the life cycle carbon dioxide inventory for high-speed railway, we should think over that high-speed railway has the positive benefit to the environment during its application stage which can offset lots of carbon emissions during the construction stage of its infrastructure because it has advantages such as energy-saving, land-saving, and freight increment substitution effect. The life cycle carbon dioxide inventory contents of high-speed railway, during the construction, application, and recovery stagesare shown in Table 1.
Carbon dioxide inventory of high-speed railway.

The carbon dioxide emission quantities during each stage of high-speed railway can be calculated as follows.
3.2.1. Carbon Emission during the Construction Stage
(1) Carbon Emission during the Production Process of Building Materials. Massive building material, particularly cement and steel, has been consumed during the construction stage of high-speed railway infrastructure. Massive energy has been consumed during the production process of those building materials, and then plenty of carbon dioxide has been emitted. At the same time lots of carbon dioxide has been emitted because of the mineral raw materials decomposition during their production process.
The more annual average quantity of carbon dioxide zp sc (kilogram) contributed by high-speed railway emissions to the environment than that of carbon dioxide contributed by highway emissions during the production process of those building materials which is used during the construction stage can be calculated as follows:

where n tyl (kinds) is main building materials kinds used during the construction stage of high-speed railway infrastructure, tyl i (ton) is the quantities of the ith kinds building materials used during the construction stage of high-speed railway infrastructure, tdyl i (kilogram per ton) is the carbon dioxide quantity emitted during the ith kinds building materials production process used during the construction stage of high-speed railway infrastructure, tyn (year) is design service life of high-speed railway, n gyl (kind) is main building materials kinds used during the construction stage of highway infrastructure, gyl i (ton) is the quantities of ith kinds building materials used during the construction stage of highway infrastructure, gdyl i (kilogram per ton) is the carbon quantity emitted in the ith kinds building materials production process used during the construction stage of highway infrastructure, and gyn (year) is design service life of highway.
(2) Carbon Emission during the Convey Process of Building Materials Construction Machines. The building materials and construction machines used during the construction stage should be transported to construction place during the construction process of transportation infrastructure. The more annual average quantity of carbon dioxide zp ys (kilogram) contributed by high-speed railway emissions to the environment than that of carbon dioxide contributed by highway emissions during the convey process can be calculated as follows:

where tyj i (kilometer) is the average transportation distance of the ith kinds building materials used during the construction stage of high-speed railway infrastructure, tdyj i (kilometer) is the carbon quantity when transporting one ton of the ith kinds building materials for one kilometer used during the construction stage of high-speed railway infrastructure, gyj i (kilometer) is the average transportation distance of the ith kinds building materials used during the construction stage of highway infrastructure, and gdyj i (kilometer) is the carbon quantity when transporting one ton of the ith kinds building materials for one kilometer used during the construction stage of highway infrastructure.
(3) Carbon Emission during the Construction Process of Infrastructure. Plenty of construction machines should be used during the construction stage which will consume lots of energy and emit lots of carbon dioxide during the construction stage of high-speed railway infrastructure; it is because there are lots of bridge and tunnel construction. The more annual average quantity of carbon dioxide zp sg (kilogram) contributed by high-speed railway emissions to the environment than that of carbon dioxide contributed by highway emissions during the construction stage can be calculated as follows:

where n tsg (kind) is the kinds of main construction machines which will consume energy and be used during the construction stage of high-speed railway infrastructure, tsg i (kilogram) is the carbon quantities emitted by the ith construction machine which will consume energy during the construction stage of high-speed railway infrastructure, n gsg (kind) is the kinds of main construction machines which will consume energy and be used during the construction stage of highway infrastructure, and gsg i (ton) is the carbon quantities emitted by the ith construction machine which will consume energy during the construction stage of highway infrastructure.
3.2.2. Carbon Emission during the Application Stage
(1) Carbon Emission Caused by Energy Consumption. Massive energy has been consumed during the application process of transportation. The cars of high-speed railway are distracted by electric locomotive which can adopt renewable energy, such as wind power and hydropower. At the same time, lots of energy saving designs are used in high-speed railway; for example, the weight of motor-car group is less than that of common passenger car by 30%, so the effect of high-speed railway to reduce the consumption of energy is very significant. The average electricity consumption of the CRH3 motor-car is 15 kw per person. From the energy consumption perspective, the less quantity of carbon dioxide jp jn (kilogram) contributed by high-speed railway emissions to the environment than that of carbon dioxide contributed by highway emissions during the application process can be calculated as follows:

where, kz (kilo person and kilometer per year) is the annual average passenger turnover quantity of high-speed railway, tdy (person per train) is seating capacity of motor-car group, tszl (%) is attendance of high-speed train, tgl (kilowatt) is average power of motor-car, tss (kilometer per hour) is average speed of high-speed railway, dpt (kilogram per kilowatt and hour) is average carbon dioxide emission power in our country, gkcbl (%) is the ratio between the passenger quantities traveled by coach and all the passenger quantities by road, gkcyl (persons per coach) is the average quantity of passenger traveled by coach, gkcyh (liter per kilometer) is the average fuel consumption of coach, gjcyl (persons per car) is the average quantity of passengers transported by one car, gjcyh (liter per kilometer) is the average fuel consumption of car, and gpt (kilogram per liter) is the average carbon dioxide emission quantity of one liter fuel consumption.
(2) Carbon Dioxide Mitigation Caused by Land Using. According to ecology, transport system should reduce the use of land, and the land area of high-speed railway infrastructure will be less than that of other transport mode. In order to make the railway line more smooth, high-speed railways in our country use lots of bridge and tunnel construction instead of embankment construction (the bridge-instead-of-embankment construction), which effectively reduces the cut for the city along the railway and can save amounts of land on which trees and grass can be planted. Plants absorb carbon dioxide through photosynthesis and release oxygen, and then the carbon dioxide in the atmosphere is fixed on the vegetation by the form of biomass, and the carbon dioxide quantity in the atmosphere is reduced during this process. The less quantity of carbon dioxide jp jd (kilogram) contributed by high-speed railway emissions to the environment than that of carbon dioxide contributed by highway emissions because of land conservation can be calculated as follows:
where tlk (kilometer) is the width of double-tract railway, kb (%) is the ratio of the areas of infrastructure construction between high-speed railway and highway for the same mileage, qsb (%) is the ratio of the length between the bridge and tunnel construction and the whole high-speed railway line, qjd (square kilometer) is the area of the land saved by the bridge and tunnel construction instead of the embankment construction, l (kilometer) is the length of high-speed railway line, sxt (kilogram per square kilometer) is the carbon dioxide quantity absorbed by forest, sb (%) is the ratio of the planting area between forest and grassland planted on the land saved by the bridge and tunnel construction, and cxt (kilogram per square kilometer) is the carbon dioxide quantity absorbed by grassland.
(3) Carbon Dioxide Mitigation Caused by Freight Increment Substitution Effect. High-speed railway in our country is mainly used to transport the passengers, which is helpful to enhance the capacity of freight transportation on the existing railway line. Because the convey capacity of railway is much greater than that of highway and the energy conservation effect of railway freight transportation is very obvious, it will reduce lots of carbon dioxide emissions if high-speed railway is put into operation, and it is the so-called freight increment substitution effect.
Because the passenger train deduction coefficient is more, the passenger train will use lots of train paths and the capacity of freight transportation is reduced when the passenger train and freight train run on the same railway line. If high-speed railway can shift many passengers from existing railway line and the quantity of passenger trains is reduced, then the freight transportation capacity will be increased. By the empirical formula, we can approximately calculate hz n k (ton), the capacity of the freight transport on existing railway line increased by the application of high-speed railway:
where n k (pair) is the quantities of passenger train running on the existing railway line before high-speed railway had come into application, t c (minute) is time span, I (minute) is tracking interval, Q z (ton) is average gross track capacity of one freight train, ε k is the deduction coefficient of passenger train, φ is average load coefficient on existing railway line, and K d is fluctuation coefficient of the freight transportation on existing railway line.
According to the above analysis, we can get hz (ton), the capacity of freight transportation on the existing railway line increased by the operation of high-speed railway:
where n x (pair) is the quantities of passenger train running on existing railway line after high-speed railway is put into operation and hz n x (ton) is the freight transportation capacity on the existing railway line when the quantity of passenger train running on the same railway line is n x after high-speed railway is put into operation.
The less carbon dioxide quantity jp hz (kilogram) contributed by high-speed railway emissions with its application because of freight increment substitution effect can be calculated as follows:
where ghzz (ton per car) is the average load capacity of truck, ghyh (liter per kilometer) is the average fuel consumption of truck, tzz (ton per car) is the average load capacity of the railway freight train, thgl (kilowatt) is the average power of the railway freight train, and thss (kilometer per hour) is the average speed of the freight train on existing railway line.
3.2.3. Carbon Emission during the Recovery Stage
During the recovery stage of high-speed railway, much carbon dioxide will be emitted through the use of construction machines which should consume much energy. But much carbon dioxide will be reduced because of the reuse of the construction materials. The more annual average quantity of carbon dioxide zp cc (kilogram) contributed by high-speed railway emissions to the environment than that of carbon dioxide contributed by highway emissions during the recovery stage can be calculated as follows:

where n tcgj (kind) is the kinds of main construction machines which will consume energy and be used during the recovery process of high-speed railway infrastructure, tcgj i (kilogram) is the carbon quantities emitted by the ith construction machine which will consume energy during the recovery process of high-speed railway infrastructure, n tchs (kind) is the kinds of main construction materials which can be reused during the recovery process of high-speed railway infrastructure, tchs i (kilogram) is the carbon dioxide quantity reduced by the construction materials which can be reused during the recovery process of high-speed railway infrastructure, n gcgj (kind) is the kinds of main construction machines which will consume energy and be used during the recovery process of highway infrastructure, gcgj i (kilogram) is the carbon quantities emitted by the ith construction machine which will consume energy during the recovery process of highway infrastructure, n gchs (kind) is the kinds of main construction materials which can be reused during the recovery process of highway infrastructure, and gchs i (kilogram) is the carbon quantity reduced by the construction materials which can be reused during the recovery process of highway infrastructure.
3.3. Carbon Dioxide Mitigation Quantity and Mitigation Benefit
There are lots of building materials and construction machines used during the construction and recovery stage of high-speed railway and highway, and the design service life of high-speed railway is different from that of highway, and the evaluation time period is very important to the evaluation conclusion. So this paper selects annual average carbon emission of high-speed railway as the accounting basis when comparing with that of highway.
The annual average carbon dioxide mitigation quantity in the whole life cycle of high-speed railway when comparing with that of highway jp (kilogram) can be calculated as follows:

According to the above formula, we can carefully analyze the carbon dioxide emission for high-speed railway and highway in their life cycle, find out the key stage of carbon dioxide emission, and then take corresponding measures to reduce their carbon dioxide emission.
According to the policy of carbon dioxide tax, the annual average carbon dioxide mitigation benefit of high-speed railway when comparing with that of highway bt (Euro) can be calculated as follows:

where ts (euro per ton) is the carbon tax per emission quantity of carbon dioxide.
4. Sample
In order to make the calculation process more understood, this paper takes a high-speed railway line which is 1300 kilometers long as an example to calculate the carbon dioxide mitigation benefit of high-speed railway when comparing with that of highway. Supposing that the length of the bridge and tunnel construction accounts for 80% of the gross length of the high-speed railway line, the annual average passenger turnover quantity is 171.68 billion persons and kilometers, the capacity of freight transportation increased though the operation of this high-speed railway is 9.16 million tons. The average seating capacity of the motor-car group is 732 persons, and the average occupancy rate of the motor-car group is 80%. Seventy percent of the passengers who will travel by road will travel by coaches, and others will travel by cars. The average seating capacity of the coach is 31 persons and that of the car is 3 persons. The fuel consumption of coach is 30 liters per hundred kilometers and that of car is 10 liter per hundred kilometers. The power of the CRH3 motor-car with the speed of 350 km/h is 8800 kilowatt. The power of the single locomotive with the load capacity of 5000 tons in our country is 7200 kilowatt, and the average speed of the freight trains on the existing railway line is 80 kilometer per hour. The fuel consumption of truck with the load capacity of 15 tons is between 18 and 25 liters per hundred kilometers, and the average carbon dioxide emission quantity is 2.71 kilogram per liter diesel. The average carbon dioxide emission quantity of power is 0.76 kilograms per kilowatt-hour in China. The land area of high-speed railway infrastructure is one-fourth of that highway when transporting the same quantity of passengers, and the average width of double line of railway is 40 meters including the drain, and the bridge and tunnel construction save 44 mu/km than embankment construction. Suppose that 50% of the saved land is used to plant tree and other is grass. Some documents show that forest is the absorber, warehouse and buffer of the carbon dioxide, and 1 square kilometer forest can absorb in 2745000 kilograms carbon dioxide and 1 square kilometer grassland can absorb in 1098000 kilograms carbon dioxide. It will, respectively, emit 0.8 tons and 2.786 tons carbon dioxide when producing one ton of cement and one ton of steel. The quantity of cement and steel used during the construction stage of high-speed railway infrastructure is, respectively, 12 million tons and 1320 million tons, and the quantities of cement used during the construction stage of highway infrastructure is 5000 ton per kilometer. The design service life of high-speed railway and highway are respectively 100 years and 25 years. The carbon dioxide emission quantity when produced the building materials which are used during the construction stage of transport infrastructure accounts for 80% of all the carbon dioxide emission quantity during the construction stage. With the technology innovation, the construction technology and recovery technology during the recovery stage of high-speed railway will have a substantial leap, so we do not consider the carbon dioxide emission quantities during its recovery stage 100 years later. The tax ratio of carbon tax is 7 euros per ton.
And then we can get calculated results, which are shown in Table 2.
Calculated results.
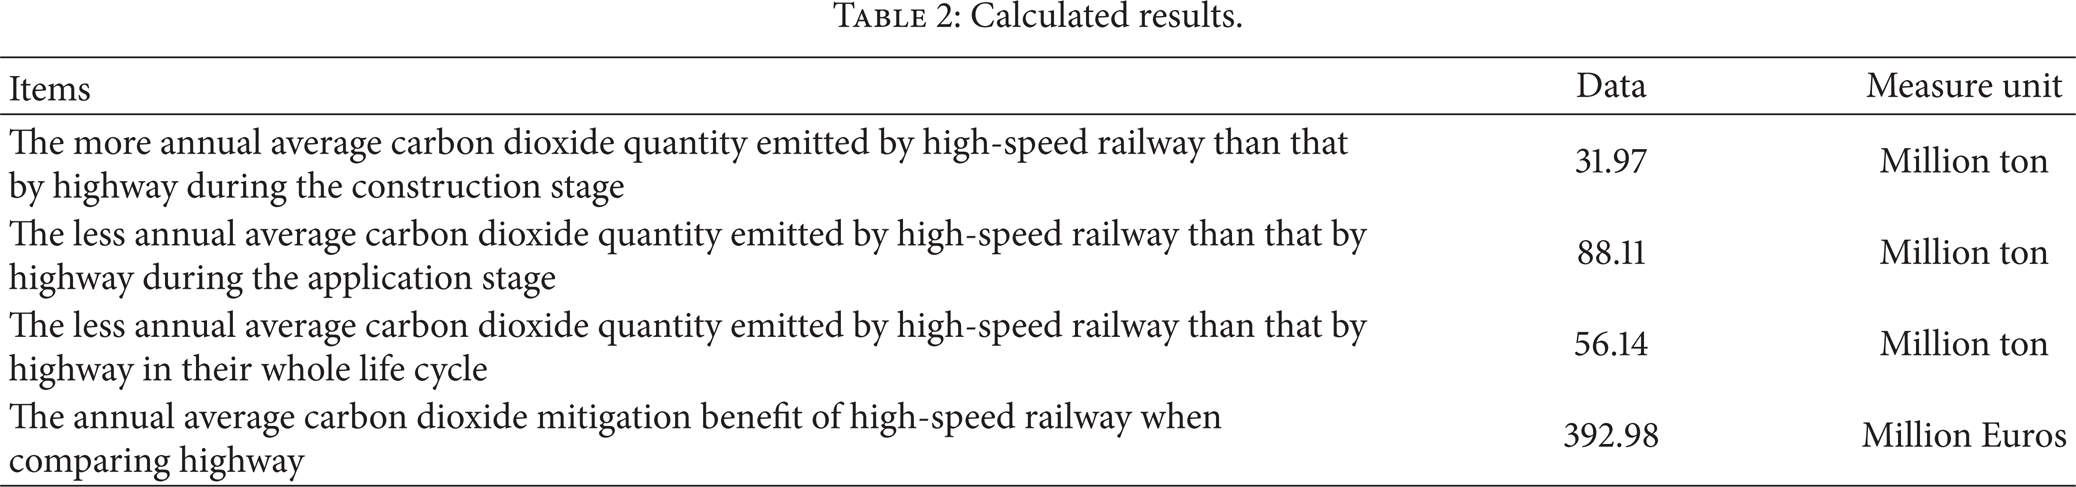
According to the above calculation results, we can find that, although high-speed railway emits more carbon dioxide during the construction stage of its infrastructure than highway, its annual average carbon emission quantity is lower than that of highway when the gross emission quantity is averaged to the design service life. This high-speed railway line can produce 392.98 million Euros mitigation benefit every year. And then high-speed railway have, the mitigation benefit when comparing with highway.
Because the carbon emission sources are different in those stages of high-speed railway, we can take different mitigation methods. The main mitigation methods during the construction stage include the following: to reduce the usage of the building materials which will emit much carbon dioxide in their production process, to improve the efficiency of construction machines and to reduce their energy consumption, to reduce building materials consumption. The main mitigation methods during the application stage include the following: to enhance the attendance of high-speed railway, to reduce the train-set weight; to reduce the locomotive vehicle operation energy consumption, and to improve energy use efficiency.
5. Conclusions
It is well known that high-speed railway may emit more greenhouse gas during its construction stage with the use of many high-energy-consumption building materials when comparing with highway and may emit less greenhouse gas during its application stage with technology and economic advantages such as low-energy-consumption, less-land-using, and freight increment substitution effect. But it is very complicated to exactly calculate the greenhouse gas emission quantity of high-speed railway, because it involves too many programs and data. This paper takes the typical carbon dioxide emission stages as an example to calculate the carbon dioxide emission quantity for high-speed railway and highway.
The numerical example shows that the carbon dioxide emission quantity of high-speed railway is more than that of highway during the construction stage of their infrastructure, but, because the design service life of high-speed railway is longer than that of highway, the annual average carbon dioxide emission quantity of high-speed railway is very low when the gross emission quantity is averaged to its design service life. At the same time, high-speed railway emits less carbon dioxide during the application stage than highway does. And then high-speed railway can bring lots of carbon dioxide mitigation benefits when comparing with road transport.
Footnotes
Acknowledgment
This work was supported by the Fundamental Research Funds of Central Universities (Grant no. 2011QNZT062).