
Abstract
Intelligent Transportation Systems (ITSs) aim at making the vehicle users be safer, comfortable, and better informed. Internet-enabled ITS applications get increasingly attractive recently. In this context, gateway is the portal of accessing the Internet. The efficiency of gateway management in ITSs thus profoundly affects the applicability of Internet-enabled applications. When the number of vehicles on the road greatly increased, the effectiveness of gateway requisition challenges the usage of the ITS services. To remedy the scalability problem in accessing the Internet in ITSs, an adaptive clustering scheme for gateway management is proposed in this paper. In the proposed scheme, the gateways are organized as a two-level cluster architecture. The gateways are dynamically employed according to the QoS requirements of the applications and current networking conditions. As shown in the simulation results, the proposed scheme is able to achieve the QoS requirements with fair gateway deployment cost.
1. Introduction
Intelligent Transportation Systems (ITSs) [1] focus on supplying transport services and traffic management. Advances of vehicular ad hoc network (VANET) technologies [2] make ITS services effectively accessible. Recently, Internet-enabled ITS applications become more and more appealing. A gateway is the gate to access the Internet in the context of ITSs. Internet access in VANETs is usually supplied by way of fixed gateways [3, 4] along the road. Oppositely, for super high mobility of the VANET users [2], mobile gateways [3–8] are introduced for stably connecting to the Internet for vehicle users. Therefore, the performance of gateway dispatching in ITSs significantly impacts the applicability of Internet-enabled applications. Especially, when the number of vehicles on the road remarkably increased, the efficiency of gateway requisition challenges the willingness of using the services.
To remedy the scalability problem of accessing the Internet in ITSs, a cloud-assisted adaptive gateway dispatching scheme is proposed in this paper. In this proposed scheme, the gateways are organized as a two-level cluster architecture. The gateways are employed dynamically according to the QoS requirements of the applications and current networking conditions. Briefly, in our design, four fixed gateways are uniformly deployed in the system in advance and sixteen mobile gateways are dynamically called up to increase network capacity for improving the QoS. The simulation results will show that the proposed scheme is able to achieve requested QoS requirements with less gateway deployment cost.
The rest of this paper is organized as follows. Background and related work is described in Section 2. Section 3 overviews the proposed scheme. The simulation results are discussed in Section 4. A brief conclusion is presented in Section 5.
2. Preliminary
ITSs [1] aim at making the vehicle users be better informed, safer, and smarter. ITSs applications [1] include emergency vehicle notification, automatic road enforcement, variable speed limits, collision avoidance, and dynamic traffic light sequence. VANET [2] is one of the most important enabling technologies for ITS. The special features of VANETs [2] include sufficient transmission power, powerful computation capability, huge scale, high and predictable mobility, partitioned network, and changing network topology and connectivity. Among others, due to typically large scale of the VANETs, the scalability [9] of proposals remarkably constrains the applicability of VANET applications.
Quite a few studies [9–11] investigate the scalability problem in MANETs/VANETs. Where, clustering schemes are suggested in the studies [12–14] for solving the scalability problems in VANETs. The authors [13, 14] also mention that the effectiveness of the selection of cluster head seriously affects the efficiency of VANET applications. Various cluster head selection methods are introduced in the studies [13–16]. In the studies [14–16], the geographical information (i.e., the location, moving direction, and moving speed, etc.) of the nodes is taken into consideration for choosing the cluster head. Oppositely, the study [13] chooses the node supporting broadest coverage as the cluster head. For vehicle to infrastructure (V2I) communications, the authors of [17–19] take the gateway as the cluster head for accessing the Internet.
A hybrid architecture integrating V2V (Vehicle to Vehicle) and V2I (Vehicle to Infrastructure) is proposed in [11] to solve the scalability problem in VANETs. The considerations of AP discovery, handoff management, and the settings of TTL are discussed in the study. In [20], a solution is proposed to access the Internet in MANET. Three methods for finding gateways, namely, reactive, proactive, and hybrid gateway discovery, are introduced and compared in this study. In [21], the packet delivery rate can be greatly improved by combining static node mechanism and mobile cluster approach. A static node is set up at the road junction to meet the high mobility and scalability requirements while mobile cluster is used for helping routing in VANETs. However, Internet access is not remarkably addressed. In [17], a position-based routing protocol, namely, MGRP (Mobile Gateway Routing Protocol), is proposed for routing in VANETs. However, the scalability problem is not considered in MGRP routing protocol. In [22], the vehicles are dynamically clustered according to various metrics. A mobile gateway management method is proposed in [22]. Also, the ways of discovery, selection, and handoff handling of the mobile gateways are described. The study [9] offers a survey of cluster schemes in MANETs. The mechanisms, evaluations, and pros-and-cons of related algorithms are addressed.
However, it is quite laborious to discover fitting gateways to obtain steady connection to the Internet resulting from high mobility and changing topology of the VANETs [2]. Cloud computing represents the new model for supplement, consumption, and delivery of information technology based on the Internet protocols. The powerful processing and storage capability can thus be used for complicated gateway management.
3. System Overview
3.1. Problem Statement
Quite a few issues have to be solved to make ITS applications satisfactorily accessible. Among them, the efficiency of Internet access challenges the quality of Internet-enabled services for vehicular users. Here, Gateway is recognized as the portal to the Internet. Thus, gateway management significantly affects the system performance and quality of services (QoS). Apparently, more gateways can supply more networking capacity and better QoS. Traditionally, fixed gateway is deployed with the roadside infrastructure. More gateways thus imply expensive infrastructure cost; that prohibitively hinder ubiquitous deployment of the fixed gateways. To remedy this problem, an adaptive cluster scheme is proposed in this paper to solve the scalability problem in ITSs. In the proposed scheme, mobile gateways are dynamically employed according to the QoS requirements of the applications and current networking conditions. That is, when the traffic load gets heavier and/or the vehicle's velocity becomes faster than the predetermined thresholds, in addition to fixed gateways, the proposed adaptive clustering scheme hires additional mobile gateways to supply sufficient networking capacity to satisfy requested QoS requirements. Oppositely, it dismisses superfluous mobile gateways to reduce the corresponding cost when the traffic load becomes light. The considerations of the QoS requirements and the settings of the thresholds will be addressed next.
3.2. System Model
The system model of the proposed scheme is depicted in Figure 1. In the system, a Gateway is the portal connecting to Internet directly via WiFi/WiMAX/cellular networks. The Stationary Gateways (SGs), being either the access points (APs) of WiFi/WiMAX or the base stations (BSs) of cellular networks, are deployed along the roadside. The serving coverage of a SG is called a Cell. For now, four SGs are uniformly furnished in the system. While the Mobile Gateways (MGs) are the vehicles on the road which are able to directly connect to the Internet. The serving coverage of a MG is called a Microcell (U Cell). In this paper, the MGs are engaged dynamically according to the networking conditions and the applications' QoS requirements. A Client Vehicle (CV) is the vehicle desiring to access the Internet. A CV can access the Internet either via direct connection or via a few Relay Vehicles (RV) to a Gateway. That is, in case that a CV is not currently located within the coverage of any Gateway, the CV then connects to the Internet via one or more vehicles relaying packets from/to a Gateway. A few cloud servers act as the Cluster Servers that are in charge of the clusters management and handling the mobility of the vehicles.

Two-level cluster architecture.
As will be displayed in the simulation results of Section 4.2, more gateways offer more networking capacity but unfortunately increased deployment cost. To obtain satisfactory QoS with affordable deployment cost, an adaptive cluster architecture is used in the proposed system. Initially, the system adopts Level-1 (L1) cluster architecture. That is, four fixed roadside APs/BSs are setup and act as the Stationary Gateways (SGs) to support Internet-enabled services. In this situation, a Client Vehicle (CV) connects to one of these four SGs to access the Internet, as depicted in Figure 2(a). When the networking capacity cannot meet the applications' QoS requirement, the Cluster Server then will upgrade the system to Level-2 (L2) cluster architecture by dynamically employing sixteen Mobile Gateways (MGs). In this case, a CV connects to one of these sixteen MGs for accessing the Internet, as depicted in Figure 2(b). After that, the Cluster Server is responsible of adaptively deciding the system architecture (i.e., L1 or L2) according to the QoS requirements and current networking condition.

(a) Level-1 cluster architecture and (b) Level-2 cluster architecture.
3.3. The Adaptive Clustering Scheme
According to the QoS requirements and current networking status, the adaptive clustering scheme proposed in this paper is able to dynamically adjust the cluster architecture. That is, to obtain the needed QoS requirements, when the traffic load gets heavy and/or vehicle's velocity gets fast, Level-2 cluster architecture will be adopted. Otherwise, Level-1 cluster architecture will be used. Specially, the communication range of the gateways (either SGs or MGs) will be adaptively shrunk to reduce the probability of traffic collisions and get better performance when the traffic load becomes super high. Thus, the settings of the thresholds triggering the cluster architecture adjustment significantly affect the system performance. Next, the basis of selecting these thresholds will be described. Related parameters used in the following discussion are collected in Table 1.
Parameter definition.

Currently, in this paper, three QoS requirements (denoted as QoS
i
,
(1) (2) (3) set Level-1 Cluster (4) (5) (6) set Level-1 Cluster (7) (8) set Level-2 Cluster (9) (10) (11) set Level-2 Cluster (12) (13) set Level-2 Cluster (14) (15) set communication range as 250 (16) (17) set communication range as 200 (18) (20) set communication range as 150 (21) (22) set communication range as 100 (23) (24) (25)
To properly set these thresholds, a series of simulations are carried out in this paper. Details of these experiments will be described in Section 4.3. Also, you can find the settings of these thresholds for various QoS requirements are summarized in Tables 3, 4, 5, 6, and 7, respectively.
3.4. Cluster Management
The adaptive clustering scheme proposed in this paper will adjust the cluster architecture dynamically when the vehicles move either into or out of the service coverage of a gateway. When a vehicle moves into a gateway's coverage, the cluster server will check if the cluster architecture should be upgraded to Level-2 to provide sufficient networking capacity. Oppositely, a vehicle moves out of a gateway's coverage, the cluster server will check if the cluster architecture could be downgraded to Level-1 cluster architecture. Related operation of a vehicle joins or leaves a cluster are presented in Figures 3(a) and 3(b), respectively.

(a) Joining a cluster and (b) leaving a cluster.
3.4.1. Related Tables
Three tables, namely, the Client Table, the Vehicle Table, and the Gateway Table, used above, are introduced here. Each gateway maintains a Client Table maintaining related information (i.e., vehicle ID, location, velocity, and moving direction) of the client vehicles currently located within its coverage. And the cluster server maintains a Vehicle Table maintaining related information (i.e., vehicle ID, location, velocity, moving direction, cluster ID, and cluster level) of all client vehicles in the system. Also, the cluster server maintains a Gateway Table maintaining related information (i.e., gateway ID, location, velocity, moving direction, cluster ID, cluster level, and transmission range) of the gateways previously registered in the system.
4. Simulations
To systematically evaluate the performance of the proposed scheme, a series of simulations are presented hereinafter.
4.1. Test Bed
The simulations of this paper are implemented in NS2. Total simulation time is 300 seconds. In the following simulations, the assumed network size is a 1000 m*1000 m. As shown in Figure 4, the road type is two-way street with 49 intersections. Proper number (i.e., 0, 4, or 16) of WLAN APs is set up in the assumed area. 100 vehicles are randomly deployed in the assumed network. Some of these vehicles are employed as mobile Gateways on the road. The speed of these vehicles is assumed to be 20, 30, 40, 50, 60, and 70 Km/Hr; the acceleration of these vehicles is assumed to be ±1 m/s2. The transmission range of a node is 100, 150, 200, and 250 m. IEEE 802.11b is used as the MAC layer protocol; whose bandwidth is 2 Mbps. The transmission type is CBR (Constant Bit Rate), whose transmission rate is 512 Kbps. The interval of sending packet is 0.5 s. In this paper, the traffic load depends on the number of vehicles participated in the packet transmission. For now, the performance is investigated with various traffic loads (i.e., 20%, 40%, 60%, and 80%). The routing protocols including MGPR [17] and AODV+ [20] are studied and compared with the proposed scheme. In the following simulations, Manhattan mobility model [23] is used. The settings of the parameters are collected in Table 2.
Parameter settings.

QoS85.

QoS90.

QoS95.

Thresholds setting.

Super high traffic load (80%).


Assumed topology.
Next, the metrics considered in the simulations are introduced. Firstly, the Packet delivery rate, as expressed in (1), is the rate of successfully delivered packets sent from the source node to the destination node. The source node here is the client vehicle while the destination node means the gateway (either roadside AP or mobile Gateway on the road.)

Secondly, the End-to-end delay, as expressed in (2), is the average end-to-end delay of all successfully delivered data packets sent from the source node to the destination node. 
Thirdly, the Signaling load, as expressed in (3), is the average number of control messages needed to deliver a data packet. 
Fourthly, to quantify the cost-effectiveness of deploying APs, a new metric, namely, the rewarding index, is coined in this paper. Rewarding index, as expressed in expression (4), is the gains of packet delivery rate for a deployed AP. 
4.2. Cost Effectiveness of AP Deployment
Given the number of deployed APs (i.e., 4 APs in Figure 5(a) or 16 APS in Figure 5(b)), the signaling overhead increases with either increased vehicle velocity and/or increased traffic load. Generally, a route is prone to break when the vehicle's velocity increases. Consequently, the signaling overhead yielded by rerouting thence significantly increase. Also, the number of affordable connections in wireless communications is constrained for limited network capacity. Therefore, when the traffic load increases, the success rate of getting related networking resources is correspondingly reduced. As a result, the signaling overhead caused by re-routing remarkably increases as the traffic load increases.

Signaling overhead of various AP deployment.
Additionally, Figures 6(a), 6(b), and 6(c) display that, given the traffic load (i.e., 20, 40, 60 sessions), the signaling overhead increases with increased vehicle velocity. Also, apparently, the signaling overhead of 4 APs is larger than that of the 16 APs. Naturally, 16 APs offer larger coverage than 4 APs. Therefore, with 16 APs, the nodes have higher probability of staying in the communication range of a certain AP and connect to the AP directly. Oppositely, with 4 APs, the nodes need to connect to the AP by multi-hops; that yields more signaling overhead. However, when the traffic load gets super high (i.e., 80 sessions), as shown in Figure 6(d), the signaling overhead seems unstable. When the traffic load becomes super high and the velocity gets fast, the signaling overhead of 16 APs is larger than that of the 4 APs for extra signaling overhead caused by possible traffic collision in the overlapped communication coverage of APs. This result thus motivates the design in the proposed scheme for adjusting communication range of the APs by power control.

Signaling overhead of AP deployment.
The rewarding index of 4 APs is much higher than that of 16 APs for various vehicle velocity and various traffic load, as shown in Figures 7(a) and 7(b).
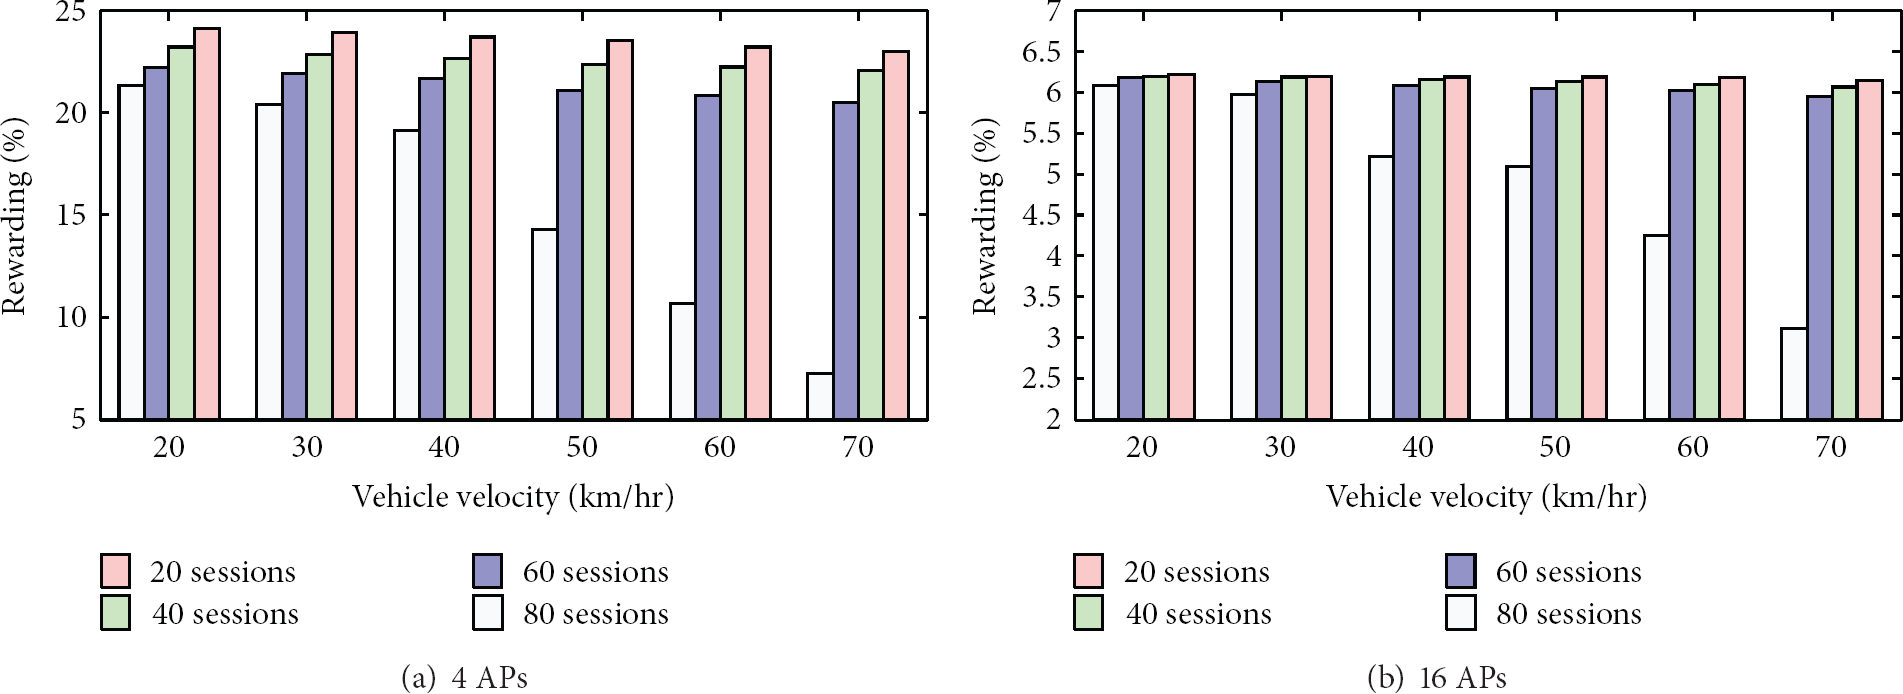
Rewarding index of APs deployment.
Discussions. More APs are able to supply more networking capacity but more deployment cost. As suggested in the simulation results, 4 APs presents higher rewarding index than that of 16 APs. Thus, in the proposed scheme, 16 mobile gateways will be dynamically hired in case that 4 APs deployment cannot sufficiently meet the QoS requirements.
4.3. Selecting the Thresholds
To properly set the thresholds used in the proposed Adaptive Clustering Scheme (in Algorithm 1), related simulations are carried out. The effects of a few factors including the traffic load, the velocity of vehicles, and the communication range of the nodes are studied. Four APs and one hundred vehicles (including 16 mobile Gateways) are set up. Four traffic loads, namely, 20%, 40%, 60%, and 80%, are considered in the following simulations.
4.3.1. The Effects of Traffic Load and Vehicle Velocity
In this experiment, the transmission range is 250 m. For both Level-1 (in Figure 8(a)) and Level-2 (in Figure 8(b)) cluster architecture, the packet delivery rate decreases as either the traffic load increases or the vehicle's velocity increases. Because the success rate of obtaining the needed networking resource reduces when the competing traffic load increases; that results in decreased packet delivery rate. Also, the increased vehicle's velocity makes the topologies highly changing, which results in frequent broken connections and low packet delivery rate.

Two cluster architectures.
When the traffic load is not seriously heavy (i.e., depicted in Figures 9(a), 9(b), and 9(c) for 20%, 40%, and 60%, resp.), Level-2 cluster architecture generates higher packet delivery rate than that of Level-1 cluster architecture. In particular, as shown in Figure 9(d), when the velocity is faster than 40 km/hr and the traffic load becomes super high (i.e., 80%), the packet delivery rate of Level-2 drops dramatically. The possible reason of this result is that the broadly overlapped communication range of the nodes possibly cause lots of collisions and worsen the packet delivery rate. The effects of communication range of the nodes will be investigated later.

Various traffic load.
4.3.2. The Effects of Communication Range
When the traffic load is not seriously heavy (shown in Figures 10(a), 10(b), and 10(c) for 20%, 40%, and 60%, resp.), longer communication range presents higher packet delivery rate. Because longer communication range needs less hops before the data packets arrives at the destination node. Generally, more hops imply higher probability of broken connections in MANETs/VANETs; that results in lower packet delivery rate. Particularly, when the traffic load becomes super high (i.e., 80% in Figure 10(d)), longer communication range yields broadly overlapped communication coverage and serious data traffic collisions. Consequently, the packet delivery rate of longer communication range drops significantly for super high traffic load. This result inspires the design of adaptively adjusting the communication range in the proposed scheme according to the traffic load and the vehicle velocity.

Various communication range and traffic load.
4.3.3. Setting the Thresholds
These investigations presented above are digested in the following tables. As suggested in Table 3, to achieve QoS85, R is set as 250 m, when traffic load (denoted as S) is higher than 60% and vehicle's velocity (denoted as V) is faster than 40 km/hr, the cluster architecture should be upgraded to Level-2. Thus,
Specially, when the traffic load gets super high (i.e., 80%), the cluster architecture will be upgraded to Level-2. Also, in Table 7, according to the vehicle's velocity, the communication range will be limited for reducing traffic collisions and achieving the needed QoS requirements. In this context, with communication range r, two velocity thresholds
4.4. The Adaptability for Various QoS Requirements
To check the adaptability of the proposed scheme for various QoS requirements (i.e., 85%, 90%, and 95% packet delivery rate), related experiments are described as follows. One hundred vehicles (including 16 mobile Gateways) are setup on the road. Proper number of fixed APs and mobile Gateways are employed in various scenarios. Four transmission range including 100, 150, 200, and 250 m are considered. Four traffic loads, namely, 20%, 40%, 60%, and 80%, are built in the following simulations.
4.4.1. QoS Requirement 85%
For QoS85, as mentioned in Table 6, when the traffic load is less than 60% and the vehicle velocity is below 40 km/hr, the proposed scheme adopts Level-1 cluster architecture (i.e., 4 fixed APs). Or else, it uses Level-2 cluster architecture (i.e., additional 16 mobile gateways). As depicted in Figures 11(a), 11(b), and 11(c), the packet delivery rate of Level-2 is higher than that of Level-1 for various vehicles' velocity and different traffic load. Also, as depicted in Figures 12(a), 12(b), and 12(c), the end-to-end delay of Level-2 is shorter than that of Level-1 for various vehicles' velocity and different traffic load. Besides, as depicted in Figures 13(a), 13(b), and 13(c), the signaling overhead of Level-2 is less than that of Level-1 for various vehicles' velocity and different traffic load. The proposed scheme is able to dynamically upgrade/downgrade to Level-2/Level-1 to achieve the QoS requirement with less deployment cost.

Packet delivery rate of QoS85.

End-to-end delay of QoS85.

Signaling overhead of QoS85.
4.4.2. QoS Requirement 90%
For QoS90, as mentioned in Table 6, when the traffic load is less than 40% and the vehicle velocity is below 40 km/hr, the proposed scheme adopts Level-1 cluster architecture (i.e., 4 fixed APs). Or else, it uses Level-2 cluster architecture (i.e., additional 16 mobile gateways). As depicted in Figures 14(a), 14(b), and 14(c), the packet delivery rate of Level-2 is higher than that of Level-1 for various vehicles' velocity and different traffic load. Also, as depicted in Figures 15(a), 15(b), and 15(c), the end-to-end delay of Level-2 is shorter than that of Level-1 for various vehicles' velocity and different traffic load. Besides, as depicted in Figures 16(a), 16(b), and 16(c), the signaling overhead of Level-2 is less than that of Level-1 for various vehicles' velocity and different traffic load. The proposed scheme is able to dynamically upgrade/downgrade to Level-2/Level-1 to achieve the QoS requirement with reduced deployment cost.
Packet delivery rate of QoS90.
End-to-end delay of QoS90.

Signaling overhead of QoS90.
4.4.3. QoS Requirement 95%
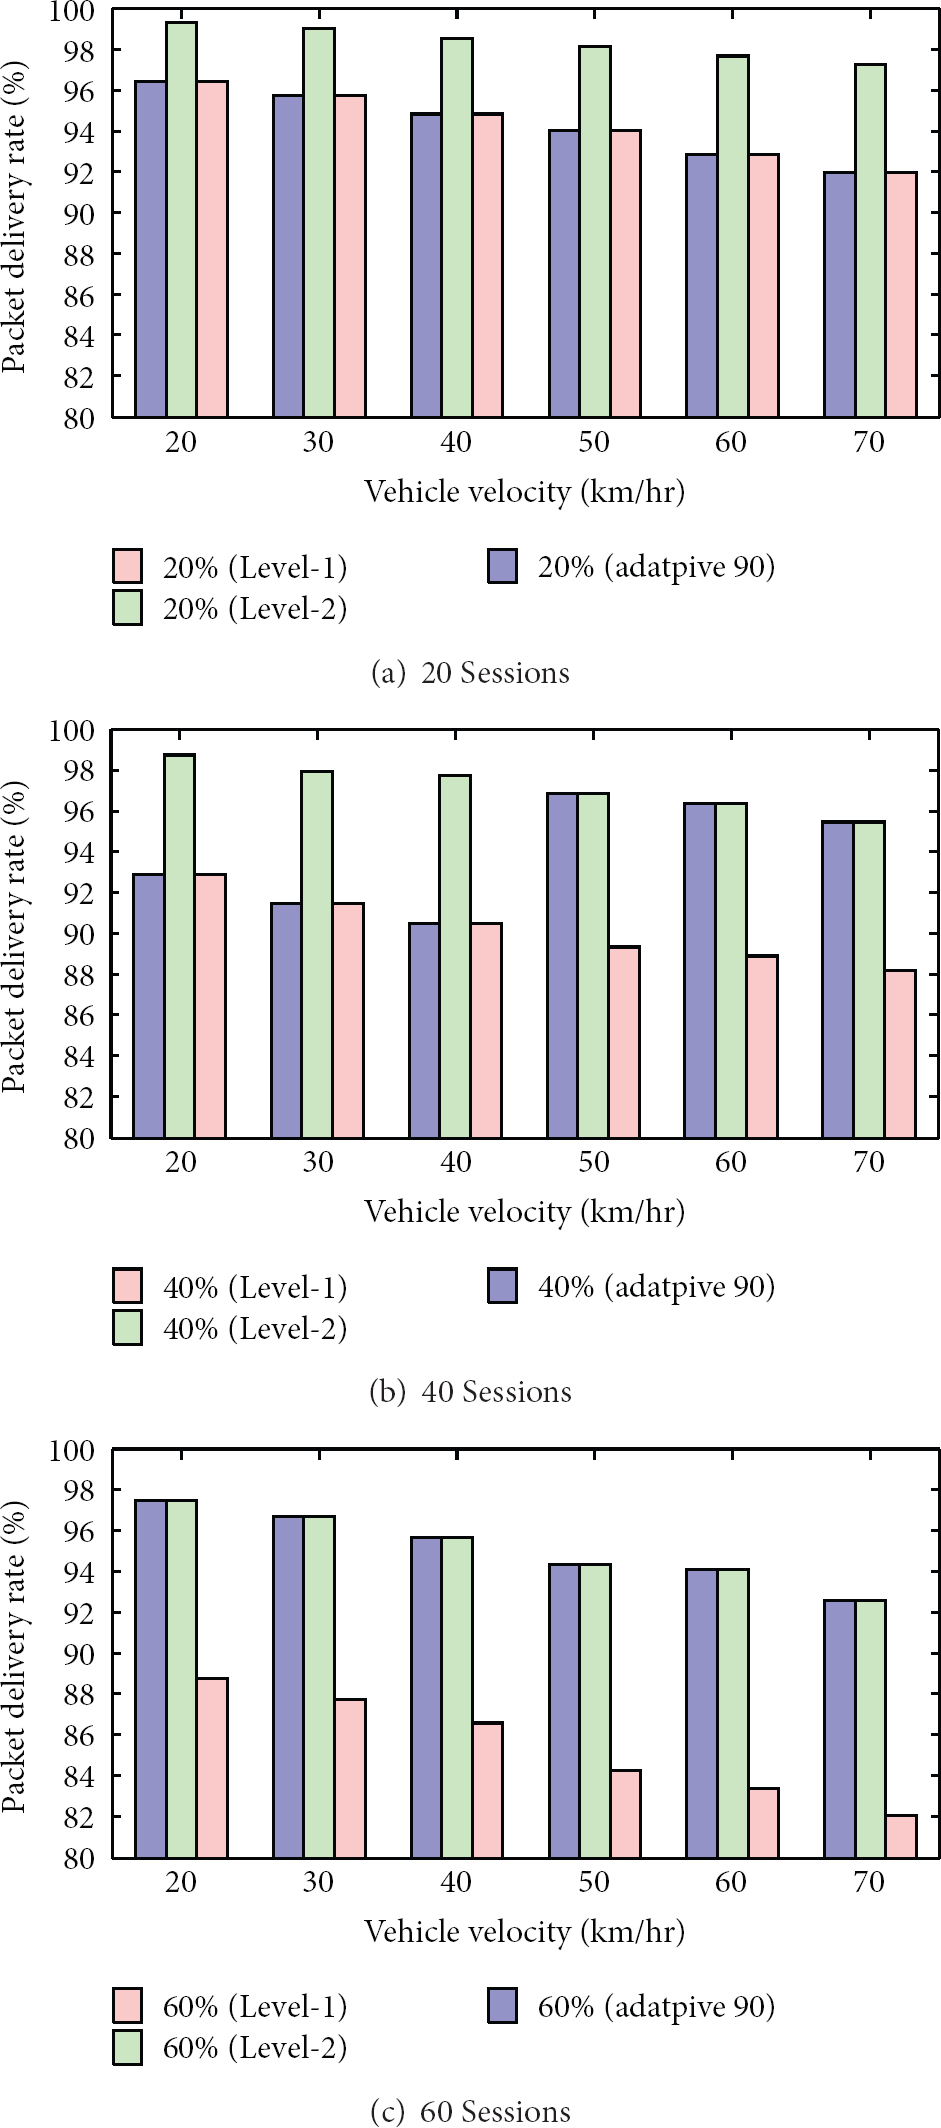
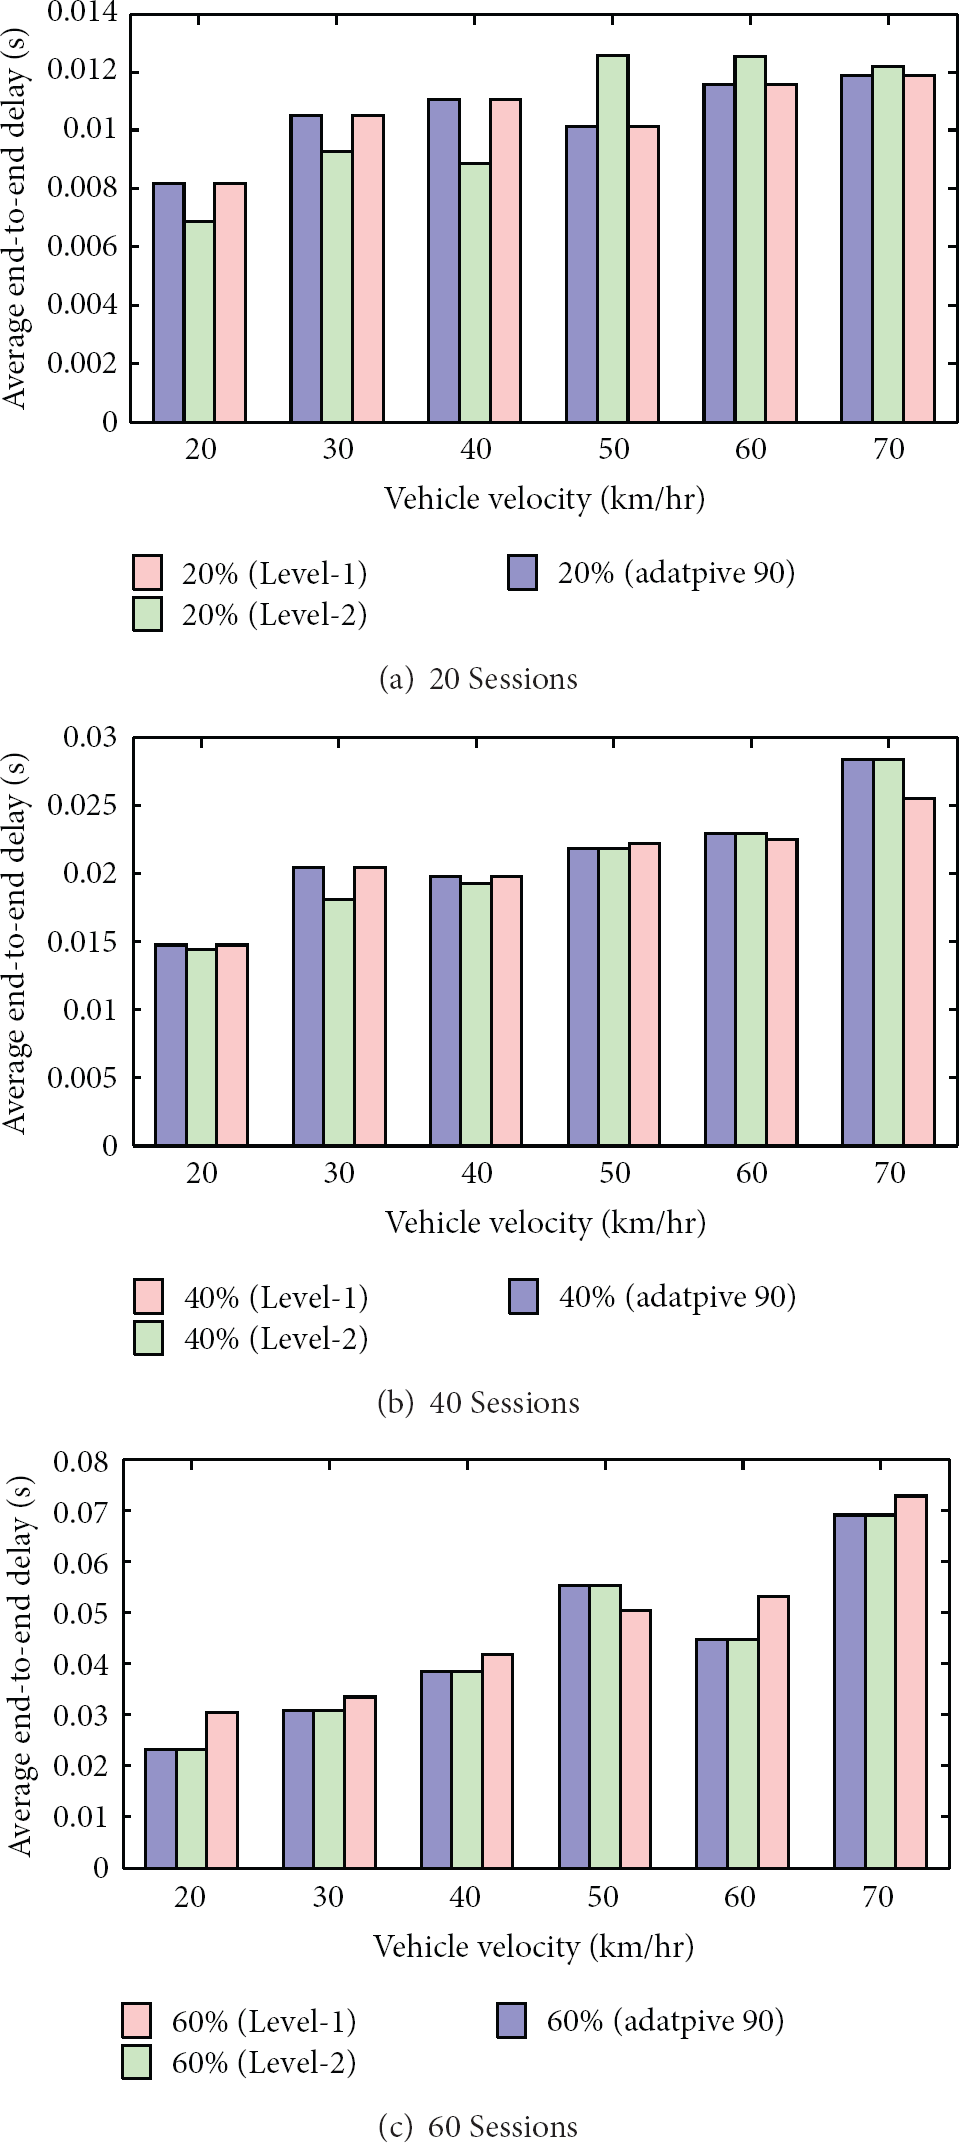
For QoS95, as mentioned in Table 6, when the traffic load is less than 20% and the vehicle velocity is below 30 km/hr, the proposed scheme adopts Level-1 cluster architecture (i.e., 4 fixed APs). Or else, it uses Level-2 cluster architecture (i.e., additional 16 mobile gateways). As depicted in Figures 17(a), 17(b), and 17(c), the packet delivery rate of Level-2 is higher than that of Level-1 for various vehicles' velocity and different traffic load. Also, as depicted in Figures 18(a), 18(b), and 18(c), the end-to-end delay of Level-2 is shorter than that of Level-1 for various vehicles' velocity and different traffic load. Besides, as depicted in Figures 19(a), 19(b), and 19(c), the signaling overhead of Level-2 is less than that of Level-1 for various vehicles' velocity and different traffic load. The proposed scheme is able to dynamically upgrade/downgrade to Level-2/Level-1 to achieve the QoS requirement with decreased deployment cost.

Packet delivery rate of QoS95.

End-to-end delay of QoS95.
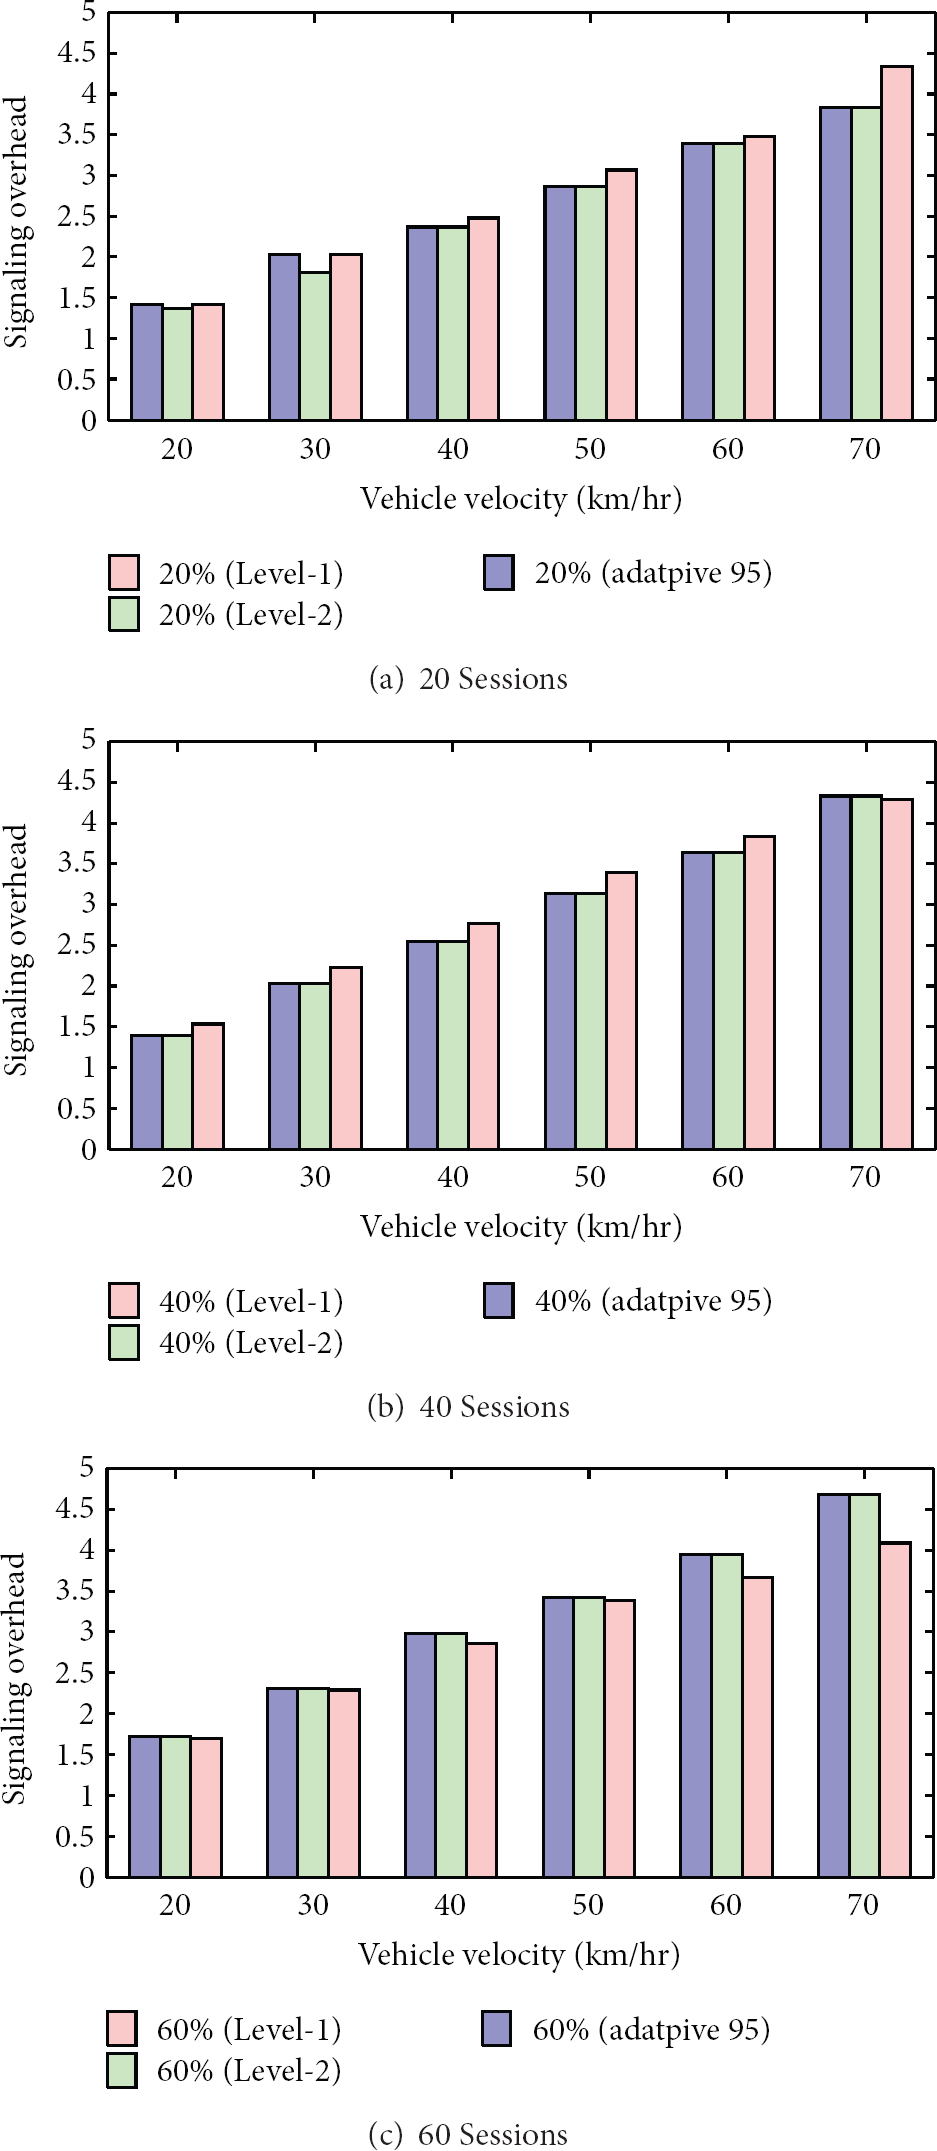
Signaling overhead of QoS95.
4.4.4. Discussion
The proposed scheme adopts Level-1 cluster architecture when both the traffic load and the vehicle velocity are below the predetermined thresholds. If not, it employs Level-2 cluster architecture. The proposed scheme is able to dynamically upgrade/downgrade to Level-2/Level-1 cluster architecture to achieve the QoS requirements with less deployment cost.
4.5. Comparing Different Methods
The performance of two well-known routing protocols, including MGRP [17] and AODV+ [20] are compared with the proposed scheme. In particular, without losing the fairness, 16 fixed APs are deployed for AODV+ while 16 mobile gateways are deployed for MGRP. It means that the AODV+ needs more deployment cost. And, the mobility of gateways in MGRP results in unstable connections that yields low packet delivery rate, long end-to-end delay, and heavy signaling overhead. As summarized in Table 6, when both the traffic load and the vehicle's speed is below the predecided thresholds, the proposed scheme will adopt Level-1 cluster architecture. Otherwise, it will use Level-2 cluster architecture. The proposed scheme will dynamically upgrade/downgrade to Level-2/Level-1 to achieve the QoS requirements with minimum deployment cost.
The QoS requirement is set as 95% in the following simulations. Given the light traffic load (i.e., 20 sessions), when the vehicle's speed is low (i.e., below 40 km/hr), the proposed scheme adopts Level-1 and thus generates lowest packet delivery rate (in Figure 20(a)) and longest end-to-end delay (in Figure 21(a)). Oppositely, when the vehicle's speed gets faster (i.e., above 40 km/hr) or the traffic load becomes heavier (i.e., 40 and 60 sessions), the proposed scheme adopts Level-2. The performance of the proposed scheme, including packet delivery rate (in Figures 20(b), 20(c), and 20(d)), the end-to-end delay (in Figures 21(b), 21(c), and 21(d)), and the signaling overhead (in Figures 22(b), 22(c), and 22(d)), fall between those of the ADOV+ and MGRP. In particular, given super high traffic load (i.e., 80 sessions), the performance of the proposed scheme, including packet delivery rate (in Figure 20(d)), the end-to-end delay (in Figure 21(d)), and the signaling overhead (in Figure 22(d)), approximates that of the AODV+.
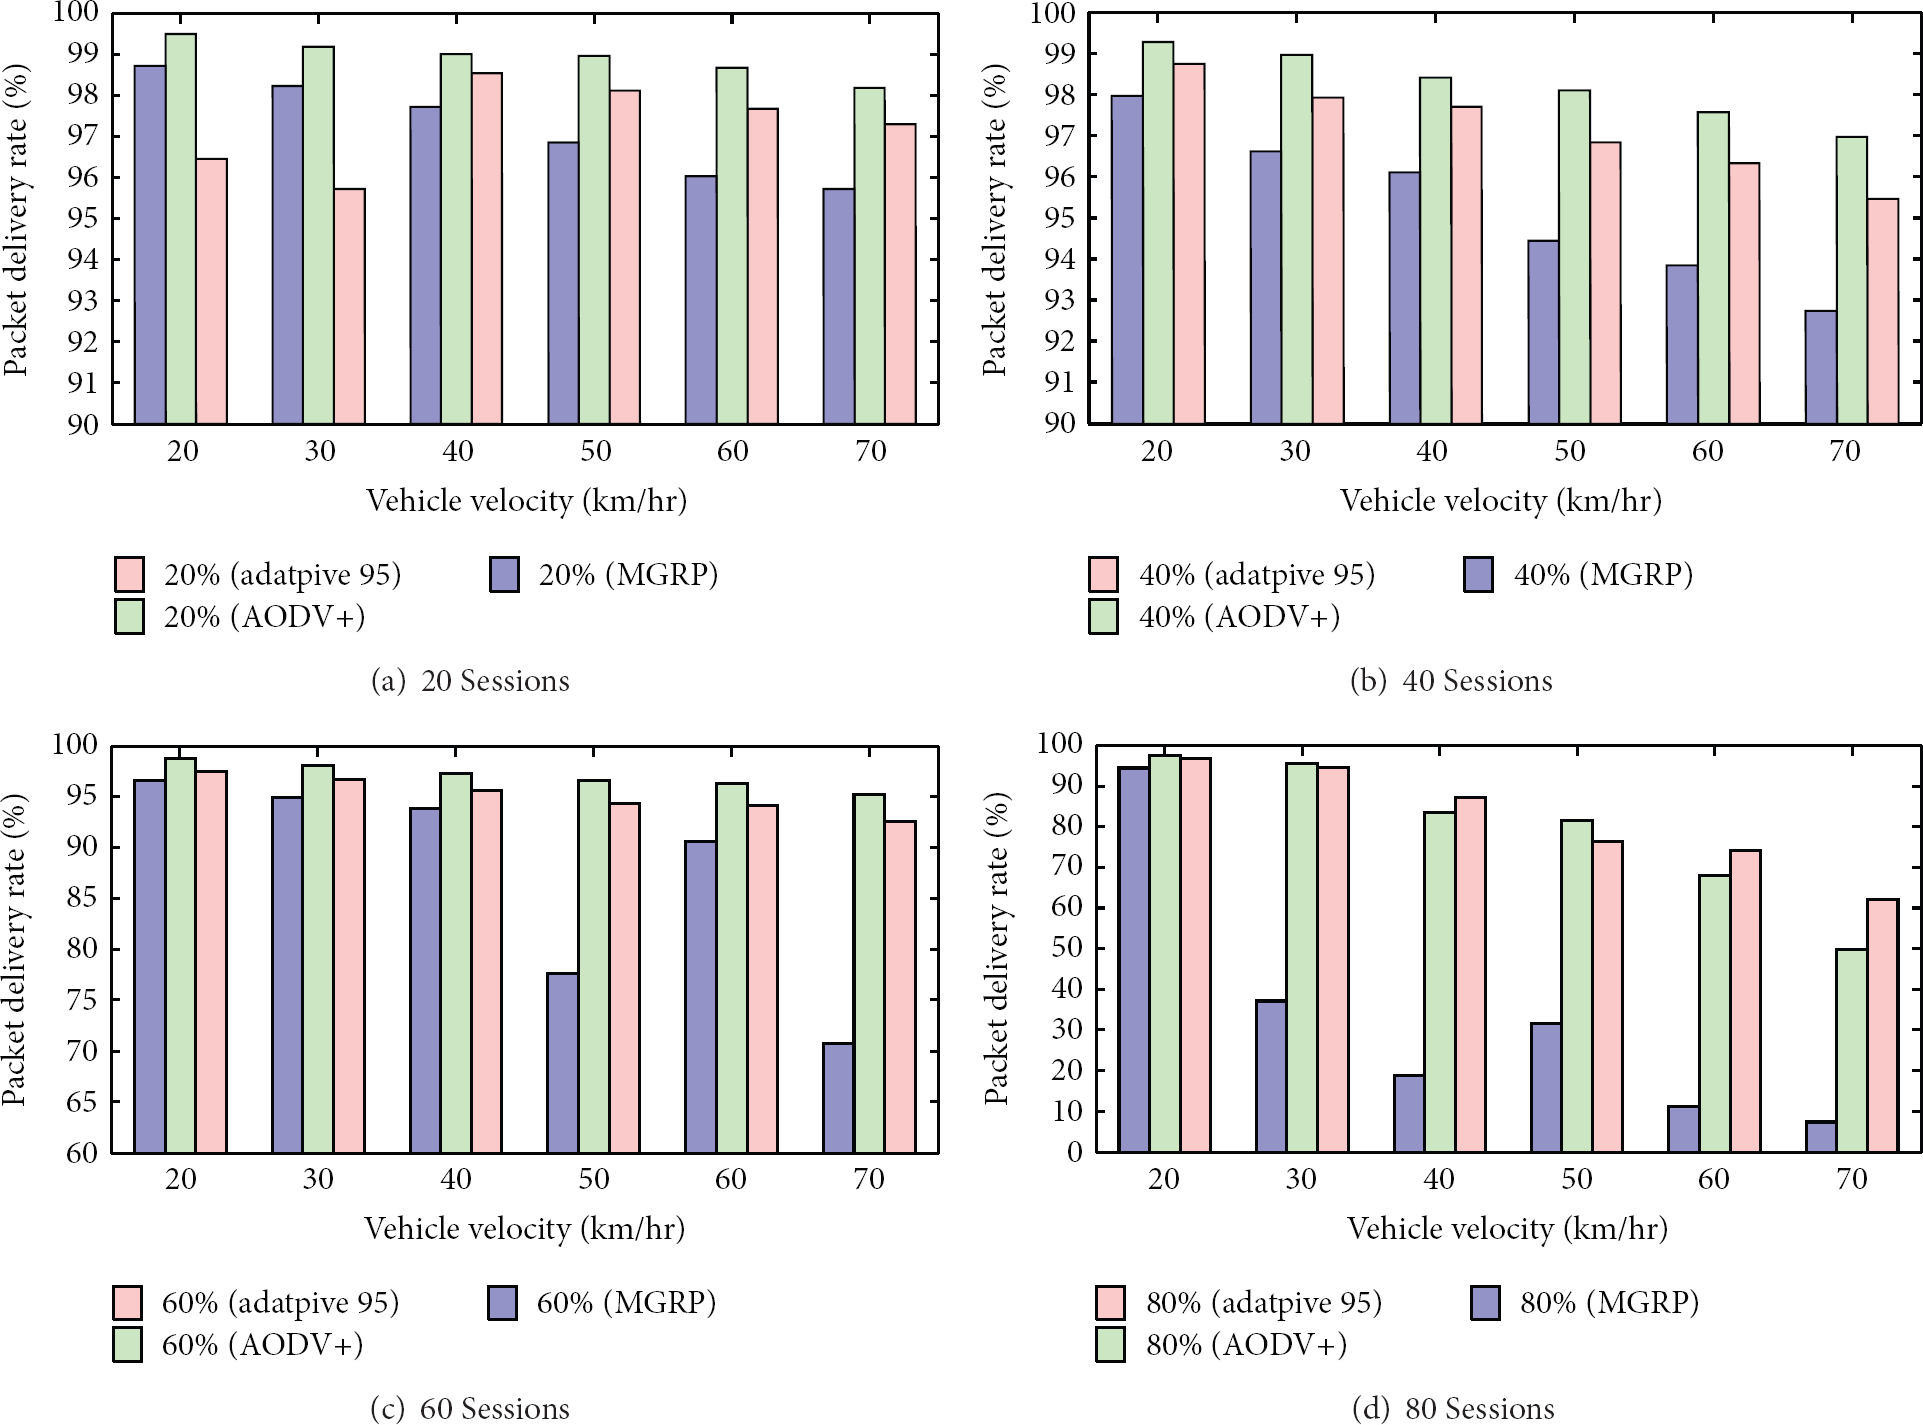
Packet delivery rate of different methods.

End-to-end delay of different methods.

Signaling overhead of different methods.
Summary. These results imply that the proposed scheme can achieve the QoS requirements with lower deployment cost.
5. Conclusions
In this paper, a cloud-assisted adaptive gateway dispatching scheme is proposed to solve the scalability problem of accessing the Internet in ITSs. With the proposed scheme, the gateways are dynamically used according to the applications' QoS requirements and current networking conditions. Four stationary gateways are initially deployed in the system in advance, while sixteen mobile gateways are dynamically employed to increase network capacity to improve QoS. As displayed in the simulation results, the adaptive clustering scheme proposed in this paper is capable of meeting the QoS requirements of the applications with fair gateway deployment cost.
Footnotes
Acknowledgment
This work was supported in part of by the R.O.C. National Science Council under Grants no. NSC 99-2221-E-142-006, NSC 100-2221-E-142-006, NSC 101-2221-E-142-006, and NSC 102-2221-E-142-007.