
Abstract
An experimental system was designed and completed to realize the visualization of erythrocyte suspension microscale flow in microchannel and obtain the geometric parameters. The numerical simulation of the flow in the microchannel was accomplished to obtain the distribution of the physical parameters. Combined with the experimental data, the fitted curves of the physical parameters and geometric parameters on the axis were achieved. By analyzing the energy balance of the erythrocyte, the curve of the elasticity modulus of the erythrocyte membrane was obtained. The mechanism of the hemolysis caused by collision was expounded. Besides, the comparison among different cases was completed, illustrating the influence of the flow rate on hemolysis. The result shows that the predominant force of longitudinal compression is the pressure difference per erythrocyte. The curve of the elasticity modulus indicates that the membrane elasticity rapidly decreases as the erythrocyte approaches to the wall. The erythrocyte membrane loses elasticity, indicating that the contractile protein is fragile to the compressive loading, which increases significantly with a higher flow rate, making the erythrocyte membrane more likely to fracture.
1. Introduction
Angiocardiopathy is a severe disease having the highest death rate throughout the world, which threatens the patients severely. The treatment effect on patients with surgeries or pharmaceuticals is unsatisfactory and there are several prominent problems in organ transplantation. Medical workers expect to realize the cardiac function with the mechanical blood pump. The mechanical blood pump now can better serve as the heart with the smaller size and less adverse impact. However, there still exists some problems unsolved, such as the blood tissue damage composed of thrombus and hemolysis [1, 2]. When blood flows through blade passages in high speed, part of the erythrocyte flows separated from the channel, striking the blade and leading to hemolysis. The precipitation and aggregation of platelets on the blood contact surface are thrombus. The performance of restraining thrombus and hemolysis is the measurement of great importance of blood pumps. During the recent years, many researches were carried out for a better understanding of blood damages. Lampert and Williams [3] carried on the research on the effect of the surfaces of metal and plastic on hemolysis caused by shear stress and reported the affinity between the material's surface energy and its effect on hemolysis. Miller et al. [4] conducted the research on the influence of temperature on hemolysis and reported that the erythrocyte in the lower temperature has larger hemolysis ratio as the result of the brittleness through the inducing hemolysis in 0°C and 30°C. Giersiepen et al. [5] developed a calculation model on the hemolysis estimation based on the experimental research of Wurzinger et al. [6], suggesting the influence of the shear force and the exposure duration on hemolysis. Based on this model, Kido et al. [7], Yano et al. [8], and Apel et al. [9] estimated the hemolysis parameters and evaluated the level of blood damage with different blood pumps, respectively. Zhu et al. [10] obtained the index of the designed magnetic suspension blood pump by calculation and suggested that the Reynolds number is the main cause of hemolysis. Moreover, Paul et al. [11] found that the estimated damage level with this model was higher than that in fact, and presented the correction coefficient. Based on the DeBakey Blood Pump, Mizuguchi et al. [12] conducted the research on the influence on hemolysis index of the shape of the blade tip, the gap between the impeller and the stator, the radial gap between the blade and the pump shell, and the number of the blades. Apel et al. [13] found that the hemolysis in the blood pump is mainly caused by the shear stress and the loading time. Kim et al. [14] employed the erythrocyte exposed to the high magnetic field and found that the magnetic field leads to the change of the protein structure by the thermotropy. Burgreen et al. [15] designed a new-style blood pump with the optimized blade and conducted the research on the hemolysis caused by the shear force employing the digitized blood damage model. Besides, Lavalle et al. [16] conducted the experimental research on the adhesion characteristics between the erythrocyte and solid material and provided the adhesion model of erythrocyte. Jovtchev et al. [17] conducted the research on the erythrocyte aggregation based on the electrical characteristics and mechanical characteristics of the erythrocyte and studied the influence on the erythrocyte aggregation of the electric polarity and mechanical characteristics. Kaestner [18] developed the photodynamic model of erythrocyte with the photodynamic method and conducted the research on the mechanical property of the erythrocyte model.
However, the presented researches mainly focus on the hemolysis caused by shear stress, ignoring the influence of the collision in high speed. The visualization of the micro-scale flow of erythrocyte suspension in microchannel is now realized in this paper, and the geometric parameters of erythrocyte are obtained. The numerical simulation of the flow is accomplished, acquiring the physical parameters in a microchannel. Combined with the experimental data, the fitted curves of the physical parameters and geometric parameters are also achieved. By analyzing the energy balance of the erythrocyte, the curve of the elasticity modulus of the erythrocyte membrane is also obtained. The mechanism of the hemolysis caused by collision was expounded. Besides, a comparison among the different cases is completed, illustrating the influence of the flow rate. The flow velocity of the erythrocyte suspension in this paper, at m/s, is distinctly higher than that of other current similar researches, at cm/s or mm/s.
2. Erythrocyte High-Speed Collision Visual Experiment
2.1. Experiment System
As shown in Figure 1, the visual erythrocyte high-speed collision experiment system consists of the flow control system, the observation system, and the image acquisition system. The flow images were observed by the optical microscope and obtained with the high speed camera then output with the computer. The microchannel in millimeter processed by photoetching was selected to be the flow channel, and the material is PDMS (Polydimethylsiloxane). Figure 2 shows the planform and three-dimensional view of the microchannel, where the X direction is along the centerline, and the microchannel wall is chosen to be the original point (X = 0 μm). The microchannel has a constant depth (50 μm). Erythrocyte suspension flows into the microchannel from inlet 1 and out from outlets 2 and 3. The wall of the microchannel stands for the relative flat surface in pumps, such as the pump body and case. The flow is driven by the microsyringe pump and hypodermic syringe. The flow rate is adjusted to satisfy different cases, as shown in Table 1. The relative pure erythrocyte was acquired with centrifuging and filtering, and the sterile centrifuge tube needs to be cleaned with PBS (phosphate buffer saline) to remove the impurities. The experiment was performed in the room temperature. This experimental system realizes the visualization of the movement and collision of the erythrocyte in microchannel, providing the experimental data for the further study. Furthermore, the experimental procedures are shown in Figure 3.
Inlet velocities and flow rates of different cases.


Sketch of the experiment system.

The experiment microchannel (mm).

Experimental procedures.
2.2. Experiment Result and Analysis
The original flow images, as shown in Figure 4(a), require to be optimized because of the great background noise, high flow velocity, and frame rate. Figure 4(b) shows the processed images improved with a program code using Matlab, which have the relative higher sharpness and clearer boundary, and the morphological characteristics of erythrocyte are more easily to obtain.

Original and processed flow images.
The geometric parameters (length, width, and elongation) of the erythrocyte at different positions were achieved based on the processed images. As shown in Figure 5, the fitted curves of the geometric parameters were gained combined with the experimental data. The elongation (L/W, L, and W are the length and width of erythrocyte in the flow direction, resp.) decreases as the erythrocyte moves towards the wall, from 2.0 at X = 80 μm to 0.8 near the collision wall, expressing that the shape of erythrocyte has obviously changed. Moreover, the width increases and the length reduces continuously, suggesting that erythrocyte gradually develops into tabular shape from the initial slender one.
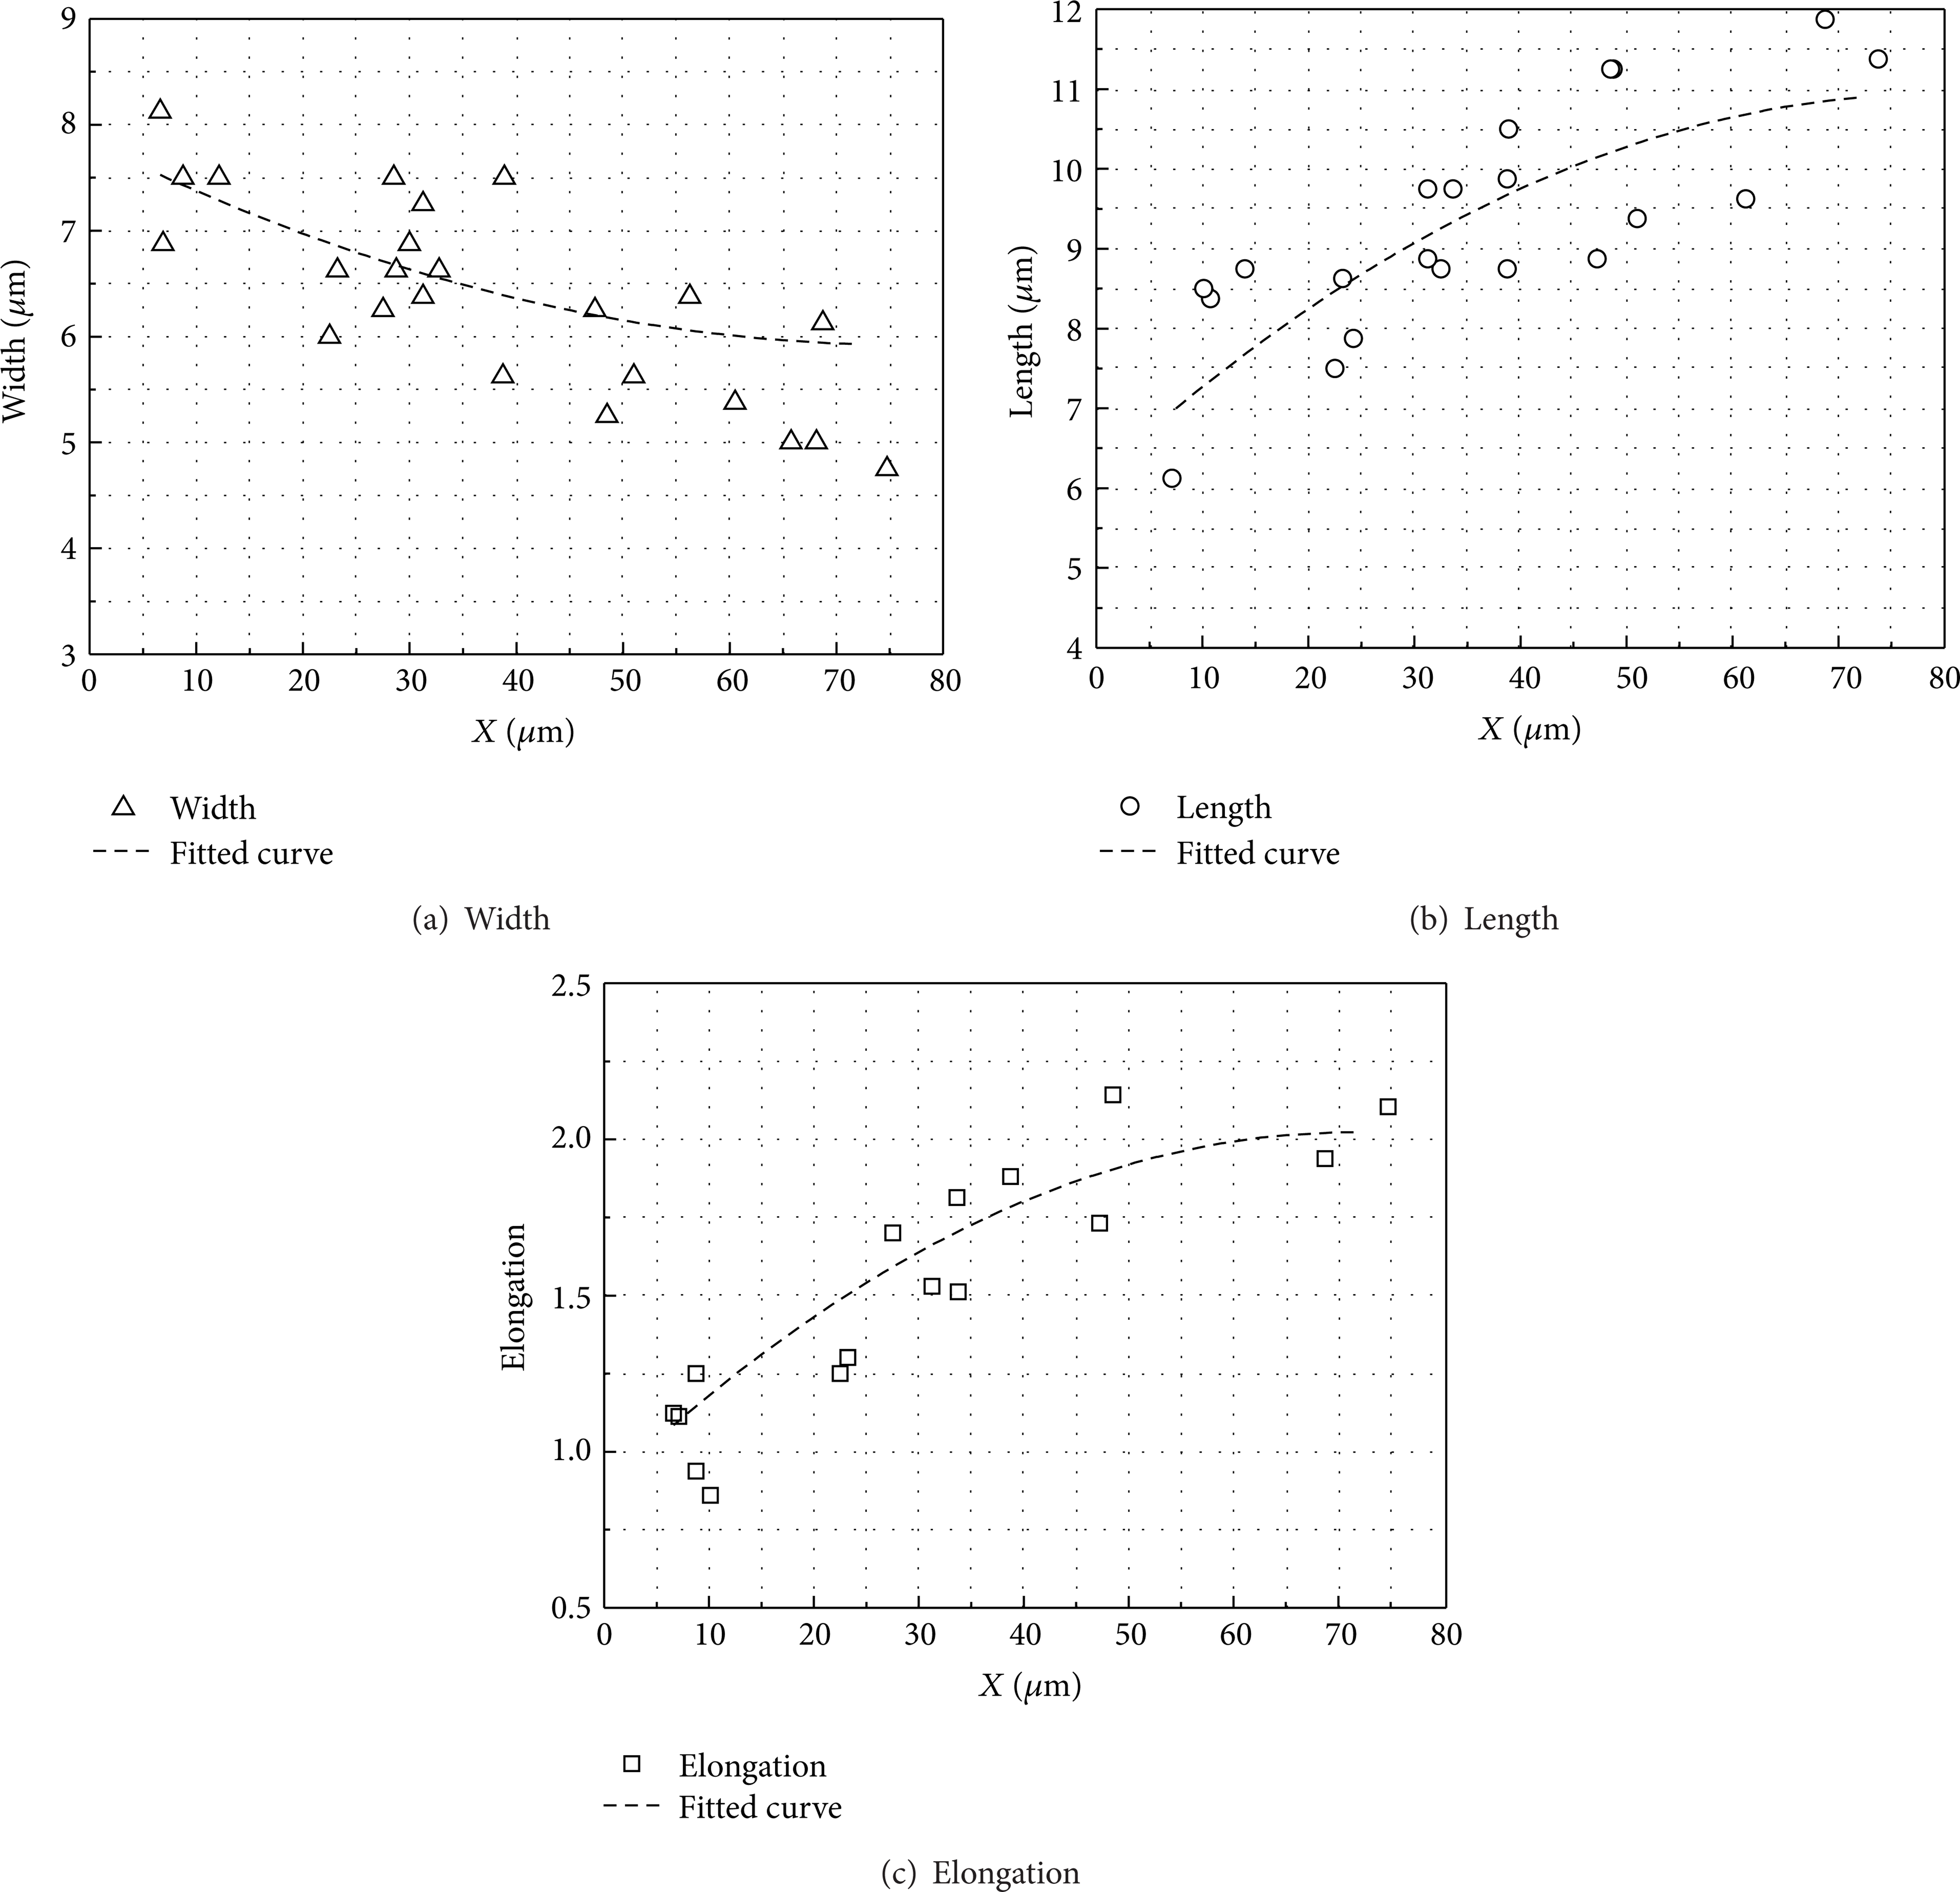
Geometric parameters of erythrocyte.
3. Numerical Simulation and Analysis
3.1. Numerical Simulation of the Flow in the Microchannel
The erythrocyte almost makes no difference in the flow behavior in the microchannel as the small size of erythrocyte and low concentration. Consequently, the fluid was considered to be single-phase. The one-dimensional model of erythrocyte during the movement is shown in Figure 6. The numerical simulation of the flow in the microchannel was conducted, and the physical parameters were obtained. The grid independence study was completed. The monitor pressure, pressure gradient, and velocity changed by 0.0038%, 0.232%, and 0.279% from Mesh 4 (84 × 104) to Mesh 5 (103 × 104), respectively. Hence, Mesh 4 (84 × 104) was used. The fitted curve of the flow velocity along X direction on the axis of the microchannel of erythrocyte was acquired, as shown in Figure 7(a).

One-dimensional model of erythrocyte.

Physical parameters of erythrocyte.
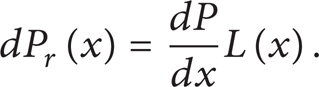
As shown in Figure 6, U R (x) and U F (x) represent the velocity of the erythrocyte and the fluid velocity around, respectively. P u (x) and P d (x) represent the pressure on the front and rear of erythrocyte, respectively. L(x) is the length of the erythrocyte, and X stands for the distance from the objective erythrocyte to the wall of the microchannel. The pressure difference on the erythrocyte, dP r , is defined as follows:

Based on the one-dimensional model of the erythrocyte, dP r can be given by
The fitted curve of dP r was gained, as shown Figure 7(b).
As shown in Figure 7(a), the velocity of erythrocyte continuously decreases during the movement, from 1.6 m·s−1 faraway to 0.2 m·s−1 near the wall. The pressure increases obviously, and the longitudinal pressure gradient is opposite to the flow direction, thus leading to the decrease in velocity. On one hand, the longitudinal pressure gradient firstly increases and then decreases, on the other hand, the length of the erythrocyte continuously decreases. As a result, the pressure difference of the erythrocyte firstly rises and then decreases with the further increasing of X (Figure 7(b)). It can be concluded from (2) that there will be a peak of the pressure difference during the movement.
3.2. Energy Balance Analysis of Erythrocyte
The energy balance relation of the erythrocyte during the movement can be given as follows:

where ΔQ is the external work, ΔK is the change of the kinetic energy, ΔE is the change of the strain energy, dP r (x) is the pressure difference, A(x) is the area of the erythrocyte, Ur(x) is the velocity, L(x) is the length of the erythrocyte, k(x) is the elasticity modulus of erythrocyte membrane, and x = x0 was set as the reference point. ΔQ can be given by

where A(x) can be estimated by

where W(x) is the width. ΔK can be given as follows:
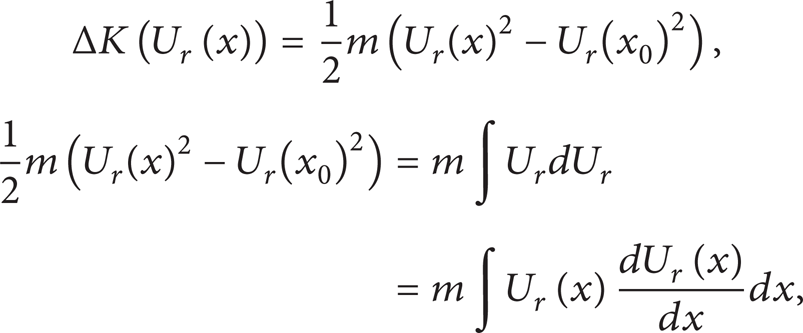
where the mass of a single erythrocyte was set to be 9.8 × 10⁻¹⁴ kg [19]. ΔE is given by
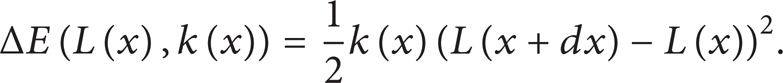
The analytic expression of L(x) was obtained, and the value of L(x0) was achieved based on the fitted curve of L(x) from the experimental results. The piecewise-linear analysis of the elasticity modulus of the erythrocyte membrane was accomplished. The range in X direction is 0–80 μm, which is divided into subintervals with 2 different patterns as follows:
Group A: 0: 10: 20: 30: 40: 50: 60: 70: 80;
Group B: 0: 5: 15: 25: 35: 45: 55: 65: 75: 80.
L e (x) is the fitted curve of the length of the erythrocyte according to the experimental results. The reference point of each subinterval is set to be the point with the maximum value of X, and the simulated curve of L(x) of every subinterval was acquired. Then the elasticity modulus of each simulated curve was adjusted to realize that the range of the length of the simulated curve was in good agreement with that of the experimental curve. The elasticity modulus, k, at x0 = 80 μm was set as 0.45 N·m−1, which was the elasticity modulus of the erythrocyte membrane in the initial condition [20]. The experimental curve and simulated curves of Group A are shown in Figure 8(a), where the solid line is the experimental curve, and each dash line represents the corresponding simulated curve with different x0 and k. It is shown in Figure 8(a) that in every subinterval, the simulated curve is in agreement with the experimental curve, indicating that the simulated elasticity modulus in each subinterval was in agreement with that of the experimental results. Similarly, the same analysis was conducted in Group B, (Figure 8(b)), and the elasticity modulus of Group A and B is shown in Table 2.
Elasticity modulus of Group A and B.


Simulated curves and experimental curves of L(x).
It is shown that the elasticity modulus of Group A is in great agreement with that of Group B, and the change of the elasticity modulus of the erythrocyte membrane during the movement was proposed, as shown in Figure 9. The elasticity modulus of the erythrocyte membrane distinctly decreases by 95.1% during the movement, from the initial value of 0.45 N·m−1 to 0.022 N·m−1 at x = 10 μm. Consequently, the contractile protein of the erythrocyte membrane no longer functions as an elastomer, suggesting that the contractile protein deforms obviously under the impact compression, and the erythrocyte membrane gets extremely fragile, resulting in hemolysis.

Change of the elasticity modulus of Case 1.
3.3. Comparison among Different Cases
Furthermore, the comparison among 3 cases was completed. As shown in Figures 10(a)–10(c), the geometric parameters in 3 cases are quite similar: erythrocyte gradually develops into tabular shape from the initial slender one along the flow direction during the movement. Figure 10(d) shows that in all 3 cases, the elasticity modulus distinctly decreases by more than 90%, and the erythrocyte membrane loses its elasticity. The contractile protein is fragile to the compressive loading, which finally leads to hemolysis. There are significant differences in the changes of erythrocyte velocity, pressure difference, and flow pressure in the microchannel, as shown in Table 3.
Comparison of the physical parameters of erythrocyte among 3 cases.


Similarity among 3 cases.
As shown in Figure 11(a) and Table 3, it is suggested that the initial velocity at x = 80 μm rises with the flow rate. However, there is no evident disparity among the velocities near the wall in all 3 cases, indicating that the velocity gradient rises with the flow rate and the erythrocyte will be under a higher longitudinal compressive loading, which increases the possibility in hemolysis.

Difference among 3 cases.
As shown in Figure 11(b), there is also an obvious difference in the changes of the erythrocyte pressure difference. As shown in Table 3, the pressure difference apparently increases with the flow rate, from 110 Pa at case 1 to 210 Pa at case 2, then to 305 Pa at case 3, which means that the longitudinal compressive loading on the erythrocyte increases when the flow rate rises, making the erythrocyte membrane more likely to fracture and increasing the possibility in hemolysis.
As shown in Figure 11(c), there is a difference in the flow pressure and its variation range. The pressure variation range increases from 113.1–114.1 kPa at case 1 to 116.9–118.9 kPa at case 2, then to 120.9–124.2 kPa at case 3, indicating that when the flow rate rises, the global and local pressure both increase, resulting in the increase in pressure gradient and longitudinal compressive loading. Hemolysis is more likely to occur.
According to the discussion above, it can be concluded that with the higher flow rate, there is little difference on the geometric parameters, but significant increase in the erythrocyte velocity gradient, pressure difference, and longitudinal compressive loading, increasing the possibility in hemolysis.
4. Conclusions
An experimental system was designed and completed to realize the visualization of the erythrocyte suspension micro-scale flow in microchannel and obtain the geometric parameters. The numerical simulation of the flow in the microchannel was achieved, and the physical parameters were obtained. The analysis of the energy balance was accomplished, acquiring the change of the elasticity modulus of the erythrocyte membrane. Moreover, the comparison among different cases was completed, and the influence on hemolysis of the flow rate was discussed. The conclusions are as follows.
The width of erythrocyte increases with the decreasing length and elongation during the movement. Erythrocyte gradually developed into tabular shape from the initial slender one.
The velocity of erythrocyte continuously decreases, and the pressure difference of erythrocyte firstly rises and then drops with a peak.
The elasticity modulus of erythrocyte membrane distinctly decreases during the movement, and the erythrocyte membrane immediately lost its elasticity, suggesting that the contractile protein deforms obviously under the impact compression and erythrocyte membrane gets extremely fragile, resulting in hemolysis.
With a higher flow rate, there is a significant increase in the erythrocyte velocity gradient, pressure difference, and longitudinal compressive loading, increasing the possibility in hemolysis.
Conflict of Interests
The authors declare that there is no conflict of interests regarding the publication of this paper.
Footnotes
Abbreviations
Acknowledgments
The authors would like to acknowledge financial support from the National Natural Science Foundation of China under Grant no. 11202158.