
Abstract
Relationship between track alignment irregularity and car body horizontal vibration acceleration is analyzed by using Hilbert-Huang Transform (HHT). Actual measured alignment irregularity and car body horizontal vibration acceleration are decomposed by empirical mode decomposition (EMD) to obtain intrinsic mode function (IMF). By comparing IMF waveform and energy spectrum of the irregularity and vibration acceleration, there is the definitive correspondence of IMFs, and the adverse section of irregularity can be identified from car body horizontal vibration acceleration. Finally, regression analysis is taken for measured sample of track inspection car on Beijing-Guangzhou line; the quantitative relationship between track alignment irregularity and car body horizontal vibration acceleration is established with a wavelength between 1.5 m and 50 m.
1. Introduction
Railroad tracks support weights of trains and help trains to run smoothly. However, operations of trains cause gradual track irregularities. Track irregularity is well known to be an important source of vibration of vehicle-track systems, where the track consists of a pair of rails supported by sleepers and ballast [1]. Therefore, it is necessary to study the vibration characteristics of such systems.
Recently, a few studies have concentrated on vibration analysis of vehicle-track systems. Lian and Huang [2] used the power spectra density and coherence functions to analyze the detrimental wavelengths of the track irregularities that induce large vibration responses to passenger and freight cars. Li et al. [3] developed a real-time technique relating track geometry to vehicle performance based on the neural network approach. Weston et al. [4] described the theory and practical results of using a bogie-mounted pitchrate gyro to obtain mean track alignment. A computational model for random vibration analysis of vehicle-track systems is proposed and solutions use the pseudoexcitation method and the symplistic method by Lu et al. [1]. Luber [5] proposed a method for track geometry assessment that calculates a vehicle response prediction based on system identifications. Gao et al. [6] proposed the vehicle-track coupled dynamics theory to analysis the sensitive wavelength of track irregularity in high-speed operation. However, these studies are used spectrum analysis to dynamic response characteristics based on coupled vehicle-track systems theory, which could not quantitatively analyse relationship between track alignment irregularity and car body horizontal vibration acceleration.
In this paper, we proposed Hilbert-Huang Transform (HHT) to study the time-frequency characteristic of horizontal vibration for vehicle-track system. Firstly, the mathematical theory of Hilbert-Huang Transform is overviewed. And then, the relationship between track alignment irregularity and car body horizontal vibration acceleration based on intrinsic mode function of them is presented. Regression analysis is given to quantitative analysis relationship between track alignment irregularity and car body horizontal vibration acceleration. Finally, conclusions are drawn and future work is discussed.
2. Hilbert-Huang Transform
The HHT, a National Aeronautics and Space Administration's designated name, is a combination of two methods, which are both introduced by Huang et al. [7, 8], that is, the empirical mode decomposition (EMD) and the Hilbert spectral analysis (HSA). The principles and procedures are briefly summarized below.
EMD decomposes a signal to a finite number of oscillatory modes called intrinsic mode functions (IMFs) that guarantee a well-behaved Hilbert transform. By definition, an IMF is any function that satisfies two conditions: (a) in the whole data set, the number of extrema and the number of zero crossings must either equal or differ at most by one and (b) at any data sample, the mean value of the envelope defined by the local maxima and the envelope defined by the local minima is zero [7].
The process of the EMD decomposition of the original signal x(t) can be separated into several finite computational steps, which are briefly described below.
First, identify all the local extrema and connect all the local maxima by a cubic spline line (upper envelope) and similarly all the local minima (lower envelope). The first proto-IMF can be computed from the mean of the upper and lower envelope m1(t) as follows:

where h1(t) is labeled proto-IMF because it does not necessarily satisfy the rigorous constraints that define an IMF. Therefore, in the second round of sifting, h1(t) is treated as data, and if the new mean is m11(t), then

where m11(t) is the mean of the upper and lower envelopes of h1(t). This process is generally reiterated k times until eventually h1k(t) is obtained as

is an IMF (c1(t) = h1k(t)). k is the number of iterations that allows h1k(t) to satisfy the stoppage criterion of the sifting process. Theoretically, c1(t) should contain the shortest period component of the data. Then, the residue is computed as
The residue r1(t) can be treated as the new time series to be sifted as described above, in order to obtain a slower IMF.
The whole process has to be reiterated n times until the residue r n (t) is an amonotonic function or a function with only one extremum. Finally, original data x(t) can be obtained from the sum of the IMFs components and residue r n (t) as follows:

As a data-driven method, in the EMD process, when the endpoints are not extrema, there exist wild swings which are not limited to the neighborhoods of the ends and propagate into the interior of the data, leading to distorted components [8]. Therefore, a method combining the mirror extension with the gray neural network is proposed to extend the data, which can solve the end effects problem more efficiently and effectively [9].
However, the EMD output is prone to mode-mixing which mainly occurs due to the overlapping of the IMF spectra [7], and the aliasing caused by sub-Nyquist extrema sampling. To overcome these issues, the ensemble EMD method was recently developed [10]. Essentially, it repeatedly decomposes the signal into IMFs by using the EMD method. During each trial of the decomposition process, white noise of finite amplitude is added to the original signal. To help overcome these issues, the sifting processes of EEMD algorithm are shown as follows.
Add to the signal x(t) an ensemble of n groups of white Gaussian noise w(t), of which the mean value is zero and standard deviation of amplitude is a constant. If s n (t) indicates the nth group of noise-added signal, and w n (t) the nth group of white Gaussian noise signals is added, their relation is shown as follows:

Decompose the ensemble s
n
(t) by applying standard EMD to each realization s
n
(t) separately, obtaining M
n
IMFs for s
n
(t), denoted by
Average the corresponding IMFs from the whole ensemble to obtain the averaged (ensembled) IMFs; for instance, mth IMF can be obtained by using

where N is the total number of the ensemble members used in the process.
As soon as the process of EEMD is completed, the Hilbert transform is applied to each IMF in order to compute instantaneous frequencies and instantaneous amplitudes. For every IMF component, that is, c i (t), its Hilbert transform y i (t) is defined as
where P indicates the Cauchy principal value. The IMF, that is, c i (t), and its Hilbert transform, that is, y i (t), form an analytical signal z i (t) defined as

where

The instantaneous frequency is defined as

Taking into account the previous equations, each IMF component c i (t) can be represented as

where ℜ is the real part of the value. And thus, the original data x(t) can be recovered as

Similar to the Fourier amplitude spectrum, the Hilbert amplitude spectrum H(ω, t) is the time-frequency distribution of the amplitude. The marginal spectrum h(ω, t) is a measure of the total amplitude (or energy) contribution from each frequency value. It represents the cumulative amplitude over the entire data span in a probabilistic sense. The marginal spectrum is obtained by integrating the Hilbert spectrum over the time duration T as follows:
3. Hilbert-Huang Transform Analysis of Horizontal Vibration for Vehicle-Track System
3.1. Waveform Analysis of Intrinsic Mode Functions
Track alignment irregularity of the railway line is the main horizontal vibration source to vehicle system, and there is correspondence between peaks of track alignment irregularity and response of car body horizontal vibration [3]. However, one of the underlying problems is that the current track horizontal irregularities may not be capable of identifying some track geometry conditions, which can cause undesirable vehicle response; conversely, many locations that do not meet the current standards may not cause poor vehicle performance.
Track irregularities are usually measured in displacement by a track geometry measurement system that using bogie mounted noncontacting inertial sensors complemented by an optional image based subsystem. Furthermore, the waveband of track irregularities is from 1.5 to 70 m. The vibration acceleration of vehicle is normally measured at the vehicle floor, using servo accelerometer which presents a good sensitivity (10 mV/g) and measure triaxial accelerations in a frequency range of 0–150 Hz. So that, the car body horizontal vibration acceleration in this paper is the vibration acceleration of the vehicle floor.
Figure 1 shows the original waveforms of track alignment irregularity and car body horizontal vibration acceleration which are sampled from the Beijing-Guangzhou Railway in China. This is the inspection result for traveling a straight line of ballasted track at a constant speed of 116 km/h. The peak number of track alignment irregularity waveform is relatively small, while car body horizontal vibration acceleration is large. There is poor one-to-one correlation which is an obvious difference from the results of theoretical model calculation. The reason of this is great, but the main is imprecise expressions of nonlinear characteristics of air spring and hydraulic shock absorber in the theoretical model.
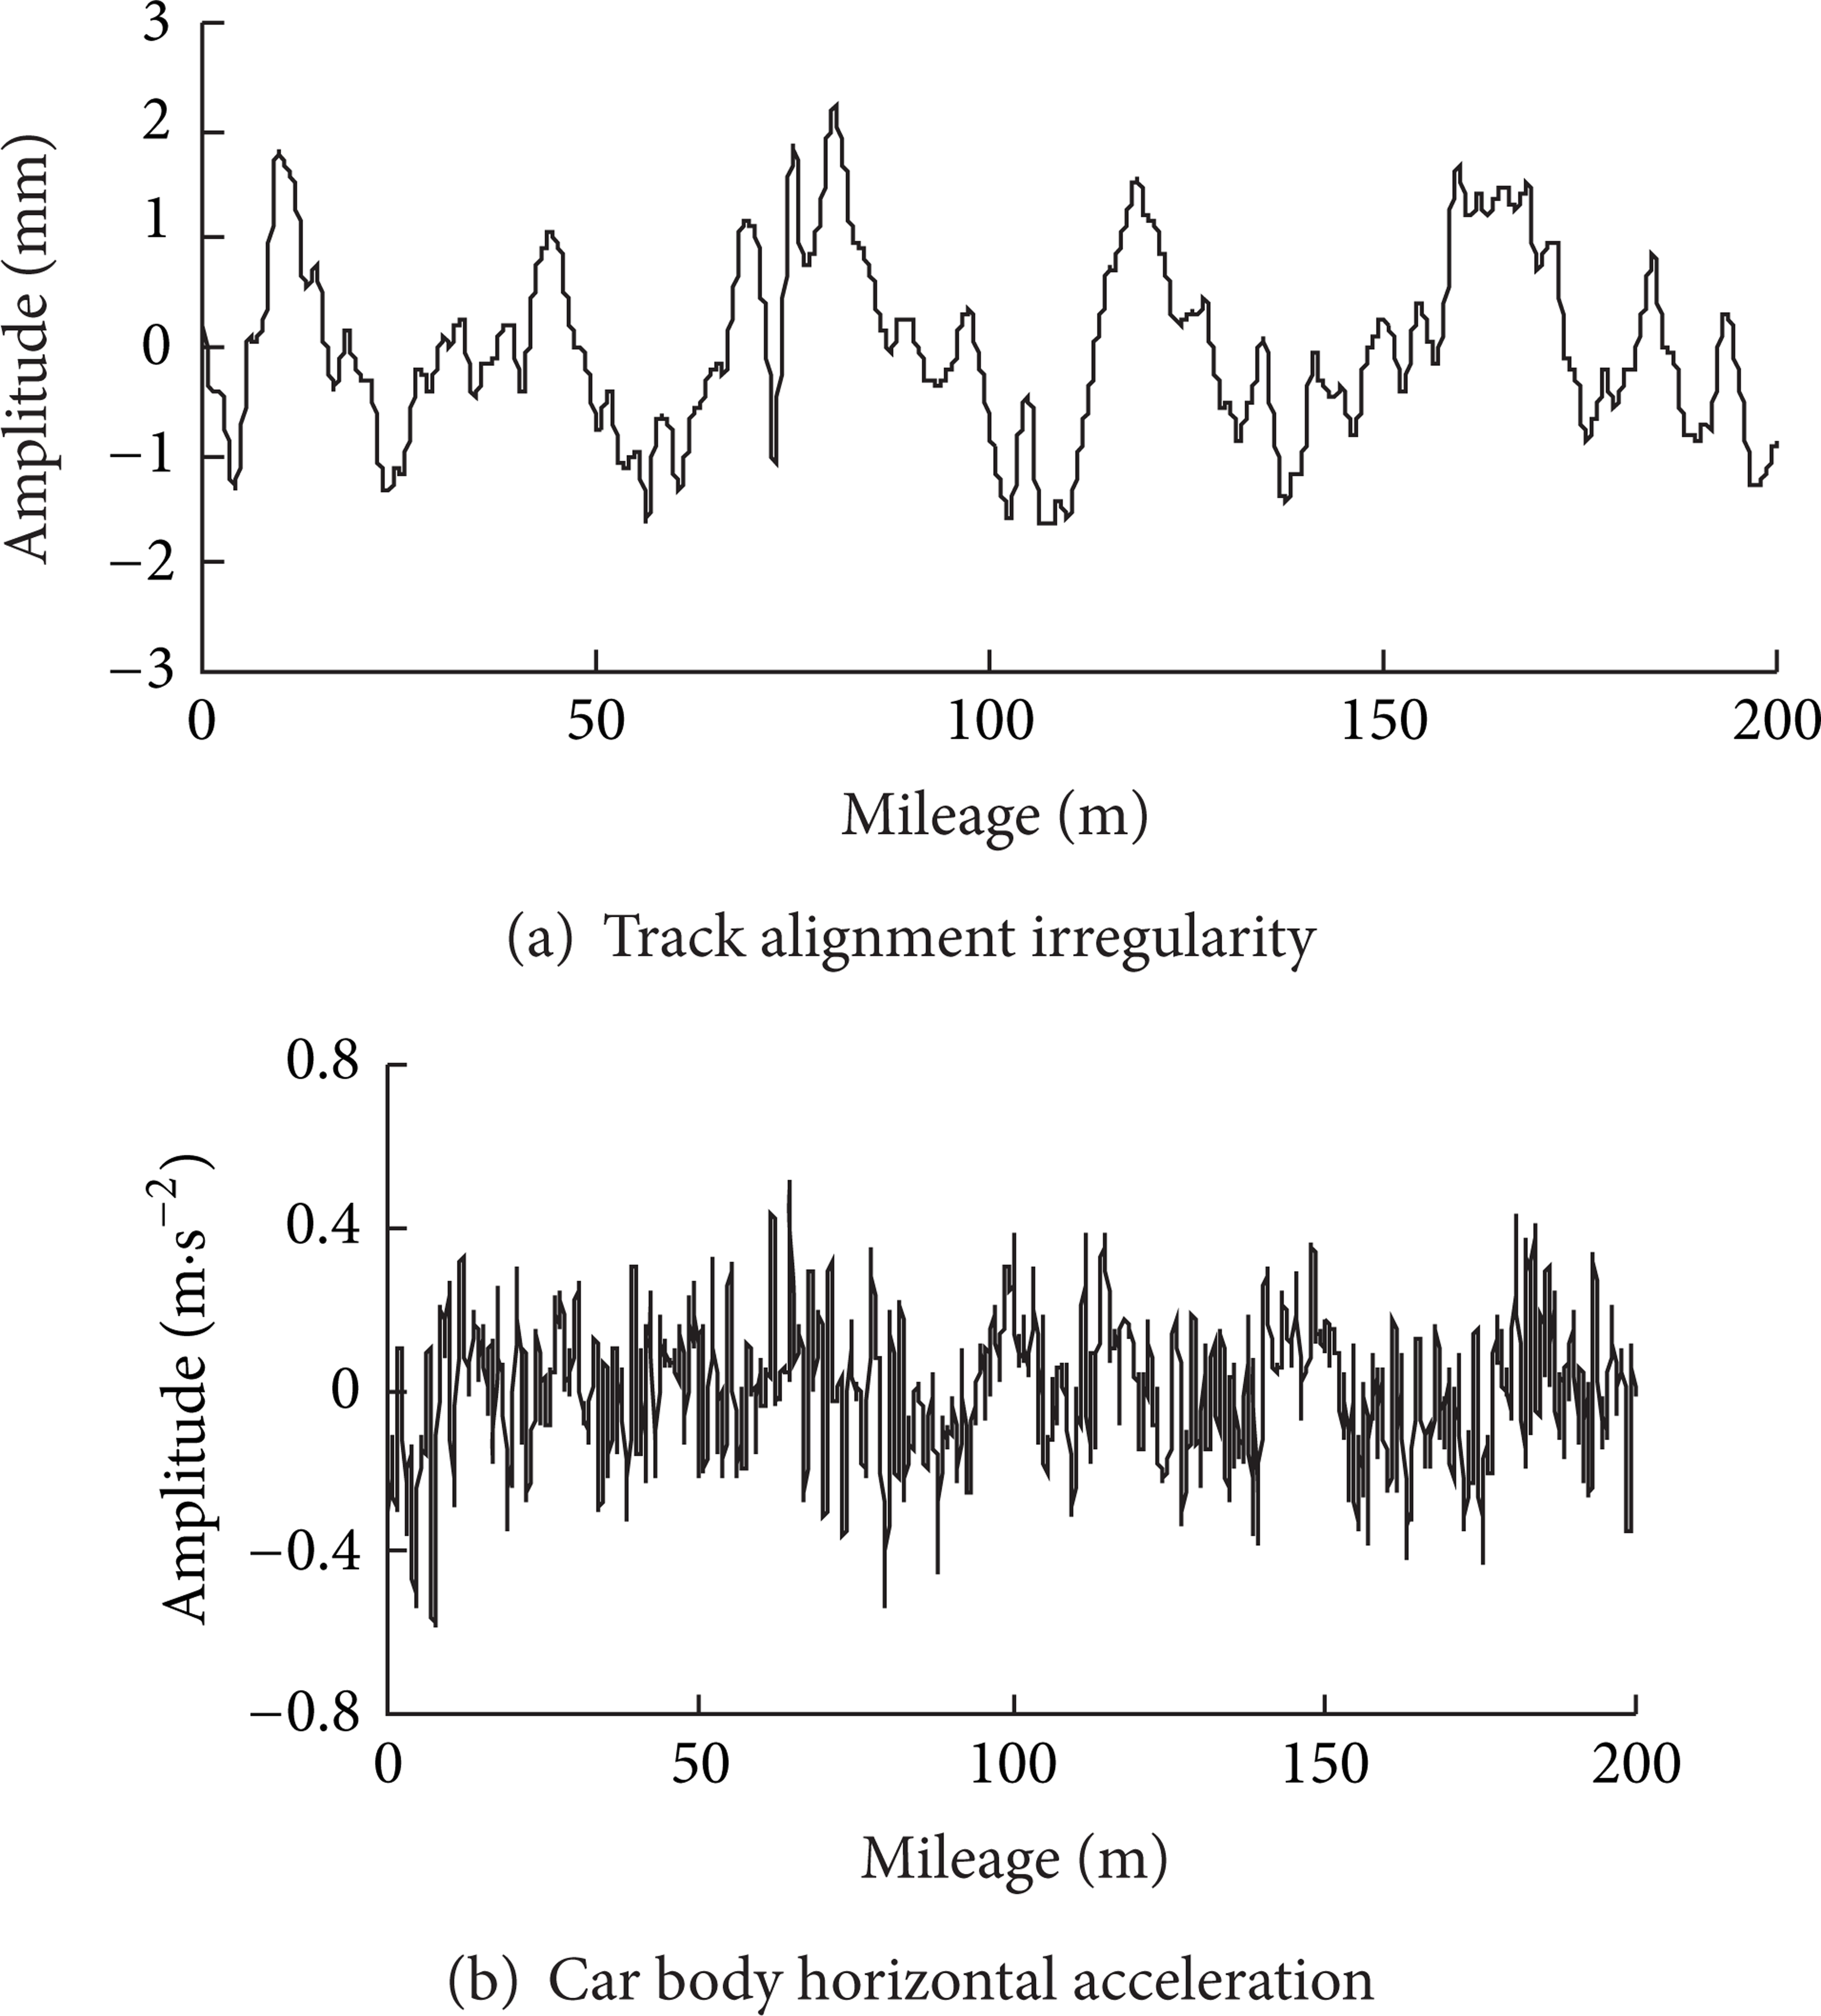
Actual wave form of track alignment irregularity and car body horizontal acceleration.
In Figure 2, decomposition results of the two signals using Empirical mode decomposition are plotted. As it is mentioned above, IMFs represent the intrinsic oscillation modes embedded in the signal. The IMF c1 covers the highest frequency band of the signal, and then the frequency components of the IMF c2–c6 become lower. Meanwhile, there are different amplitude characteristics of IMFs, which mean that the IMFs of track alignment irregularity and car body horizontal acceleration can have a variable amplitude and frequency.

Empirical mode decomposition of track alignment irregularity and car body horizontal acceleration.
It is seen in Figure 2 that the peak number of track alignment irregularity IMFs and car body horizontal acceleration IMFs are obviously different, while the number of car body horizontal vibration acceleration is larger. However, there is better correspondence between the positions of large values of track alignment irregularity IMFs and car body horizontal acceleration IMFs which means a high acceleration response may indicate that there is track geometry defect.
3.2. Hilbert Spectra Analysis
The Hilbert spectra obtained by using HHT method is demonstrated in Figure 3. It reflects well the time-frequency character, and from which the time-frequency distribution of signal is made up of many components with different frequencies and amplitudes that can be obviously analyzed. There are small amplitudes of short wavelength irregularities such as rail corrugation, and welded joint, while the amplitudes of long wavelength irregularities are relatively larger which reflect the waveform amplitude of track irregularities of the whole line in time domain. Notice that the two spectrums show better correspondence among track alignment irregularity and car body horizontal acceleration, while there exist phase shift.
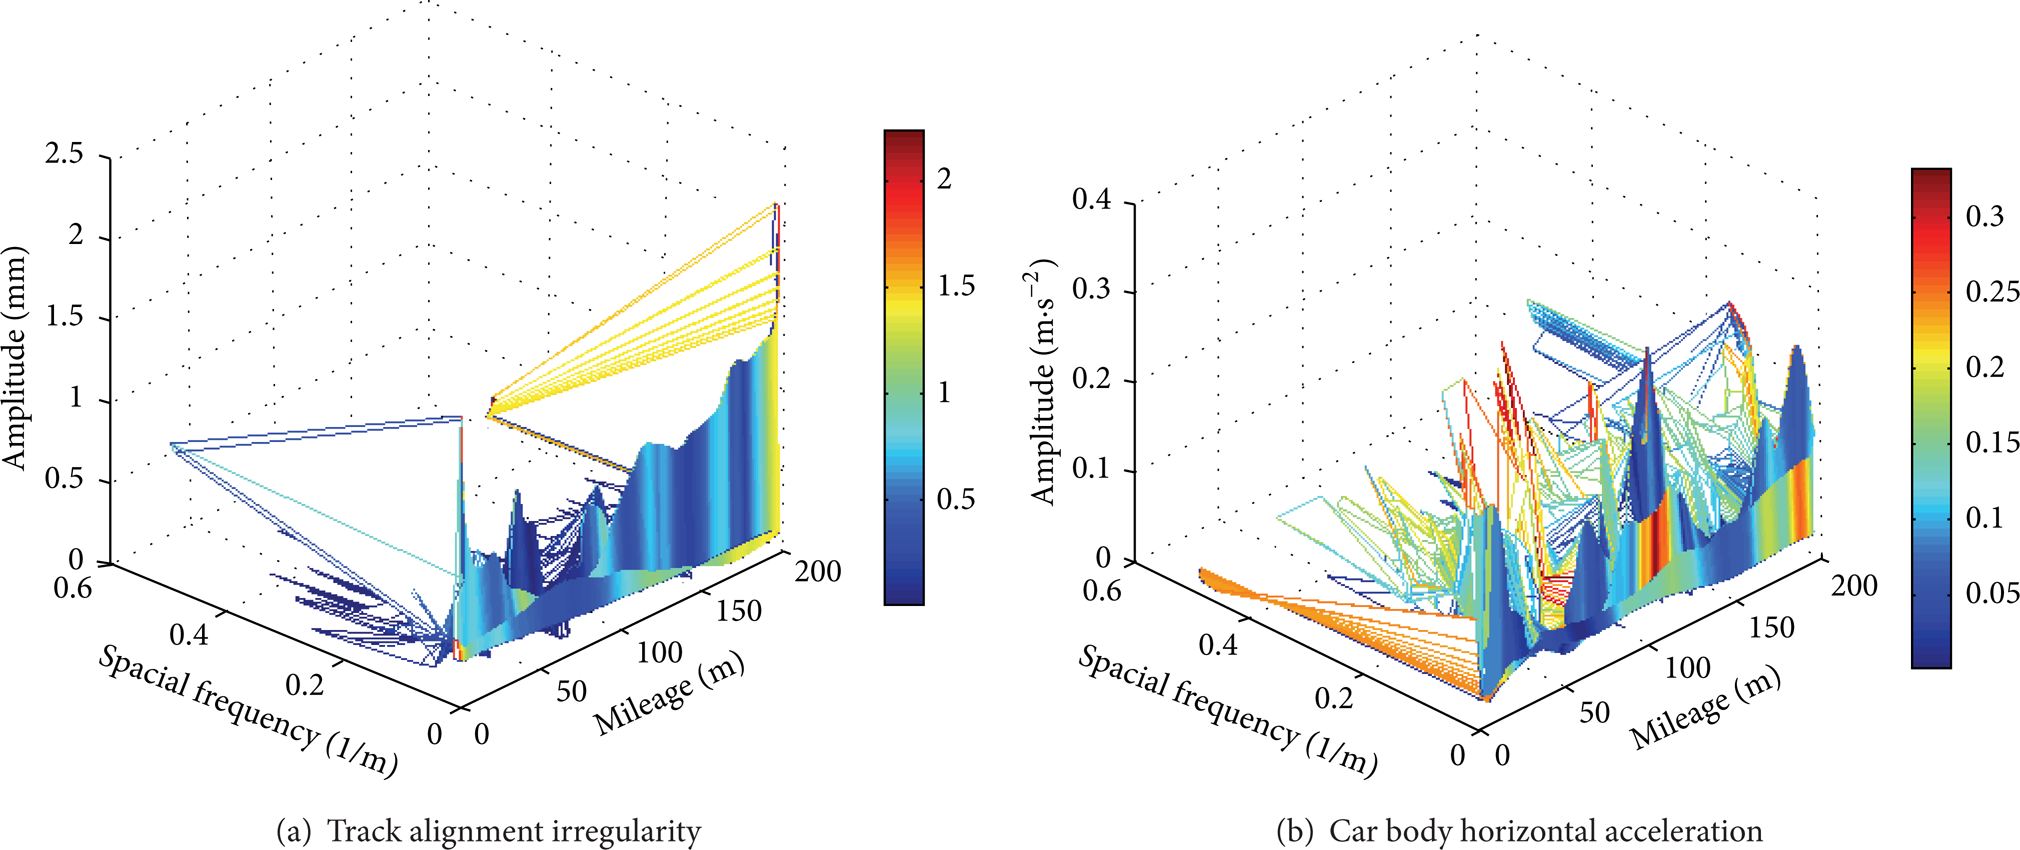
Hilbert time-frequency spectrum of track alignment irregularity and car body horizontal acceleration.
Through the time domain waveform and energy spectrum analysis above, we can conclude that there is good correspondence among track alignment irregularity and car body horizontal acceleration. Furthermore, calculation using dynamic simulation [11] produces similar results. Therefore, it is a deterministic relationship between the IMFs of track alignment irregularity and car body horizontal acceleration, which means that the IMF of track geometry defect can cause a high IMF of acceleration response.
3.3. Regression Analysis of Intrinsic Mode Functions
The method of regression analysis is used to calculate the quantitative relationship between IMFs of track alignment irregularity and car body horizontal acceleration.
At present, regress formula is based on linear regression theory, and it usually is regardless of vehicle travel speed which has significant effect on vibration of the vehicle in fact. Thus, the regress formula taking into account the speed factor is given as follows:

where a is car body horizontal acceleration, A and B are regression coefficients, V is vehicle traveling speed, x is the amplitude of track alignment irregularity, and Q is coefficient of curvature.
The sample data is collected from one section of Beijing-Guangzhou Railway during the period from January 1, 2008 to June 31, 2009. The length of section is 315 km and the number of inspection is 36. Based on definition of the wavelength ranges of track irregularities, which the waveband from 1 to 3.5 m is considered as short irregularity, the analysis wavelength uses wavebands 1.5–3.5 m, 3.6–10 m, 10.1–20 m, 20.1–30 m, 30.1–40 m, and 40.1–50 m. With the linear regression for the IMFs of track alignment irregularity and car body horizontal acceleration, the regression parameters are shown in Table 1.
Regression parameters of track alignment irregularity and car body horizontal acceleration.

4. Conclusion
In this paper, Hilbert-Huang Transform has been introduced for time-frequency analysis of horizontal vibration for vehicle-track system. Relationship between track alignment irregularity and car body horizontal acceleration is analyzed. Actual measured track alignment irregularity and car body horizontal acceleration are decomposed by empirical mode decomposition (EMD) to obtain intrinsic mode function (IMF). By comparing IMF waveform and Hilbert spectrum of track alignment irregularity and car body horizontal acceleration, there is the definitive correspondence of IMFs; and the section of track geometry defect can be identified from car body horizontal vibration acceleration. Regression analysis is taken for a measured sample of track inspection car on Beijing-Guangzhou line; the quantitative relationship between track alignment irregularity and car body horizontal acceleration is established with a wavelength between 1.5 m and 50 m.
Conflict of Interests
All of the authors do not have any direct financial relation with the commercial identities mentioned in this paper.
Footnotes
Acknowledgments
This work was supported by the Key Subject Building Project of Shanghai Municipal Education Commission (J51401), the Innovation Program of Shanghai Municipal Education Commission (14YZ137), the Natural Science Foundation of Shanghai (12ZR1412300), and the Training Project of Youth College Teachers of Shanghai Municipal Education Commission (ZZGJD13041).