
Abstract
Data races are common in interrupt-driven programs and have already led to well-known real-world problems. Unfortunately, existing dynamic tools for reporting data races in interrupt-driven programs are not only unsound, but they also fail to verify the existence of data races in such programs. This paper presents an efficient and scalable on-the-fly technique that precisely detects, without false positives, apparent data races in interrupt-driven programs. The technique combines a tailored lightweight labeling scheme to maintain logical concurrency between the main program and every instance of its interrupt handlers with a precise detection protocol that analyzes conflicting shared memory accesses by storing at most two accesses for each shared variable. We implemented a prototype of this technique, called iRace, on top of the Avrora simulation framework. An empirical evaluation of iRace revealed the presence of data races in some existing TinyOS components and applications with a worst-case slowdown of only about 6 times on average and an increased average memory consumption of only about 20% in comparison with the original program execution. The evaluation also proved that the labeling scheme alone generates an average runtime overhead of only about 0.4x while consuming only about 12% more memory than the original program execution.
1. Introduction
Asynchronous interrupt handling is a common mechanism in various cyber-physical systems including sensor networks, avionics, and automotive systems, or various medical devices. However, such interrupt-driven applications are hard to be thoroughly tested and debugged since they have to deal with external asynchronous interrupts that exponentially increase the number of their execution paths at runtime. Moreover, asynchronous interrupts introduce fine-grained concurrency into interrupt-driven programs making them prone to data races [1, 2] which occur when two threads access a shared memory location without proper synchronization, and at least one of the accesses is a write.
Data races in interrupt-driven programs have already led to real-world problems like the well-known accident of the Therac-25 [3] where, as the result of a data race caused by the keyboard interrupt handler, many people received fatal radiation doses. Another example of data race is certainly the GE XA/21 bug [4] that, in August 2003, caused a total blackout for about 50 million people in the Northeast United States and Canada. It becomes therefore crucial to precisely detect data races ahead of the exploitation phase. Data races are often classified into feasible data races that are data races based on the possible behavior of a program and apparent data races, which are defined in the context of a specific program execution [2]. Apparent data races which are only based on the behavior of the explicit synchronization in a program, represent an approximation of the feasible data races that are the real data races that might happen in any specific execution of the program. Apparent data races are less accurate but easier to detect than feasible data races, whose detection has been proven NP-hard [2].
Few dynamic race detectors [5, 6] have recently been proposed for detecting data races in interrupt-driven programs. However, legacy race detectors for multithreaded programs [7–9] are very intrusive and cannot directly be applied to interrupt-driven due not only to differences between the programming models, but also to the high overhead they incur. Thus, Lee et al. [6] proposed to convert an interrupt-driven program into a corresponding multithreaded program and to use an existing dynamic race detection tool to detect data races into the newly generated program. This technique fails to capture the semantics of interrupts and incurs high space and time overheads due to the use of tools basically designed for multithreaded programs. Erickson et al. [5] presented a technique that aims to detect data races in low-level kernel codes by randomly sampling parts of the program to be used as candidates for the race detection, and using data and code breakpoints to detect conflicting accesses to shared variables. Although some data races caused by interrupts may be reported, the tool still reports many false positives and fails to guarantee that programs are free from data races. Moreover, existing testing methods for interrupt-driven programs [11–14] are not sufficient for debugging since they can only reveal the presence of data races, but fail to adequately detect their root causes and, therefore, require important manual inspections for real data race detection. Thus, some data races still remain undetectable and make their way to the exploitation phase, leading the application into unpredictable executions sometimes with severe consequences.
Dynamic data race detection methods are generally classified into on-the-fly [5–9] and postmortem [15, 16] techniques. While postmortem techniques collect runtime data for post-execution analysis, on-the-fly techniques on the other hand will dynamically detect data races at runtime. On-the-fly techniques still require less space overhead than postmortem techniques due to the fact that unnecessary information is discarded at runtime as the detection progresses. On-the-fly techniques are generally based either on the happens-before analysis [7, 8, 17, 18], the lockset analysis [19], or the hybrid analysis [9, 20] that is a combination of the first two. However, on-the-fly techniques still suffer from the high runtime overhead they incur. Dynamic analysis methods can be a good complement to static analysis methods [21, 22] since they guarantee to isolate real data races in a particular execution instance of a program given an input from the potential data races reported by static analysis.
This paper presents an on-the-fly technique that efficiently detects apparent data races in interrupt-driven programs without false positives. The technique combines a tailored lightweight labeling scheme to maintain the logical concurrency between a program and every instance of its interrupt handlers with a precise detection protocol that analyzes conflicting accesses to shared memories by storing at most two accesses for each shared variable. The labeling scheme generates unique identifiers to track and analyze the happens-before relation between the main program and each of its interrupt handlers. The precise detection protocol eases the debugging process since it guarantees to verify the existence of data races in the monitored program by reporting at least one data race for each shared variable involved in a data race. Moreover, the detection protocol shows a space complexity of only
We implemented a prototype of our technique, called iRace, on top of the Avrora simulation and analysis framework [23] that provides a time accurate simulator and an instrumentation engine [24] for programs written for the AVR microcontrollers and sensor networks. An empirical evaluation of iRace revealed the presence of data races in some existing TinyOS [25] components and applications with a worst-case slowdown of only about 6 times on average and an increased average memory consumption of only about
The remainder of this paper is organized as follows. Section 2 presents some properties of interrupt-driven programs and introduces the notion of data races. Section 3 focuses on our lightweight labeling scheme for interrupt-driven programs. Section 4 presents our precise data race detection protocol. In Section 5, a theoretical analysis of the proposed race detection technique is given. Section 6 discusses the implementation challenges of the technique and presents our evaluation results. The conclusion and future work come in Section 7.
2. Background
This section presents the interrupt-driven programs with some important properties of interrupts and introduces the notion of data races together with some useful definitions.
2.1. Interrupt-Driven Programs
Interrupts are generally defined as hardware signals as they are generated by the hardware in response to an external operation or environment change. A system is then interrupt driven if a significant amount of its processing is initiated and influenced by external interrupts [13, 26]. For systems based on more powerful processors, interrupts are commonly managed inside the operating system kernel, hiding their complexity from programmers. However, for highly resource-constrained embedded systems with a thin kernel layer like TinyOS [25], applications have to provide and manage their own interrupt handlers [13, 26]. We will focus our attention on the latter since this kind of applications is likely to contain data races. Interrupt handling is a common mechanism in various cyber physical systems including embedded sensor networks, avionics and automotive systems, or various medical devices. However, since interrupt-driven programs come with different flavors, our description will be based on the nesC language [21] used for TinyOS applications.
An interrupt handler is an asynchronous callback routine attached to each interrupt to service it whenever it arrives in the system. When an interrupt is received, it remains pending until it is delivered or handled. Contrarily to threads, interrupt handlers cannot block: they run to completion except when preempted by another interrupt handler [13, 21, 26]. Interrupt handlers have an asymmetric preemption relation with the noninterrupt code or task in nesC: tasks can be preempted by interrupt handlers, but not the contrary. Tasks in nesC are not allowed to preempt themselves; they are ordered and run in a first-in first-out manner. Interrupts are nested when they preempt each other. Nested interrupts are used to allow time-sensitive operations to be handled with low latency. An interrupt is reentrant when it directly or indirectly preempts itself.
In order to minimize the impact of interrupt handlers on tasks, all long-latency operations must run in split-phase. With this mechanism, interrupt handlers immediately return after servicing critical operations and post heavy computations for later execution as new tasks. The concurrency model of interrupt-driven programs allows at runtime an exponentially increasing number of execution paths making them difficult to reason about. Since the only way to share data with interrupt handlers is through global variables, interrupt-driven programs are prone to concurrency bugs like data races [1, 2, 13, 26]. To protect sensitive parts of the program, interrupts must be disabled before and enabled only after critical sections. Interrupts can be either asynchronous or synchronous. Asynchronous interrupts are signaled by external devices such as network interfaces and can fire at any time that the corresponding device is enabled [13]. Synchronous interrupts, on the other hand, are those that arrive in response to a specific action taken by the processor, such as setting a timer.
2.2. Data Races
In shared-memory concurrent programs, data races [1, 2, 27] represent one of the most notorious class of concurrency bugs. Data races occur when two threads access a shared memory location without proper synchronization, and at least one of the accesses is a write. It is important to detect data races because they may lead programs to nondeterministic executions with unpredictable results.
For illustration, we consider the example program of Algorithm 1 that is adapted from the Oscilloscope application distributed with TinyOS [10]. This application allows a node of a sensor network to periodically sample, cache, and send data from its sensors. We assume that interrupt handlers in Algorithm 1 are not reentrant and that they automatically disable themselves before they run. We define a partial order execution graph (POEG) [28] to represent an execution instance of an interrupt-driven program. Unless explicitly mentioned, we will use the term thread to refer to either a task or an interrupt handler. Therefore, we define a thread segment as a sequence of instructions executed by a single thread and delimited by either a disabling or an enabling instruction. Thus, a thread
(1) TOS_Msg msg; /* shared variable */ (2) uint8_t packet Index; /* shared variable */ (3) async event result_t ADC.dataReady (uint16_t data) { (4) struct OscopeMsg *pack; (5) pack = (struct OscopeMsg *) msg.data; (6) pack->data [packetIndex++] = data; (7) if (packetIndex == BUFFER_SIZE) { (8) post dataTask ( ); (9) } (10) } (11) async event result_t PhotoSensor.dataReady (uint16_t data) { (12) post photoTask ( ); (13) } (14) task void dataTask ( ) { (15) struct OscopeMsg *pack; (16) atomic { (17) pack = (struct OscopeMsg *)msg.data; (18) check (pack); (19) packetIndex = 0; (20) } (21) pack->channel = 1; (22) pack->sourceMoteID = TOS_LOCAL_ADDRESS; (23) send (&msg); (24) } (25) task void photoTask ( ) {/* do something; */}
Definition 1 (POEG).
A POEG is a directed acyclic graph of 2-tuple
Definition 2 (happens-before [29]).
Given a program execution, if a thread segment
In a POEG, two accesses are concurrent if and only if there is no path between them. Otherwise, they are ordered by the happens-before relation. An example POEG for the program in Algorithm 1 considering only accesses to the shared variable

A POEG of an execution instance of the program in Algorithm 1. Only accesses to
Although the first instance of the ADC interrupt handler posted
3. Lightweight Labeling Scheme
For an effective dynamic race detection, it is essential to adequately determine the order of precedence between thread segments accessing shared memory locations. For this purpose, this section presents our lightweight labeling scheme used for capturing the logical concurrency between thread segments of interrupt-driven programs.
3.1. Generating Thread Labels
Happens-before based on-the-fly race detection techniques generally rely on a variation of Lamport's logical timestamp [29] in order to precisely identify concurrent thread segments of a program. The effectiveness of on-the-fly techniques is highly dependent on the cost and accuracy of this identification process. Our labeling scheme generates a unique identifier, called label, for each thread segment
Definition 3 (critical section).
A critical section with respect to a given interrupt k is a portion of program comprising between a disable and probably an enable instruction to interrupt k.
Definition 4 (interrupt set).
The interrupt set or
Definition 5 (critical section violation).
A thread segment
The label of each thread segment
Creating labels for thread segments of an interrupt-driven program is straightforward with our labeling scheme as suggested by the algorithms in Algorithm 2. A new labeled thread
a1: a2: Label Lb a3: Lb.t = true a4: Lb.tid = getTaskid() a5: Lb.cs = false a6: Lb.iset = ⌀ a7: return Lb
b1: b2: Label Lb b3: Lb.t = false b4: Lb.tid = getIntNumber() b5: Lb.cs = false b6: Lb.iset = ⌀ b7: return Lb
c1: c2: if(n > 0) Lb.iset c3: else c4: Lb.cs = true c5: Lb.iset = ⌀ c6: endif c7: return Lb
d1: d2: if(n > 0) Lb.iset-n d3: else d4: Lb.cs = false d5: Lb.iset = ⌀ d6: endif d7: return Lb
When a thread segment
Moreover, the size of an interrupt set is bounded by the total number of interrupts supported by the hardware on which the program runs, which is generally a reasonable integer number. By reusing the same label for different instances of the same interrupt handler, our labeling scheme does not depend on the total number of interrupts received at runtime which can be very high.
Lemma 6.
Given two labeled thread segments
Proof.
Let us consider two labeled thread segments
3.2. Concurrency Relation
Using our labeling scheme, it becomes easy to analyze the happens-before relation between any pair of thread segments,
Theorem 7.
A labeled thread segment
Proof.
Let us assume two labeled thread segments
Now, let us assume that
Any two labeled thread segments

By comparing, based on Theorem 7, the labels of the thread segments in the POEG represented by Figure 2, we can easily obtain that the thread segments of

An example labeled POEG for an execution instance of the program in Algorithm 1.
4. Precise Detection Protocol
The race detection protocol monitors memory accesses by maintaining a special data structure, called access history, into which are stored the labels of prior accesses to each shared variable. Our detection protocol stores, in each entry of the access history of a shared variable, a unique label representing the thread segment that accessed the variable as described in Section 3. At each access to a shared variable, data races are reported by analyzing, based on Theorem 7, the happens-before relation between the current thread segment and the labels of prior thread segments stored in the access history. Therefore, the access history for each shared variable has to be efficiently organized in order to reduce the overhead generated by the detection process.
Our precise detection protocol maintains an access history consisting of two sets for each shared variable: a Read set and a Write set, to, respectively, store labels of thread segments that read and write the variable. We use
(1) (2) if (isFiltered(Lb, AH(x).Read)) then return; (3) for all labels pLb in AH(x).Write do (4) if (Not Ordered(Lb, pLb)) then (5) report_ race(x, pLb, Lb) (6) end for (7) maintain_ah(Lb, AH(x).Read) (a) Monitoring Protocol for Read Accesses (1) (2) if (isFiltered(Lb, AH(x).Write)) then return; (3) for all labels pLb in (4) AH(x).Write ∪ AH(x).Read do (5) if (Not Ordered(Lb, pLb)) then (6) report_race(x, pLb, Lb) (7) end for (8) maintain_ah(Lb, AH(x).Write) (b) Monitoring Protocol for Write Accesses (1) (2) if (Lb.cs = true) and (Lb.tt = true) (3) then return true; (4) if (any access with a label pLb exists in AH (5) such that pLb = Lb) then return true; (6) else (7) return false; (c) Filtering Redundant Accesses (1) (2) if (Lb.tt = true) then (3) delete all entries in AH with label pLb (4) such that pLb.tt = true (5) else (6) delete all entries in AH with label pLb such (7) that pLb.tt = Lb.tt and pLb.tid = Lb.tid (8) end if (9) add_ah(Lb, AH) (d) Maintaining Access History
When a read access occurs to a shared variable x, the detection protocol calls the
In order to maintain a reduced size access history, accesses from critical sections that concern all interrupts within a task are not inserted in the access history since they will never run into a data race with other accesses from interrupt handlers. Also, only the first read and write accesses to a shared variable from the same thread segment are kept into the access history. Subsequent similar accesses to the same shared variable from the same thread segment are filtered out. This filtering operations are performed by the
After data races have been reported with the current access, the function
Table 5 shows the different states of an access history for detecting data races with our protocol in the example program of Figure 2, where accesses to the shared variable
Although it keeps only a reduced set of labels in the access history, our precise detection protocol even with a minimal number of interrupts, still guarantees to verify the existence of data races in a program. For this purpose, the protocol is designed to report, without false positives, at least one data race for each shared variable involved in a data race.
Theorem 8.
Given an interrupt-driven program P, the detection protocol reports a data race over a shared variable x, if and only if there exists a data race over x in an execution instance of P.
Proof.
We will first prove that if a data race is reported on a shared variable x by the detection protocol, then there also exists a data race in an execution instance of the program for the same shared variable x. For this, we assume a snapshot of the access history
Case A.
Case B. There is no data race between There are data races between
Now, we show that if there exists a data race over a shared variable x in an execution instance of the program P, then our detection protocol also reports a data race over x. Using the contrapositive, we will prove that if the detection protocol does not report any data race, the program P also does not contain any for a shared variable x. We again consider a snapshot of the access history
5. Theoretical Analysis
On-the-fly data race detection techniques are known to have high runtime overhead that is generally provoked by the time spent monitoring accesses to shared variables and to compare thread labels. In this section, we theoretically analyze the efficiency of our technique which depends on: V, the number of shared variables, and T, the total number of interrupts in the underlying system plus one, the number of tasks. In general, T is very small since the number of interrupts handled by a system is also kept small. For example, the popular Atmel ATmega128 [30] processor supports only a maximum of 34 interrupts. Also, because of the implicit happens-before relation that exists between all tasks, they are viewed as a single task by the detection protocol.
Table 1 presents the space and time complexities of our labeling and detection techniques. The access history used by our technique stores from each thread segment, at most two accesses for each shared variable. Each label in the access history has a worst-case size of
Efficiency of the precise detection protocol.

A new label is always created in a constant amount of time by our labeling algorithms. Interrupts are generally given numbers in a sequence order. Therefore, a binary search technique is applied to locate values in interrupt sets which contain only interrupt numbers. Thus, the time complexity for comparing any two labels is
6. Experimental Results
We empirically evaluated the preciseness and efficiency of our technique using a set of well-known programs provided with TinyOS [10]. This section details the implementation challenges and presents the analysis results of the experimentation.
6.1. Implementation
We implemented a prototype of our data race detection tool for interrupt-driven programs, called iRace, based on the concurrency model of TinyOS [21] and its nesC language [25]. We implemented iRace on top of the Avrora [23] simulation and analysis framework that provides a time accurate simulator, different analysis tools known as monitors, and a binary instrumentation engine [24] for programs written for AVR microcontrollers and sensor networks. All these features make Avrora just suitable for our tool. Simulation is commonly used in the development cycle of embedded software, because target systems generally lack conventional input/output interfaces. With iRace, the functionalities of Avrora are extended with a precise data race detection tool that can easily be loaded as one of Avrora's monitors.
As shown in Figure 3, iRace consists of two main components: the Instrumenter, which exploits the Avrora instrumentation engine [24], and the core Race Detector itself. The Instrumenter monitors task and interrupts activities through its iMonitor component and provides entry points for the labeling routines. Instrumentation points are inserted at the beginning of each task, at the start and exit of each interrupt handler, and also before interrupts are either enabled or disabled. Similarly, accesses to shared memory locations are monitored using the AccessMonitor component that also calls routines of the detection protocol. The AccessMonitor instruments before read and write accesses to shared variables. The Race Detector is composed of labeling routines that generate and manage labels for each active thread segment at runtime, and detection routines for maintaining the access history and reporting data races on-the-fly as shared variables are manipulated.

The Architecture of the Data Race Detection Tool.
In TinyOS [21, 25], interrupt handlers and tasks all run to completion unless preempted by other interrupt handlers. Thus, only a single thread runs at any point of time, giving us the opportunity to use only a single variable to maintain the active thread label at detection time. However, when preemption happens, the label of the preempted thread segment must be saved and restored again when the active interrupt handler exits. Otherwise, there will be no way to know about the concurrency information of the preempted thread segment when it gains back the execution control. In order to manage the preemption, we use a stack data structure where labels can be pushed and restored from since interrupts can be nested. This provides a simple but powerful way to handle preemption with negligible overhead.
Our labeling scheme needs to uniquely identify each interrupt handler whenever it is invoked and each task when it starts its execution. Each interrupt handler is easily identified by the interrupt number of the interrupt it serves. For task, we chose to generate a unique task identifier by simply maintaining a counter that increases at each time a task starts its execution. Thus, each task is attributed a unique identifier thanks to the fact that, once posted, TinyOS tasks run in a first-in first-out manner and cannot preempt each other. By manipulating only binary files, iRace does not require any source file nor source code annotation to effectively detect data races. However, compiling the program with debugging information may help iRace generate more detailed debugging information on data races it reports.
6.2. Environment
We implemented and evaluated our technique on a system that runs the kernel 3.0 of the Linux operating system using an Intel dual-core 3.20 GHz and 4 GB of main memory. On this machine was installed TinyOS 2.1.0 [10] along with the nesC compiler 1.3.1, the GNU C compiler 4.6, the Java Runtime Environment 1.7, and the latest Avrora framework version 1.7.115.
Table 2 presents the characteristics and a brief description of the benchmark applications selected for our evaluation from the TinyOS 2.1.0 repository [10]. These applications are freely distributed with each version of TinyOS. The column “LOC” indicates the number of line of C codes generated by the nesC compiler after compilation, while the column “Int” contains the number of interrupts handled by each application. The number of shared variables for each program appears in column “SV.” It is worth mentioning that this number represents only the shared variables in the source code of each program. The exact number of variables shared by each application may finally depend on the number of components it shares with the operating system itself. Applications written in nesC share TinyOS components by wiring themselves to these components, increasing therefore their number of shared resources. We compiled each application for the Mica2 platform and measured the average runtime overhead over five executions. The Mica2 motes are sensor network nodes based on the ATmega128 [30] microcontrollers. We configured Avrora to simulate a sensor network during 10 seconds allowing each application to run exactly for 73728000 instruction cycles. We set to five the number of nodes in the simulated sensor network.
Characteristics of the benchmark applications from TinyOS 2.1.0 [10].

6.3. Evaluation
For data race detection, we instructed Avrora to simulate a sensor network with five nodes while the benchmark applications are monitored by iRace. Table 3 represents the results of the evaluation of iRace on the benchmark applications in its column “Data Races,” which contains the number of shared variables involved in a data race for each application. Our tool reported no data race for all applications except for four:
Reported data races on the benchmark applications.

In the
Another data race reported both in
(1) async command error_t Resource.immediateRequest [uint8_t id] ( ) { (2) signal ResourceRequested. immediateRequested [resId] ( ); (3) atomic { (4) if (state == RES_CONTROLLED) { (5) state = RES_IMM_GRANTING; (6) reqResId = id; (7) } (8) else return FAIL; (9) } (10) signal ResourceDefaultOwner. immediateRequested( ); (11) ⋯; (12) }
In the case of
(1) command error_t Send. send[uint8_t clientId] (message_t * msg, (2) uint8_t len) { (3) ⋯; (4) queue [clientId]. msg = msg; (5) call Packet. setPayloadLength (msg, len); (6) ⋯; (7) }
6.4. Detection Overhead
In order to evaluate the impact of our technique on the monitored programs, we configured Avrora to simulate a single node sensor network. We then measured the average runtime overhead and memory space required by each application of the benchmark of Table 2 to execute 73728000 instruction cycles. The total overhead of our technique mainly comes from actions of the instrumentation engine, the labeling routines, and the race detection engine which also has the responsibility to create and maintain the access histories. The average execution time and memory consumption collected for each application are presented in Table 3. The columns “Original” and “iRace” represent the execution time and memory consumption for each application without and with iRace, respectively.
Figure 4, which plots the data from the column “Time” of Table 3, compares the average execution times of each application for five runs with and without iRace. The caption “Original” represents the native execution of the applications without iRace. The results of Figure 4 suggest that the average runtime overhead of our tool is only about 1x for all applications except for

Average runtime overhead.
Likewise, we measured the average memory consumption for each application during five runs. The collected data are represented in Figure 5. The overall average memory consumption of the tool is very small at just about

Average memory consumption.
6.5. Labeling Overhead
Since the race detection subcomponent of iRace is in charge of implementing the labeling and the detection routines, it was legitimate to analyze the impact of the labeling scheme alone on the monitored programs at runtime. For this purpose, we deactivated the detection engine of iRace before running it again on the benchmark applications. We collected the average execution time and memory space consumed by each application after five runs as shown in Table 4. The simulation was done using a single node network.
Average labeling overhead.

The states of an access history for detecting data races with our protocol considering the example of Figure 2.

Figure 6 compares the original execution time of each program from Table 3 with the execution time of the labeling engine as presented in the column “Time” of Table 4. The comparison shows that the average runtime overhead of iRace with just the labeling engine activated is only about 0.4x in the worst-case. This represents only a small fraction of the average runtime overhead of 6x imposed by iRace as discussed in Section 6.4. The main reason of this performance can be found at source level. When browsing the source code of the benchmark applications, we came to understand that programmers generally disable and enable all the interrupts at once instead of focusing on particular interrupts. In this case, the size of each label generated by the labeling engine never approaches its worst-case of

Average runtime overhead of the labeling engine.
We also compared the memory consumption of the labeling engine with the memory requirement of the original program execution presented in Table 3. The results plotted in Figure 7 show that when the labeling engine alone is running, iRace consumes only about
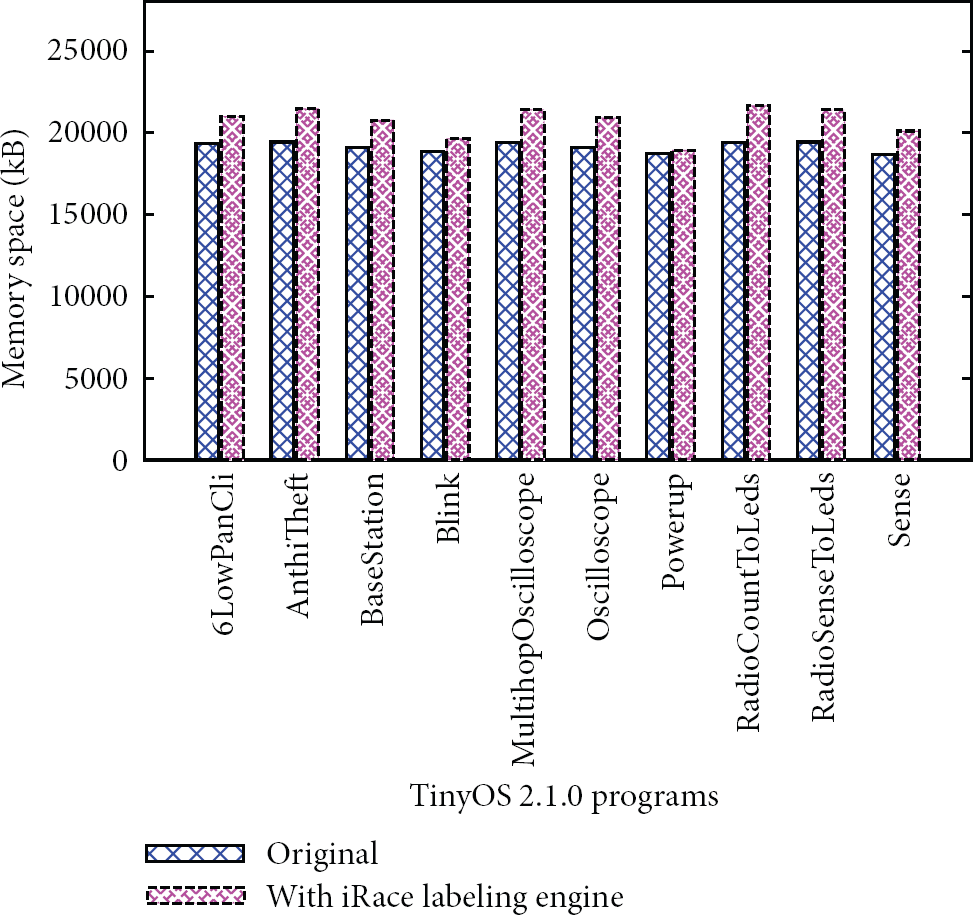
Average memory consumption by the labeling engine.
7. Conclusions
Asynchronous interrupt handling introduces fine-grained concurrency into interrupt-driven programs making them prone to data races. In this paper, we presented an efficient and scalable on-the-fly technique to precisely detect data races without false positives in such programs. Our technique introduced a lightweight labeling scheme for maintaining concurrency information for the main program and each of its interrupt handlers and a precise detection protocol that guarantees to verify the existence of data races in a program by reporting at least one data race for each shared variable involved in a data race.
We implemented a prototype of our technique as a race detection tool, called iRace, on top of the Avrora simulation framework. An evaluation of iRace revealed the existence of data races in some programs distributed with TinyOS and in some TinyOS components while incurring a slowdown of only about 6 times on average in the worst-case with an average memory consumption of only about
Detecting data races that occur first in a program is an important issue, since it may make other data races to disappear. It is therefore interesting to detect this class of data races in interrupt-driven programs to facilitate the debugging process. Also, we may be interested in extending our work to support multithreaded programs that handle interrupts and also to detect data races in low-level kernel codes.
Footnotes
Acknowledgment
This research was financially supported by the Ministry of Education (MOE) and National Research Foundation of Korea (NRF) through the Human Resource Training Project for Regional Innovation and BK21+ program.