
Abstract
The rapid adoption of wireless communication and sensors technology has raised the awareness of many laboratories about the field of network embedded system. Most researchers aim to exploit these advances to enable technological assistance of frail persons in smart homes. However, to reach the full potential of applications using network embedded systems such as assistive smart home, scientists need to work toward the creation of support services. In this paper, we present an accurate passive RFID localization technique, which can easily be implemented and deployed in various environments, coupled to a complete human activity recognition model. The goal of this paper is to demonstrate, through concrete experiments, that support services can enable powerful solution to long-lived challenges of the network embedded system community. Particularly, the model exploits qualitative spatial reasoning from RFID localization of objects in the smart home to learn and recognize the basic and instrumental activities of daily living of a resident. Our system was deployed in a real smart home, and the results obtained were quite encouraging. The developed RFID technique gives an average precision of ±14.12 cm, and the recognition algorithm recognizes up to 92% activities.
1. Introduction
The aging of the population in the developed countries [1] has engendered a crucial need for the development of new solutions to revolutionize the way the healthcare systems are perceived and operated. With the recent advances of wireless communications and technologies, smart home research [2] has positioned itself as an emerging trend to bring socially and economically viable solutions to some of the challenges brought by this new context. For example, these technologies could postpone institutionalization of cognitively impaired elders by providing punctual support services, security, and guidance to the resident. To do so, one must first be able to recognize the ongoing activities of daily living (ADLs) [3] of the resident from either visual information or raw data collected from various types of sensors. The former implies the installation of video cameras in the smart home [4, 5]. These systems suffer from the high complexity of identifying patterns in real time from a large flow of images. They also suffer from intrusiveness, which is hardly accepted by both the resident and the health professionals. Other works are trying to use emerging information from a variety of sensors such as the radiofrequency identification (RFID) technology to recognize the ADLs [6–8].
One important obstacle to the adoption of wireless sensor network as an embedded system in smart home is the lack of research on support services. Researchers are mostly building theories either by taking raw information from the sensor networks [9] or by making the assumption that they can get qualitative information (such as high level action) [10].
In this paper, we explore the employment of passive RFID to deploy an object localization support service for smart home and for other smart environments. While extensive research has been conducted within the field of robotic on this precise topic, we demonstrate that the literature is inadequate [11] to the context of object localization. Indeed, the majority of the works are exploiting active tags, which are battery powered but much more precise [12] than their passive counterparts. However, they are also bigger and clumsier and require timely maintenance due to their internal battery. On the other hand, the current passive RFID localization systems are mostly based on vast deployment of reference tags [13]. A tag of reference is a tag that is positioned at a specific known location and that provides a benchmark to localize another one. In some cases, these systems require up to 300 tags [14]. This makes their methods difficult to implement in the context of smart home like ours. Additionally, in the last few years, many researchers tried to address the core issue of localization by proposing systems based on a wide range of other technologies, such as GPS, ultrasonic wave sensors [15], and video cameras [16]. However, the RFID technology, because of its robustness, its low price, and its flexibility, seems to have imposed itself as one of the best solutions currently available for smart homes. Moreover, each of these other technologies suffers from great weaknesses such as the line-of-sight constraint [13] and high intrusiveness.
The development of an object localization support service could serve very well the dream of assistive smart home in many aspects. For example, such spatial information could help to overcome the human activity recognition challenge (HAR). The classical way to do so is generally by exploiting a range of logic formalisms such as first-order logic [10], ontology [17], lattice theory [7], or probabilistic models such as Hidden Markov Model (HMM) [6, 18] and Dynamic Bayesian Network (DBN) [19]. In recent years, researchers have focused on the probabilistic approaches since the activity models are easily learned from supervised [9] or, less frequently, unsupervised [20] data mining algorithms. The definition of activity models is, in fact, the major drawback of logical approaches. Nevertheless, they possess many other advantages. They are more predictable and understandable than probabilistic approaches. They also are more scalable to assistive systems. Nowadays, researchers [21] are noticing the importance of the largely ignored but fundamental spatial aspects of the realization of ADLs inside smart environments. An object localization service, such as ours [22], could enable the scientist community to refine qualitative spatial reasoning theories to learn and recognize both basic and instrumental ADLs.
In this paper, we present the results of our works [23, 24] on spatial aspects relating to the assistive smart home paradigm. More specifically, we explain in details the deployment of a multilayered approach to trilateration which exploits passive RFID technology. Our approach addresses separately each problem with the technology used such as the false readings and the varying received signal strength indication (RSSI). It also implements trilateration from an innovative elliptical wave propagation model and uses fuzzy linguistic variables to provide qualitative positions (in addition to simple Cartesian positions). We also propose a complete human activity recognition (HAR) solution that relies exclusively the spatial aspects extracted from our localization model. This model first needs to learn the activities' models while keeping the process simple and scalable. To do so, we extend a classical association rule mining algorithm [25] in order to extract spatial relationships, defined in the topological framework of Egenhofer and Franzosa [26], corresponding to each ADL. Thereafter, the newfound models are used within an activity recognition algorithm which is simple and easily implementable. Finally, we concretely apply it in real case study scenarios of ADLs. These scenarios allowed us to test the robustness of our new solution to classical anomalies that can occur when dealing with normal and cognitively impaired elders. Moreover, the tests were conducted at the new LIARA laboratory's smart home infrastructure, which provided realistic experimental conditions.
The remainder of this paper goes as follows. Section 2 reviews the literature in three parts: a part on localization schemas, a part on the spatial data mining, and a part on smart home and human activity recognition. Section 3 presents our complete positioning system based on passive RFID technology and the experimental results we obtained in doing single object localization. Section 4 introduces the learning model which is an extension of the well-known Apriori algorithm [25]. Section 5 presents the spatial activity recognition algorithm based on topological relationships that has been previously developed in [23] but adapted for this research. Section 6 describes the experiments conducted with the localization system to learn and recognize the ADLs. The results are analyzed by taking into account the granularity aspect of activities in smart home. Finally, Section 7 closes the paper with an overview of the work achieved, its limitation, and the future works.
2. Related Work
This section aims to overview the notable works that can be compared to our complete model. Since this paper represents the culmination of our research relating to various issues on the spatial aspects in smart home, the literature review is subdivided into three major axes. First of all, we shall see works on localization of objects, robots, and humans that emanate from a wide range of research areas. This subsection discusses the different hardware components used while emphasizing on works employing RFID technology. The second subsection discusses the classical activity recognition techniques in smart home context. Both the advantages and disadvantages will be discussed consecutively with their limitations. Finally, one of these limitations leads us to the third axe of works surrounding learning techniques in activity recognition and particularly those exploiting the spatial aspects of the data hereby called by the name of spatial data mining.
2.1. Literature on Localization
Since many years, the question of localizing entities in a controlled or in a noisy environment has attracted many researchers resulting in hundreds of scientific publications, which cover diverse topics and technologies. Despite this, localization of objects and persons inside buildings is still a challenging issue that could find applications in several areas. In particular, techniques related to RFID technology have been blossoming in the last few years. However, due to the inherent imprecision, positioning and tracking with RFID are still very hard to achieve. That is why many researchers explored hybrid approaches based on ultrasonic sensors, accelerometers, cameras, and LEDs. These works are outside of the scope of our approach that concentrates on pure RFID technology. We describe the main ones and explain why they are generally not well suited in smart home context. Thereafter, we present the most interesting RFID approaches.
2.1.1. Non-RFID and Hybrid Approaches
The most renowned localization system which is not based on radiofrequency (RF) is probably the one of Addlesee et al. [15]. It is one of the first successful systems that relies solely on ultrasonic sensors. In a controlled environment, it achieves a respectable precision of ≈3 cm which places it among the most precise indoor localization systems. However, it requires dense deployment of costly receivers installed throughout the ceiling of the targeted area. Choi and Lee [27] follow their work by hybridizing ultrasonic sensors to passive RFID. They unfold static and fixed tags at predefined positions (called reference tags) to infer the position of a mobile robot. They yield a much higher accuracy than any other RFID approaches (≈1–3 cm). However, sound based systems are limited by environmental conditions such as noise and obstruction of the line of sight. Hähnel et al. [11] have united an RFID reader with a laser range scanner onboard mobile robots. Their model starts by using machine learning to draw a virtual map of the environment with the laser. Despite its novelty, their system only achieves a high localization error of around 1–10 meters. Milella et al. [28] have combined vision sensors to the RFID technology to achieve a precision in the order of 20 cm. Sample et al. [16] is another work that exploits vision sensors. They enhance the tags with LEDs to enable a robot equipped with a camera to precisely find a tag in the environment. Recently, Parr et al. [29] introduced a novel method for RFID tag tracking by fusing an inertial measurement unit to a handheld reader. Their technique uses acceleration data, without the knowledge of antenna position, to achieve an accurate positioning at a reasonably low cost.
While non-RFID and hybrid approaches give better performances than pure RFID localization, they are arguably less appropriate in many situations. First, they are more costly than RFID approaches. Second, they rely on technologies that suffer from high intrusiveness (cameras are particularly prohibitive in our case). Third, they often impose line-of-sight constraints that radiofrequency avoids. Fourth, none of these systems offer robustness comparable to passive RFID tags. For example, they cannot be put into a dishwasher, and they can need batteries. They are also slower and harder to install than simple RFID methods. Finally, these technologies are too cumbersome for objects tracking inside home.
2.1.2. Active RFID Localization
As we stated in the introduction, RFID technology can be subdivided into two families: active and passive. Both have been the object of study for localization. Active systems are generally much more precise on the same environmental scale than their passive counterparts. For instance, Hekimian-Williams et al. [12] implement phase difference to achieve millimeters' accuracy in perfect conditions. However, they ignore key factors such as tag sensitivity. Moreover, active tags suffer from many weaknesses that refrain from using them into smart home. First, they are much bigger and, therefore, impossible to install on everyday life objects in the goal of localizing them. Second, they are considerably more costly. Above all, they work with batteries that require timely maintenance, which is to be avoided in smart home. Since phase difference is hardly usable with passive technology, the work of Hekimian-Williams et al. [12], which is still an important contribution, would be better off being used in an adapted context.
2.1.3. Passive RFID Localization
There are a large number of positioning approaches based upon the use of passive RFID tags. A substantial part of them arises directly or indirectly from the well-known LANDMARC system [30]. That system introduced the concept of localization from references tags placed at strategic location. Vorst et al. [31] is one of them. Their model uses passive RFID tags and an onboard reader to localize mobile objects in an environment. A prerequisite learning step is required to define a probabilistic model. This model is exploited from a particle filter (PF) technique, which estimates the position. It achieves a precision of 20–26 cm. The major drawback is the relatively high computational cost (at least for online tracking). Lei et al. [32] addressed this issue by combining PF with weighted centroid localization. They switch between the two methods depending on the estimated velocity of the tracked object. In ideal condition, they localize an antenna with an average error of 20 cm while greatly increasing the speed of the process. Another model, from Joho et al. [14], uses reference tags in combination with different metrics. In particular, they are based on both the RSSI and the antennas' orientation to get an average localization error of 35 cm. Chawla and Robins [13] developed a model based on the variation of antenna power to estimate the distance of nearby reference tags. They incrementally adjust the antenna decibel until the tag is in range. Thereafter, they use many tags' distance from the antenna to localize a mobile robot. Their approach yields an accuracy varying from 18 to 35 cm.
Some of these approaches provide very good results, more than enough to exploit them as support services for smart homes. However, they all rely on the large deployment of tags of references. While it is a fairly good solution for robot localization, it is not very appropriate nor always feasible in smart home context. In fact, for our technology to be adopted, the modifications to the environment need to be minimal and such an installation of tags would be rather unwelcomed by the residents. Additionally, doing so is a complex and tedious task. Finally, in our case, we want to achieve everyday life objects localization (cup, book, etc.). The previously described techniques localize antenna with tags. Antennas are much too big to be bundled on objects. Therefore, there is a need for a precise, yet easily configurable localization model to support smart environment.
2.1.4. Approaches Based on Trilateration
The best alternative to references tags based systems for passive RFID localization is the antennas' trilateration from the RSSI. Despite the potential and the simplicity of the method, trilateration has been largely ignored in the scientific literature. This is mainly because this technique is quite challenging to use with noisy and imprecise information. A recent instance of an RFID localization system based on this technique is the approach of K. Kim and M. Kim [33]. They perform a classical trilateration calculus from active tags by using the time of arrival of the signal to calculate the distance from each antenna. Still, their main contribution is from the introduction of a circular polarization antenna and a positioning filter. Another worth mentioning is the approach of Chen et al. [34] that perform trilateration with a different radiofrequency technology (ZigBee). They develop a fuzzy inference engine with one variable that correlates the RSSI of an object transmitter to the distance separating it from a receiver. They achieved a precision of 119 cm.
These approaches are much less precise and robust than those reviewed in the previous section. The new model we propose in this paper is also based on the trilateration but still outperforms most of the existing localization techniques, including those relying on references tags. Moreover, it is purely based on passive RFID and does not bear the disadvantages associated with hybrid technology and batteries powered tags. Furthermore, many systems that presented comparable results were tested in unrealistic condition [12] or only in simulation [35].
2.2. Human Activity Recognition
A lot of work has been done in the field of human activity recognition (HAR) due to the crucial importance of the problem to pervasive computing community. A majority of it has been conducted with the exploitation of video cameras [4, 5, 36] by extracting features and patterns on a spatiotemporal point of view. These approaches are invasive and are hardly accepted by residents of a smart home. Moreover, in the context of assistive smart home for frail and cognitively impaired persons (such as for residents afflicted by Alzheimer's disease) it is not unknown to researchers and physicians that invasiveness can worsen the state of the resident and that it should be avoided [37]. Noteworthy to say, we are not the first to mostly rely on passive RFID technology to perform recognition of human ADLs. The data centric approaches to HAR of Smith et al. [8] and Patterson et al. [19] are pioneers on this matter. Their respective works were a good step forward but suffer from similar problems than most previous systems. They require the resident to wear a glove or a bracelet. We prefer to avoid wearable sensors. It is hard to ensure that the residents always wear them if we are ever able to convince them to accept such method.
2.2.1. Logical HAR
The formal theory of plan recognition of Kautz [10] constitutes a foundation to logic based HAR algorithms and is still one of the most important in this branch. It has inspired many other works such as [7] that exploits lattice theory to model the ADLs. Kautz's theory formalizes the process of inference of the ongoing activity by using first-order logic. The theory is limited by the assumption that all possible activities are known and that basic actions can directly be observed. Chen et al. [17] recently proposed a new system that exploits ontology for explicit activity and context modeling. Their approach is very comprehensive and partially addresses the real-time recognition dilemma. Likewise to other purely logical approaches [7, 23], the way they model the ADLs and perform the inference is elegant and natural to understand for a human being. Logical approaches to HAR mostly suffer from the tedious works required to model ADLs correctly. It does not only result in high overhead but also greatly limits their real-world applicability.
2.2.2. Probabilistic HAR
Many teams have explored the utilization of probabilistic theories such as Markovian and Bayesian models [6, 18, 19] to address human activity recognition in smart environment. These algorithms provide good recognition rate (RR) and are usually combined with learning techniques. These approaches are simpler to implement than those based on formal logic but suffer from many drawbacks. First, they are generally harder to scale up to assistive system and are unpredictable. Particularly, building large activity library is very fastidious even with the help of learning methods. Second, inferring with them requires high computation (resp.,
Finally, there are still many problems with the state-of-the-art algorithms. Most of the existing approaches only recognize high level activities (cooking, toileting, etc.) which does not allow to assist a resident at every step of his daily activities. In addition, a majority of these approaches gives no clue as to the performance for online recognition of ADLs. In this paper, we present a recognition algorithm that we developed in [24] and that we adapted to integrate our new RFID localization technique, which not only has good recognition rate but also promptly identify the ongoing ADL.
2.3. Data Mining and Learning Models
To address the difficulty of building library of activities, many researchers have worked toward the development of learning schemes. In recent years, a plethora of supervised approaches have been developed [39, 40] such as the one of Van Kasteren et al. [9]. In their work, they exploit a learned Markovian model and conditional random field to perform coarse-grained recognition of activities. Their model achieves a recognition rate of 79.4–95.6%. Supervised learning is mostly limited by the requirement of hand labeling of activity data to perform the learning phase. Van Kasteren et al. [9] partially address this issue by unfolding a voice recognition system to annotate the data during the realization of daily living activities. Completely eliminating the human intervention in the process constitutes a difficult challenge to overcome.
Completely unsupervised methods could address this problem since they rely on unlabeled data. However, they have found only little traction in the field due to the inherent challenges of HAR. Nonetheless, one can find some recent examples of them [20, 41]. All the real unsupervised approaches we found solely rely on web mining to extract models of activities. For instance, Palmes et al. [41] scour the Internet to get models based on object relevance weight. This technique defines an influence score on each object that is part of an activity and chooses the one with the highest weight to define it as a key object. Though their approach offers great scalability, it is limited by the fact that two activities cannot define the same key object. That prohibitive property enables their method to offer only very coarse-grained recognition. Moreover, they have significantly lower recognition rate than other works and an unrevealed online recognition performance [20]. Finally, the benefits of the existing learning based approaches (supervised or not) are limited by the very large number of data required by these works to perform acceptably. Moreover, some of them report using months of data corresponding to only few thousands records [9], which is probably due to a prior formatting of the sensors' information for which we have no clues about the level of human intervention required.
2.3.1. Spatial Data Mining
Since the approach presented in this paper particularly focuses on spatial aspects, we thought it would be necessary to talk a little about the field of spatial data mining. Most of the works have been conducted for geographical information systems (GIS) where large spatial database are standard. In these conditions, extracting useful spatial patterns is significantly more difficult than traditional mining [42]. A representative work that could be compared to us is the one of Koperski and Han [43] that is based on association rules mining to extract relationships between spatial and nonspatial predicates. Their work is particularly interesting because it is based on the assumption that the user has general knowledge about what he is looking for (which is our case). However, we cannot use the same solution than Koperski and Han [43] for our learning phase, since we want to purely deal with spatial entities (see Section 4). In our case, the learning problem is different and simpler than those addressed in the most important spatial data mining publications [42–44]. Existing approaches are simply not adapted to our context. They are built to extract knowledge from large-scale GIS and spatial database.
There is still a lot of work to be accomplished in the field of HAR and on its learning complement. The majority of the solutions suffer from important additional drawbacks. First, they provide the offline recognition rate but just exceptional case [17] give information about the online recognition of ADLs. Second, except for some logical systems, these works give (good) results on coarse-grained activities only. In many situations, we want to obtain more precise information on what the subject is doing (e.g., cooking versus preparing spaghetti). Thirdly, many systems use prohibitive technologies such as wearable sensors [39] or, worse, video camera [4, 5, 36]. Finally, human activity recognition is an important challenge to the implantation of smart environment and would greatly benefit from development of flexible localization service for daily living objects. We demonstrate it in this paper with the description of a hybrid recognition model that possesses the advantages of a logical recognition approach and the advantages of learning based methods. It is simple, efficient, and very predictable and requires only little human intervention to model the ADLs. Moreover, compared to other supervised works, our system does not require manual labeling since the learning phase is done from few individual performances of each activity to learn. It is possible only due to the simplicity of our ADLs models that are defined by generic and intuitive topological relations, which are extracted from the information on the position of objects in real time.
3. Elliptic RFID Trilateration
As we said during the introduction, the main contribution of this paper is the development of a passive RFID trilateration technique [22] as a support service for network embedded systems and more particularly, for smart home infrastructures. This model implements multiple filters that each addresses an issue arising in the process of localization with passive RFID. This section explains the algorithm that was published in [22].
3.1. Iteration Based Filter
The first challenge of RFID localization takes place at the basic step of information collecting; it is very common to obtain false-negative reading (FNR). An FNR occurs when a tag is in the antenna coverage area but is not detected during a certain period of time. That type of problem happens in all the passive RFID systems we tried through the years considering that it happens slightly more frequently on inexpensive systems. Brusey et al. [45] identified three reasons to explain this situation:
the reader can fail to see all tags for a certain time due to an unknown internal problem, RF emitted from more than one tags may collide, an interference might occur due to environmental emissions or due to surrounding metal shielding.
From the same paper on RFID localization systems [45], we found an inspiring solution. That leads us to the creation of an iteration based filter whose goal is to remove most of the false-readings problems (even the less frequent false-positive readings). The filter is based on the general rule that if an object's presence is expected in an antenna range, it is considered as not present only after no detection has occurred for a number of localization iterations. An iteration is a fixed time interval at which the system performs the localization. We fix the time because we prefer stability in the reading (more predictable behaviors) over faster speed. In our smart home infrastructure, iterations are performed every 200 ms, which is fast enough to get a good precision without being overwhelmed by the RFID data gathered. Here is the new function, denoted by
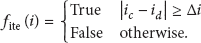
This function enables us to update the state of an RFID tag (detected/undetected) by subtracting the first detection iteration of the nw state ( Iteration 2: X is read, |2 − 2| ≥ 1 = false, no change. Iteration 3: X is not read, |3 − 3| ≥ 1 = false, no change. Iteration 4: X is read, |4 − 4| ≥ 1 = false, no change. Iteration 5: X is read, |5 − 4| ≥ 1 = true, X is now detected. Iteration 6: X is not read, |6 − 6| ≥ 1 = false, no change. Iteration 7: X is not read, |7 − 6| ≥ 1 = true, X is now undetected.
3.2. Gaussian Mean Weighting Filter
The second important problem with RFID technology is the one for which trilateration has been disregarded. Without moving a tag, the RSSI changes greatly every iteration. We propose to reduce the amount of flickering by applying a Gaussian mean to the RSSI received by the antennas before using the information. In our implementation, the bell-shaped curve is centered on the current iteration number

3.3. Elliptic Trilateration
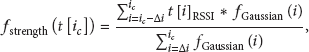
Our first attempt [24] to build a trilateration based algorithm considered that the wave propagation was circular (normal way to perform it, in fact). However, since our antennas are directional, the loss of signal on the side is higher. Therefore, when converting the RSSI to a distance value, we were less accurate on the side of the antennas. To address this problem, we decided to replace circular models by elliptical. It comes down to establish ellipse equations (4) in function of the RSSI parameter. To do so, we collected data series for each axis by moving away a tag directly on the side of an antenna and directly on the front. By using the method of polynomial regression (degree 2), we determined two extremely useful equations (5)-(6). The first one returns the value of the major axis (


With these equations, from the RSSI received by each of our antennas and their respective positions, we are able to establish the different equations of the ellipse for each of the antennas. From the point of intersection of three or more antennas, we should always be able to find the two-dimensional position of an object. Moreover, if two antennas are on the same wall, they should be enough to determine it. However, due to the imprecision of the RSSI, we often have more than one point of intersection. In our testing environment, we have four antennas and to improve the precision of the method, we decided to find intersection points from each possible pair of antennas (6). The intersection points are found by solving an equation of second or fourth degrees depending on whether the pair of antennas is on the same wall or not. In the first case, the equation is quadratic and straightforward to solve (A1-A2, A3-A4). On the other hand, when we try to find the intersection points of two antennas located on opposite walls (A1-A3, A1-A4, A2-A3, A2-A4), we have to solve a quartic equation and to this end, we implemented the well-known method of Ferrari. Therefore, we end up with five possible situations. For each pair of ellipses, we obtain between 0 and 4 points of intersection.
3.3.1. Delta Filter
The situation when there is no point of intersection is undesirable for us and considerably reduces the accuracy of our system. Furthermore, it happens very often. We designed a simple algorithm named the delta filter to manage these situations. The algorithm gradually modifies the original shapes of each pair of ellipses in a logical process until they have at least one intersection point. The rate of variation is modulated in function of the RSSI since a stronger signal is normally more accurate than a weaker one. The application of this filter gives us 1 to 4 points of intersection for each pair of ellipses. We eliminate all the points that correspond to a complex number or those outside the eligible area (the kitchen). Finally, when there are 2, 3, or 4 possible values for a pair of ellipses, we take their arithmetic average to create a unique point. Algorithm 1 summarizes the whole process.
them to them to end them to end end return
3.4. Multipoints Filter
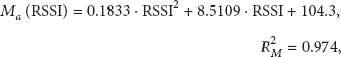
From the elliptic trilateration, we obtain generally several points. Each of them is supposed to represent the actual position of the tracked object. As we said before, the stronger RSSI means usually a higher accuracy. Consequently, we determine the estimated position by taking this into account with the multipoints filter. Its first step is to attribute a weight to the points extracted from each pair of antennas in function of their received signal strength indication. The antenna which received the stronger signal gets the stronger weight. The matrix in Table 1 shows the weight attributed to a pair considering that number 1 to 4 represent the rank of an antenna by RSSI.
The multipoints filter matrix.
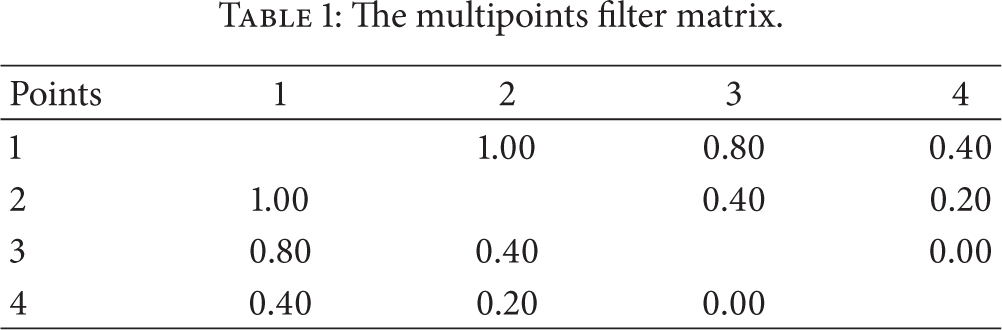
For example, if a point is obtained by the intersection of two ellipses that have the strongest RSSI (positions 1 and 2), then this one will receive a weight of 1.00. Finally, these points and their respective weights are used to compute the actual (final) position of the tracked object. This calculation is done by using the function 
In this function,
3.5. Fuzzy Localization
In our earlier attempt at trilateration [22, 46], we determined that in many situations Cartesian position of an object would be harder to deal with than qualitative information. Therefore, we decided to divide the localization environment into small zones where an object could be in or not. We chose to divide the smart home into a square zone of 900 cm2 (
We need to stress that this part of the localization is optional; one should exploit it when intuitive and qualitative positioning is better suited than more precise but less stable solution. The example application for this support service described in this paper needed Cartesian positioning to work adequately, but we use the fuzzy module in other systems.
3.5.1. Fuzzy Linguistic Variable
The fuzzy inference engine uses three fuzzy linguistic variables to reason about the zone membership. The first one represents the data we try to infer. The Likeliness of an object's membership to a zone is ranged from 0 (Not likely) to 100 (Very likely). The reasoning on the likeliness is made from two other FLVs. The first shows how strongly an object is in a zone. That is given by comparing the approximate Cartesian position determined from the trilateration step with the Cartesian coordinates of the center of the zone for which likeliness is being calculated. For example, if the object is positioned directly in the center of the zone

The FLVs likeliness, distance, and last detection of an object.
Finally, Figure 2 which represents our smart home kitchen, and the four antennas on the walls, gives an overview of the system. The big black square represents the estimated Cartesian position. The three smaller squares represent the estimated zone by the fuzzy logic module in order of likeliness.
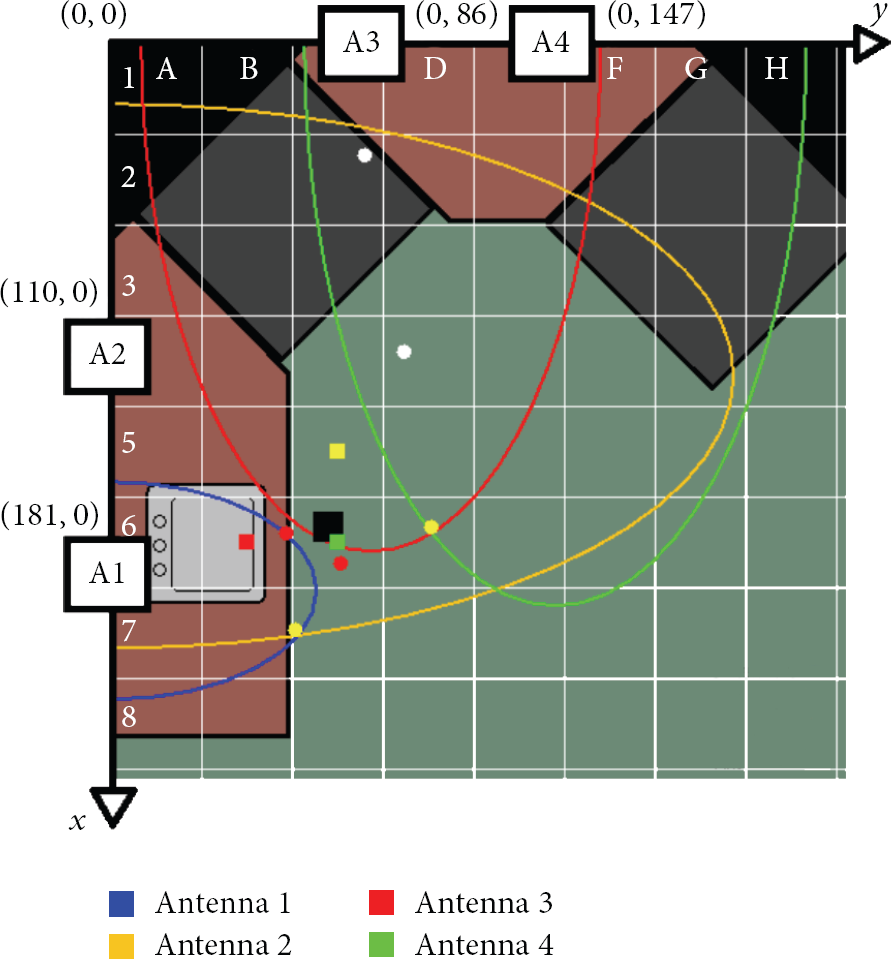
Live tracking console positioning an object in C6. The black square is the final absolute position.
4. Discovering the Spatial Activities
For this paper, we decided to try our new trilateration algorithm with a complete hybrid recognition model recently published in [24]. These approaches rely solely on qualitative spatial reasoning to perform recognition and thus constitute a good testing ground for our localization algorithm. In this section, we present the learning of the topological relationships which is the prerequisite step to the recognition phase. The summary of the learning phase is as follows. We first have to collect position of the smart home entities with the help of our positioning systems. Then, the second phase of the method is to determine the spatial relationships and create automatically a transactional learning structure according to the chosen algorithm (Apriori, in this paper). Finally, valid rules are automatically retained to model the activity. The overall solution can be seen on Figure 3.

Overall learning phase of our system.
4.1. Spatial Reasoning
The first step of the learning phase consists of gathering spatial information from a smart home. We are interested in three kinds of Entities (
From the obtained spatial information, we decided to deploy the topological framework of Egenhofer and Franzosa [26]. This framework has been created for the research on Geographical Information Systems (GIS). In this work, spatial entities are defined as a set of points either contained in the boundary (∂) or in the interior (°). The framework defines the possible relationships between two entities

Topological relationships between physical entities A and B.
There are few significant adaptations we decided to do to the framework. First of all, we prefer not to use mathematical point as primitive. This is mostly for complexity consideration, but a detailed discussion can be found in [47]. Therefore, we define the region representing the entities as being a circle equation. The boundary of a region is also a little different from a topological perspective. The boundary includes the coordinates that fall under (8) where ε is a threshold fixed for all different sizes of regions and 
Second, since we seek to reduce the human workload, we do not want to have to precisely calculate region size for each type of object. Hence, the region associated with object entities are qualitative (small, medium, large). The regions are also bigger than the objects (twice the radius of the smaller object that fall under the category) because we want a higher number of possible relations. If we take the exact size of the physical objects, they could clearly not be overlapping. With a larger number of types of relationships possible, our activity models are more expressive. Finally, to reduce the number of calculations, our system determines the relationship between two entities by using the distance between their Cartesian position and the radius of both regions. Figure 5 shows two examples of how it is done in our model.

Identification of the type of spatial relationship with
4.2. Extracting Spatial Knowledge
The next step in the learning phase consists of defining how our activities can be generally represented with those relationships. In our model, we want to define a set of constraints K with respect to (9) for all ADLs we want to be able to recognize. 
In other words, we want to extract representative relationships between entities of various types: objects (O), resident (R), and area (A). Association rules mining algorithms are well suited for this type of situation since their goal is to extract strong relationships between elements in a large transactional database. In previous work [24], we tested different algorithms, but we found out that Apriori [25] is excellent for the task. It is directly extended in our system, and from the data formatting to the extraction of a set of rules, everything works automatically. Table 2 shows examples of such rules.
Examples of extracted rules.

These rules represent the activity Make Coffee. In Section 5, we show how they can be used to recognize it. The observed relationships during an iteration each represents a transaction in the training data structure. Besides, patterns are not that frequent. Therefore, we have to select a low confidence value for Apriori (≈15–25%). The confidence of a rule is based on calculation of the support. The support is simply a constraint of appearance of a pattern in the whole set of data. From it, the confidence is calculated with (10),

In the equation, X is the rule antecedent(s) and Y the consequent. Once we have extracted the rules, it is necessary to filter the standard results in order to select only the valid ones (corresponding to the format of Table 2). This step is an integral part of the extended algorithm and does not require a human intervention.
5. Human Activity Recognition
In the previous section, we have defined our new trilateration approach and how we could automatically model a knowledge base from topological relationships between entities of the smart home from it. To perform recognition of ADLs, we exploit a third algorithm (a modification of [23]) that intuitively works by matchmaking the spatial observations made during an iteration to its knowledge base. The overall process is illustrated on Figure 6.

The recognition algorithm process.
5.1. Spatial Observation
The first step of a recognition iteration is to observe the environment. We suppose that we have a functional smart home with a reference initial state. Then, the observations are made on entities that change the environmental state. Particularly, two types of relations interest us (the same we learned): pair of objects (
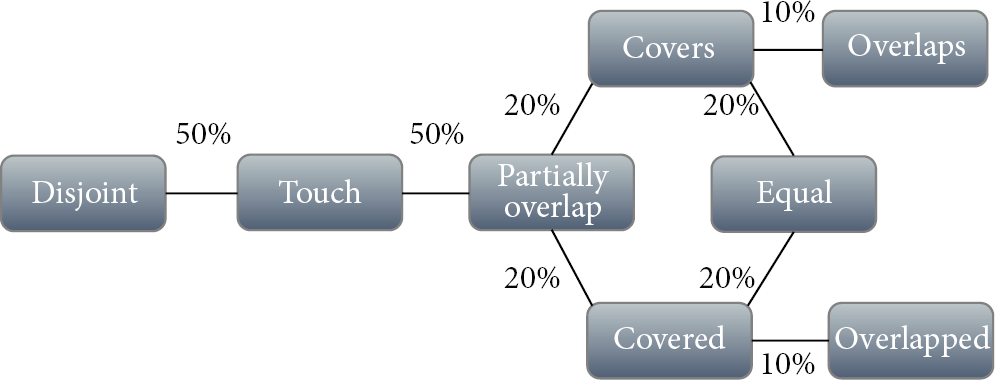
Neighborhood of the topological relation.
For example, if the defined relation in the knowledge base is 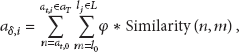
5.2. Choosing the Ongoing ADLs
The second step of the recognition algorithm is to circumscribe the knowledge base to find the ongoing activity. In other words, it has to choose which ADL best explains the observations made up until the current iteration. The plausibility of an activity after 
That is, the plausibility of a is the sum of all the points gained modulated by an inverted exponential function. The constant parameter 
Having a set containing the normalized plausibility of activities is very useful for the step of hypothesis formulation. The algorithm only has to select the activity with the highest plausibility.
6. Implementation and Experiments
For this research, we conducted two sets of experiments at our laboratory. The first one, which we describe in the next subsection, was conducted to test our new trilateration algorithm and was published in [22]. The second set consisted of integrating the trilateration algorithm in to our spatial method to learn and recognize activities of daily living. We describe the tests in Section 6.2 that had as objective to demonstrate the usefulness of the trilateration method. Larger experiments on this new learning and recognizing method have been published in [24], but they did not use the elliptic trilateration which was not mature enough at that time. These experiments were all conducted in our smart home that is equipped with more than a hundred of different sensors and effectors, which enable us to conduct various kinds of experiments. In particular, we possess 8 RFID antennas/readers in the apartment to track the position of the objects. These A-PATCH-0025 antennas of the company Poynting were designed to be waterproof and easy to install. To increase their effectiveness, the antennas are placed strategically to cover specific areas. Of these, four antennas have been installed on the kitchen walls which is the zone chosen for our experiments. The kitchen is a logical choice because it is an area where there are multiple objects and where precision is important to achieve good recognition of ADLs. We have incorporated tags to approximately all objects of the smart home taking care to select tags which had relatively the same sensitivity [13]. Figure 8 shows a cluster of images from different parts and angles of our smart home.

The smart home's kitchen.
6.1. Experiments on the Localization System
In order to challenge our new tracking system and test its accuracy, we have established an experimental setup which fairly represents the reality smart environments. We wanted to cover as much space as possible and a wider variety of zones in the kitchen. This includes the two counters of
We established a detailed experimental protocol to obtain meaningful results. We placed the object in the center of a zone, and then we recorded all the data from the database (the RSSI returned by each tag) for at least 400 iterations (80 seconds), and we repeated this recording process for each of the available zones of the kitchen. Data's recording allows us to compare more precisely the different algorithms by eliminating the variations in the antennas' reading. Therefore, we can easily compare the efficiency of the proposed filters by using different configurations of the algorithm. For example, we can easily remove the Gaussian Mean Weighting filter in order to verify its effectiveness with exactly the same data.
6.1.1. Analysis of the Results
The objective of the first series of tests was to confirm that each filter contributed to improve the model's effectiveness. To this end, we changed the configuration of the algorithm by using the same data. A first series was obtained using trilateration with circle and no filters to give us a benchmark and progressively, we added filters until the final configuration of our model. The obtained results are presented in Figure 9. Note that for each configuration, they are presented in terms of proximity from the center of the zone in centimeters. What should be first noticed is that the elliptical trilateration with all filter is much better than the other configurations. Another interesting element on the graph is the performance comparison between the circle and the ellipse model. We can see that even without the delta filter the elliptical version works better. It confirms our predictions and the contrary would have been surprising since our antennas are directional.

Accuracy under various configurations.
At the light of these results, it is clear that each proposed filter improved the performance of the algorithm. In summary, on more than 1600 iterations and with an elliptical model and all filters activated, we obtained an average accuracy of ±14.12 cm and with the same settings but with a circular trilateration, the accuracy was reduced to ±32.52 cm. The Gaussian Mean Weighting filter also greatly improves the accuracy. With this filter, the effect of the fluctuation in signal strength is considerably reduced. Furthermore, as a result of the activation of the Iteration Based Filter, most of the aberrant false readings were eliminated. Without this filter, the performance would be unstable and the accuracy lower. The delta filter helps to find points that are, in some situations, crucial for a proper localization. Often, ellipses are very close one from the other, but they do not intersect. Therefore, if we do not use this filter, these points would be ignored, and the position would be less accurate. On the other hand, the multipoint location filter assigns different weights to the points of intersection; it modulates their value according to their accuracy. After a full analysis of these results, we can conclude that each of these components is effective, but their combination provides good stability with a high-accuracy rate.
The improvements brought by fuzzy logic filter are more subtle to quantify. Indeed, by combining this module with the History Fuzzy Zone filter, we found that it can remove up to 71.43% of the zone changes that are unnecessary when an object is in a critical location (i.e., almost between two zones). In addition, the module also allows us to retrieve other data that can be useful for some types of algorithms. Indeed, the module returns us not only one zone but many that are ranked in order of likeliness. We are therefore, able to know the zone with the second highest desirability, and this information is even more interesting. In fact, we carried out some tests and when the algorithm does not position correctly the tracked object in the right area, 62.93% of the time, the second area identified by the fuzzy logic module is the correct one.
6.1.2. Comparison with Results Presented in Related Works
As we have seen in Section 2, there is a plethora of localization algorithms in the literature. Many possess their own advantages in their context of application over our method. Nevertheless, compared to other approaches, our model requires less equipment to be deployed and to be functional since we did not use reference tags [11, 13, 14, 31]. Indeed, without these tags, one does not need to perform calibration and precise installation in a new environment. Speed is also another very important criterion to evaluate performance of a localization system. A fast system will be more likely to perform well with the tracking of moving objects. On a standard personal computer, we can track an object in only few milliseconds. The system's speed is, however, limited by our RFID hardware (200 ms). In addition, some of the filters slow down the changes a little bit to around a second. Still, most of the others have not reported the speed of their system, and from those that did it, we are faster [13, 31]. Finally, our system is not only faster and more flexible than other approaches, but it is also more accurate. In fact, we obtained an average accuracy of ±14.12 cm over an area of 6 m2. Of course, there are existing active RFID [12] or ultrasonic systems [15] that more precisely localizes objects, but as argued in Section 2, these technologies present many disadvantages (need batteries, robustness, cost, etc.) that make them difficult to use at a larger scale in smart homes. Table 3 presents a summary of the comparison with the main systems.
Summary table of different location systems.

6.2. Recognition of Daily Activities
The second phase consisted of integrating the new enhanced trilateration method into the complete activity recognition solution presented throughout Sections 4 and 5. The knowledge base of the first version of this algorithm contained ten activities [23] completely defined by an expert. However, to validate the performance of the approach presented in this paper, this time it was entirely learned with a version of the extended Apriori exploiting the spatial data extracted by our trilateration method. The learning phase of our experiments necessitated performing all activities three times for a total time of 112 minutes (3.7 min/activities) and approximately 163 thousand lines of data in total (which RFID accounts for the most part). The number of performances could have been less for simpler activities such as reading a book, but for consistency, we decided to standardize the learning phase. The algorithm was run on each dataset and 41 valid rules were mined (the whole knowledge base). The tens activities that were learned are Make Hot Chocolate, Make Coffee, Make Tea, Make Cold Chocolate, Read a Book, Watch TV, Wash Hair, Get a Bowl of Cereals, Make Spaghetti, and Make Macaroni.
6.2.1. Analysis of the Results
We tested thoroughly our method on a selection of four similar ADLs that were accomplished in the smart home infrastructure. We needed ADLs that had at least few objects movement involved to see the improvement or our method compared to the literature. As you will see, the new model can easily distinguish very similar activities. Traditionally, the metric used to evaluate recognition of activities is the recognition rate which is the rate of success of the recognition for a sequence of observations. From that standpoint, the learning and recognizing method deploying our trilateration algorithm got 84% recognition (10/12). This result is excellent considering that our algorithm was not optimized to get the most of the new precision. However, the recognition rate is incomplete because it ignores the fact that some algorithms perform online recognition while other does it offline. In our context, some overlook that we need to recognize ongoing ADLs as fast as possible. We choose a new measure that we call the correct duration rate (CDR), which is the percentage of the duration of the activity during which the algorithm formulated the correct hypothesis. This measure should be accompanied by the speed at which the algorithm proposes a new hypothesis (our spatial one give new hypothesis every 500 ms). For example, if the algorithm's hypothesis was correct for 10 on 20 try in the last ten seconds, then the CDR equal 50%. Obviously, the CDR cannot be 100% since during the realization of an activity there is a long period where nothing happens. The result of the recognition can be seen on Figure 10.
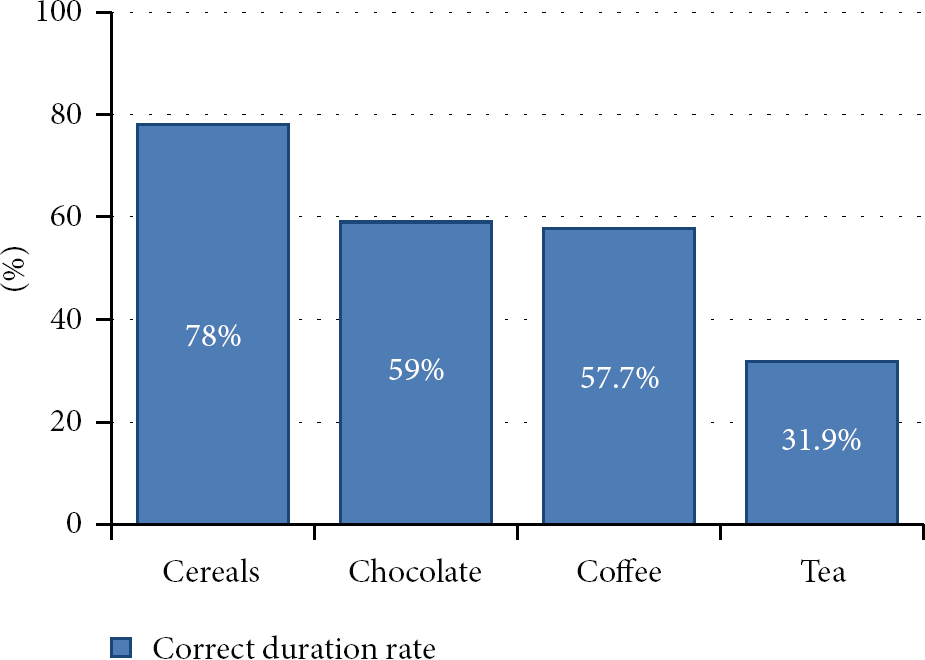
Correct duration rate.
It is noteworthy to say that these ADLs correspond to fine-grained activity recognition and that most systems in the literature cannot differentiate between them. As you can see the CDR is good for all activities, but the Make Tea activity was harder to distinguish. An interesting point here is that most of the time the algorithm was wrong, it was confused with the similar activities. In particular, if we had used Make Beverage instead of Make Coffee, Make Tea, and Make Hot/Cold Chocolate, the CDR would have been near 80%. Finally, we are positive that our recognition approach could have been improved to take advantage of the much better accuracy provided by the new trilateration method, but the goal of these experiments was to demonstrate that such algorithm could gracefully be integrated into smart home algorithms. Moreover, our knowledge base was maybe a little bit small to see completely the effects of a better tracking system. With a greater number of possible activities grow the importance of having a well-defined model to distinguish between the possibilities.
7. Conclusion and Future Work
In this paper, we described our new elliptical trilateration system based on passive RFID technology. We presented the results of our experiments with it in real smart home context and compared them with the most advanced approaches in the literature. This new model possesses several advantages in the context of smart home since it does not rely on costly, invasive, or hard to deploy technologies. We demonstrated that each of the developed filters addressed a crucial problem in the trilateration process and the potential applications of such method. Secondly, we described a new learning and recognition method for the activities of daily living. This model relies solely on spatial information and integrates the new trilateration method in order to track the smart home objects in real time. We tested it in the smart home from a knowledge base of ten learned activities, and we obtained important improvement over the latest version of our algorithm, which implemented standard trilateration.
Despite our promising results, there still remain some limitations that we need to work on in the near future. First, we need to test our system on a larger scale, with much more activities and a greater number of test. Also, it would be interesting to address the problem of three-dimensional localization. Such an information could be strategically exploited by a recognition method to draw more accurate profile of the activities.
Footnotes
Conflict of Interests
The authors certify that they have no interest of any form in the company “Poynting” cited in the paper. None of them have direct financial relation with the trademarks mentioned and the company was mentioned for the sole purpose of reproducibility of their experiments.
Acknowledgments
The authors would like to thank their main financial sponsors: the Natural Sciences and Engineering Research Council of Canada, the Quebec Research Fund on Nature and Technologies, and the Canadian Foundation for Innovation. They would like to thank their health regional center for providing them the Alzheimer participants in their experiments. Finally, special thanks go to their neuropsychologist partners and the graduate students who indirectly worked on this project by supervising the clinical trials with patients.