
Abstract
Three-dimensional numerical tests have been conducted to investigate the failure process of surrounding rock mass around circular and U-shaped tunnel at depth. Different failure modes of deep underground openings have been reproduced. The influence of different shapes and sizes of tunnel section, as well as the direction of the maximum principal stress, on zonal disintegration was analyzed. Numerical simulations show that failure modes and load-bearing capacity of tunnel depend on the direction of the maximum principal stress. The zonal disintegration around deep underground openings is a phenomenon that only occurs under some special conditions. Firstly, there must be a higher horizontal tectonic stress along the axial direction of tunnel; secondly, the radius of curvature of tunnel should be large enough to induce the tensile stress higher than tensile strength of rock mass. Therefore, the direction of tunnel axis as well as the direction and the size of tectonic stress should be carefully considered during tunnel design.
1. Introduction
Due to the rareness of resources in shallow area, the mining activity is developing into much a more deeper area. In China, in the future 10–20 years, many mines will be under 1000 to 2000 m, while some mines in South Africa, Canada, America, and Australia are already under 1000 m below the ground surface. According to the incomplete statistics, the mental mines over 1000 m in depth are more than 80 and most of them are in South Africa, such as the deep mine of Anglogold Limited Company, the depth of which is over 3700 m. In India, the depth of 3 mines in the Kolar Gold Mine is already over 2400 m. The rock mechanical problems in the deep underground mining industry have provoked the interest of many researchers, especially the zonal disintegration phenomenon [1]. The zonal disintegration refers to the phenomenon that, after excavation, there were some alternating regions of fracture zones and relatively intact zones around or in front of the working face. This failure mode is quite different from that in shallow depth, which is classified as fracture zone, plastic zone, and undisturbed zone, in sequence.
During many deep underground mining activities, the zonal disintegration has been confirmed by different kinds of geophysical prospecting means. In the 1980s, Shemyakin et al. [2–5] found the zonal disintegration in a deep mine by using a resistivity instrument. Zonal disintegration in Taimyrskii Mine is shown in Figure 1.

Adams and Jager observed the zonal disintegration in the roof of Witwatersrand Gold Mine located 2000 to 3000 m underground by a borehole periscope [6]. In China, this phenomenon was also found in deep Jinchuan Nickel Mine by measuring the displacement in surrounding rock mass using multipoint displacement meters [7]. The monitoring results are shown in Figure 2, which is at 1200 m depth, and the stress distribution perpendicular to the side wall of tunnel is quite different from that in shallow area (see Figure 3) [8], as is also observed by Li and his fellows and recorded in boreholes of Huainan Coal Mine in China by using the visual apparatus, which confirmed the existence of zonal disintegration at depth (see Figure 4) [9].

Zonal disintegration around deep roadway at Jinchuan Nickel Mine [7].
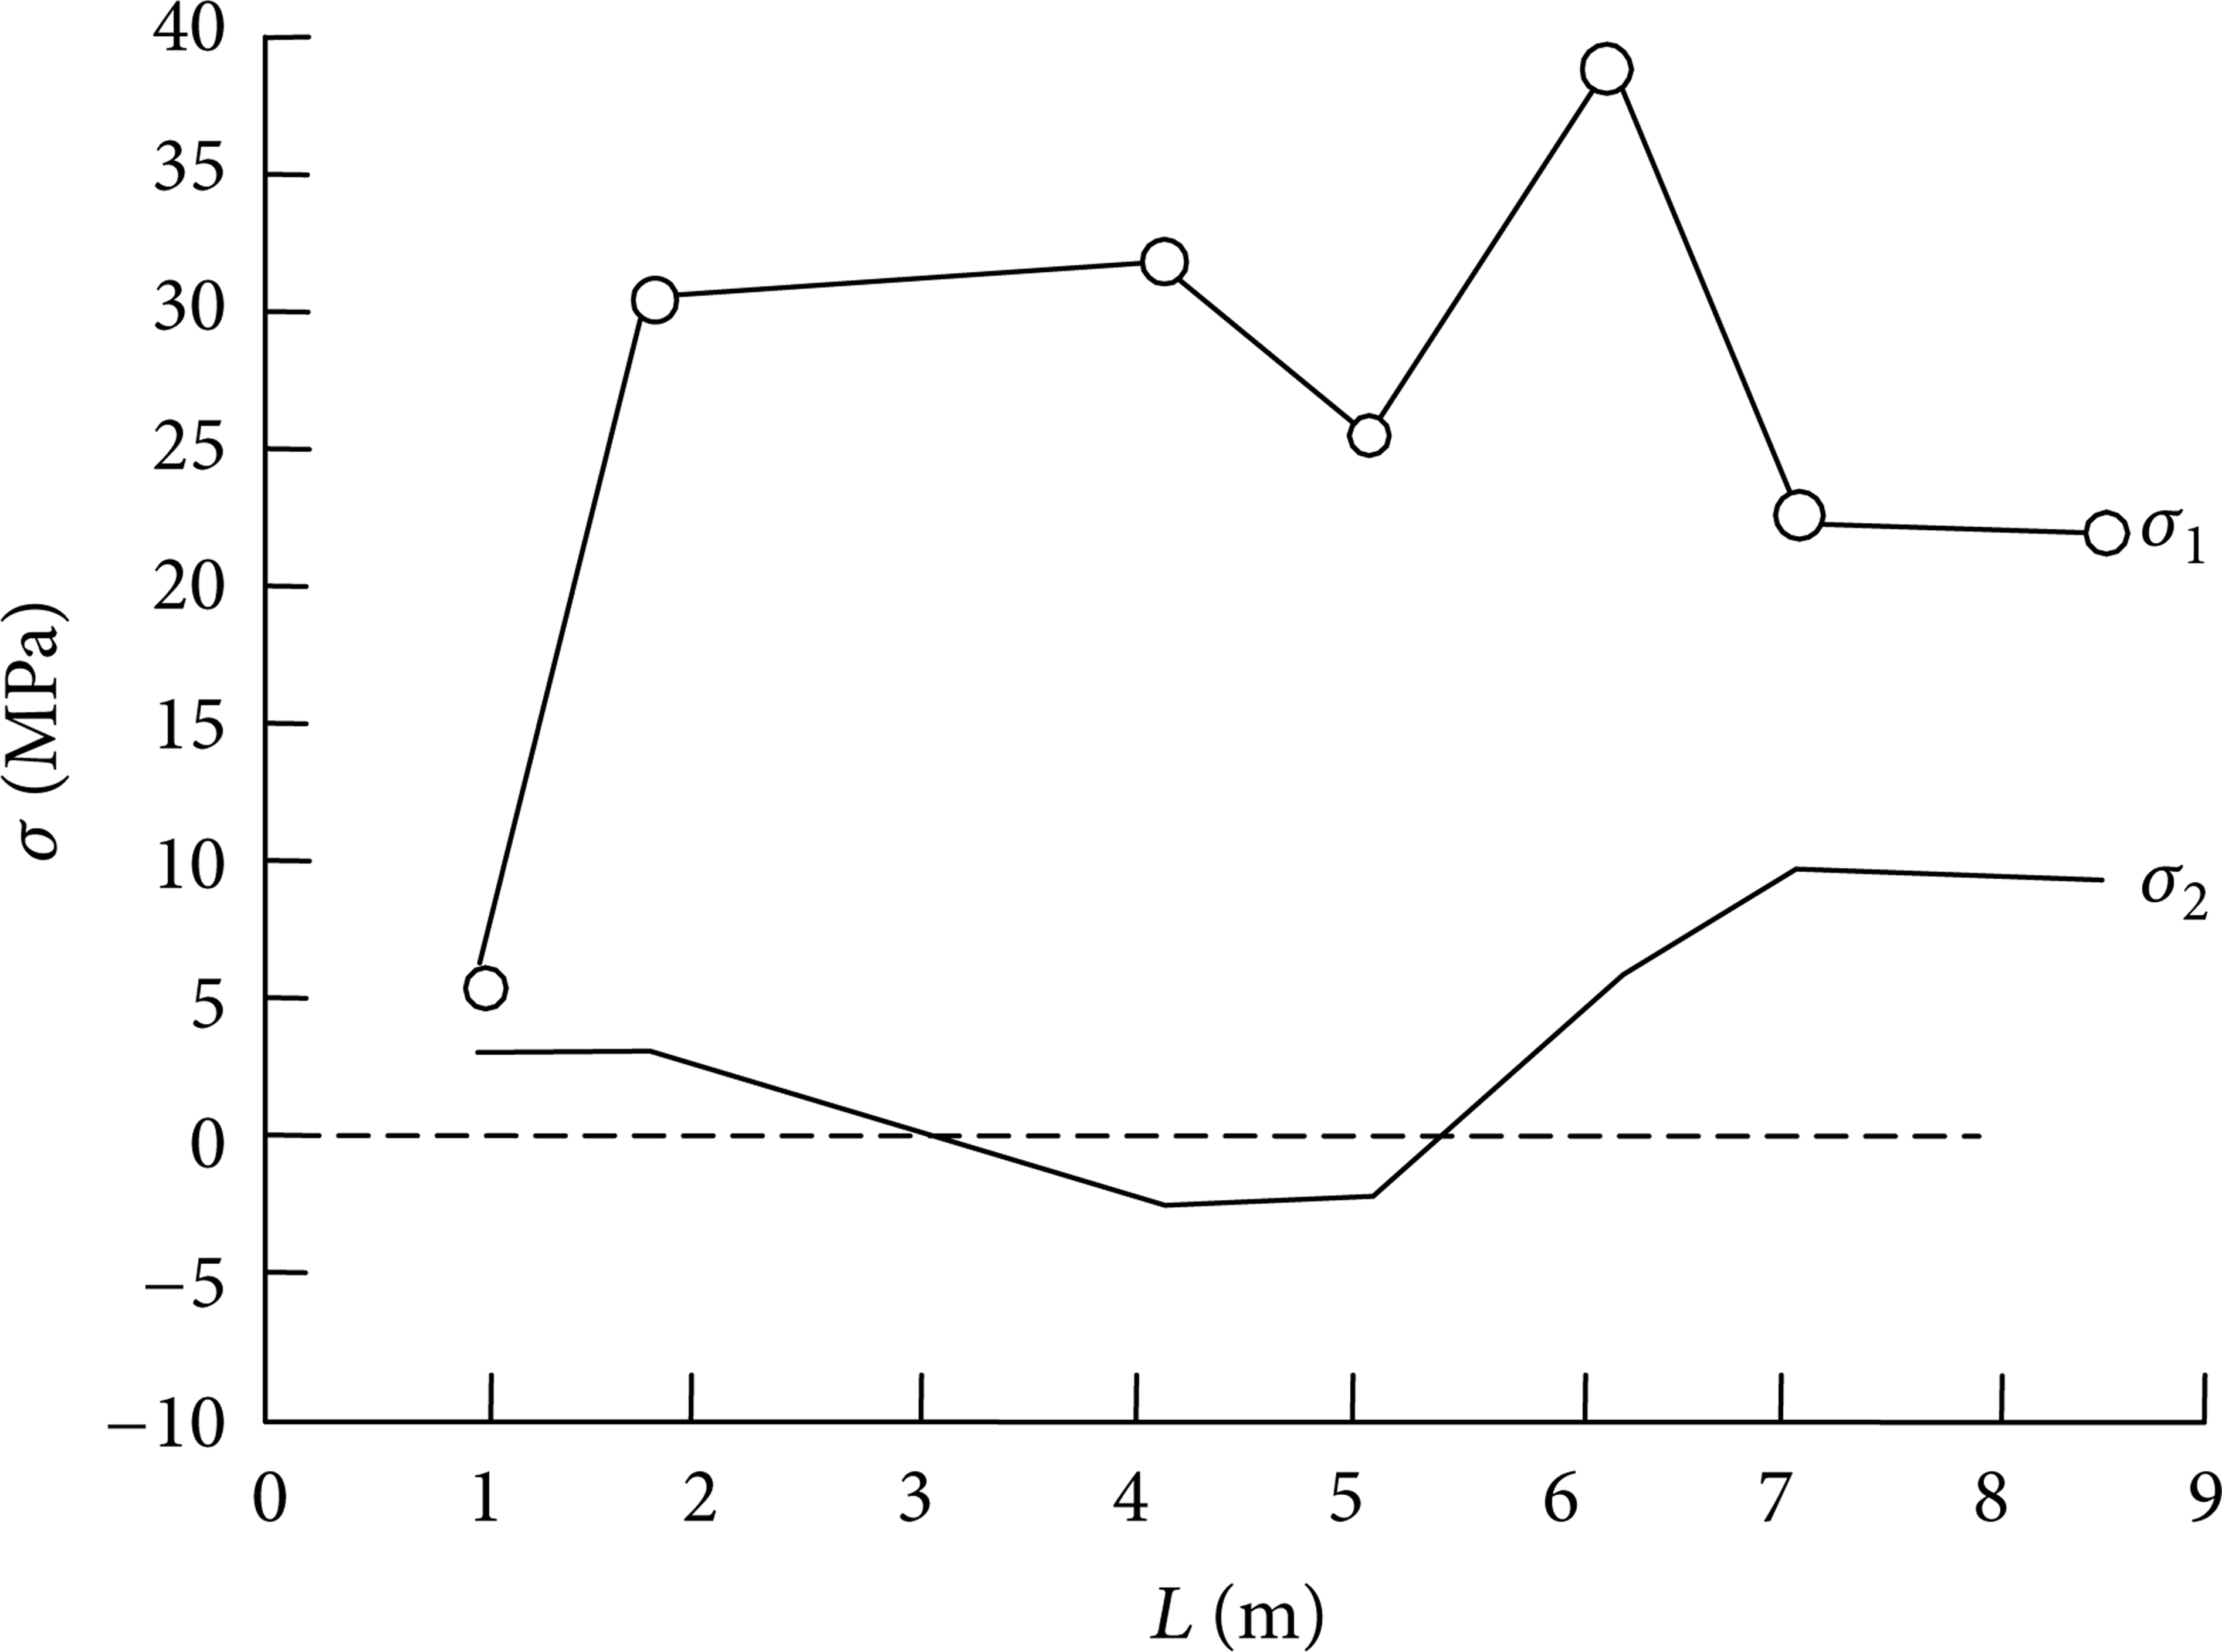
In-situ monitored result in a 1200 m deep tunnel at Jinchuan Mine [8].
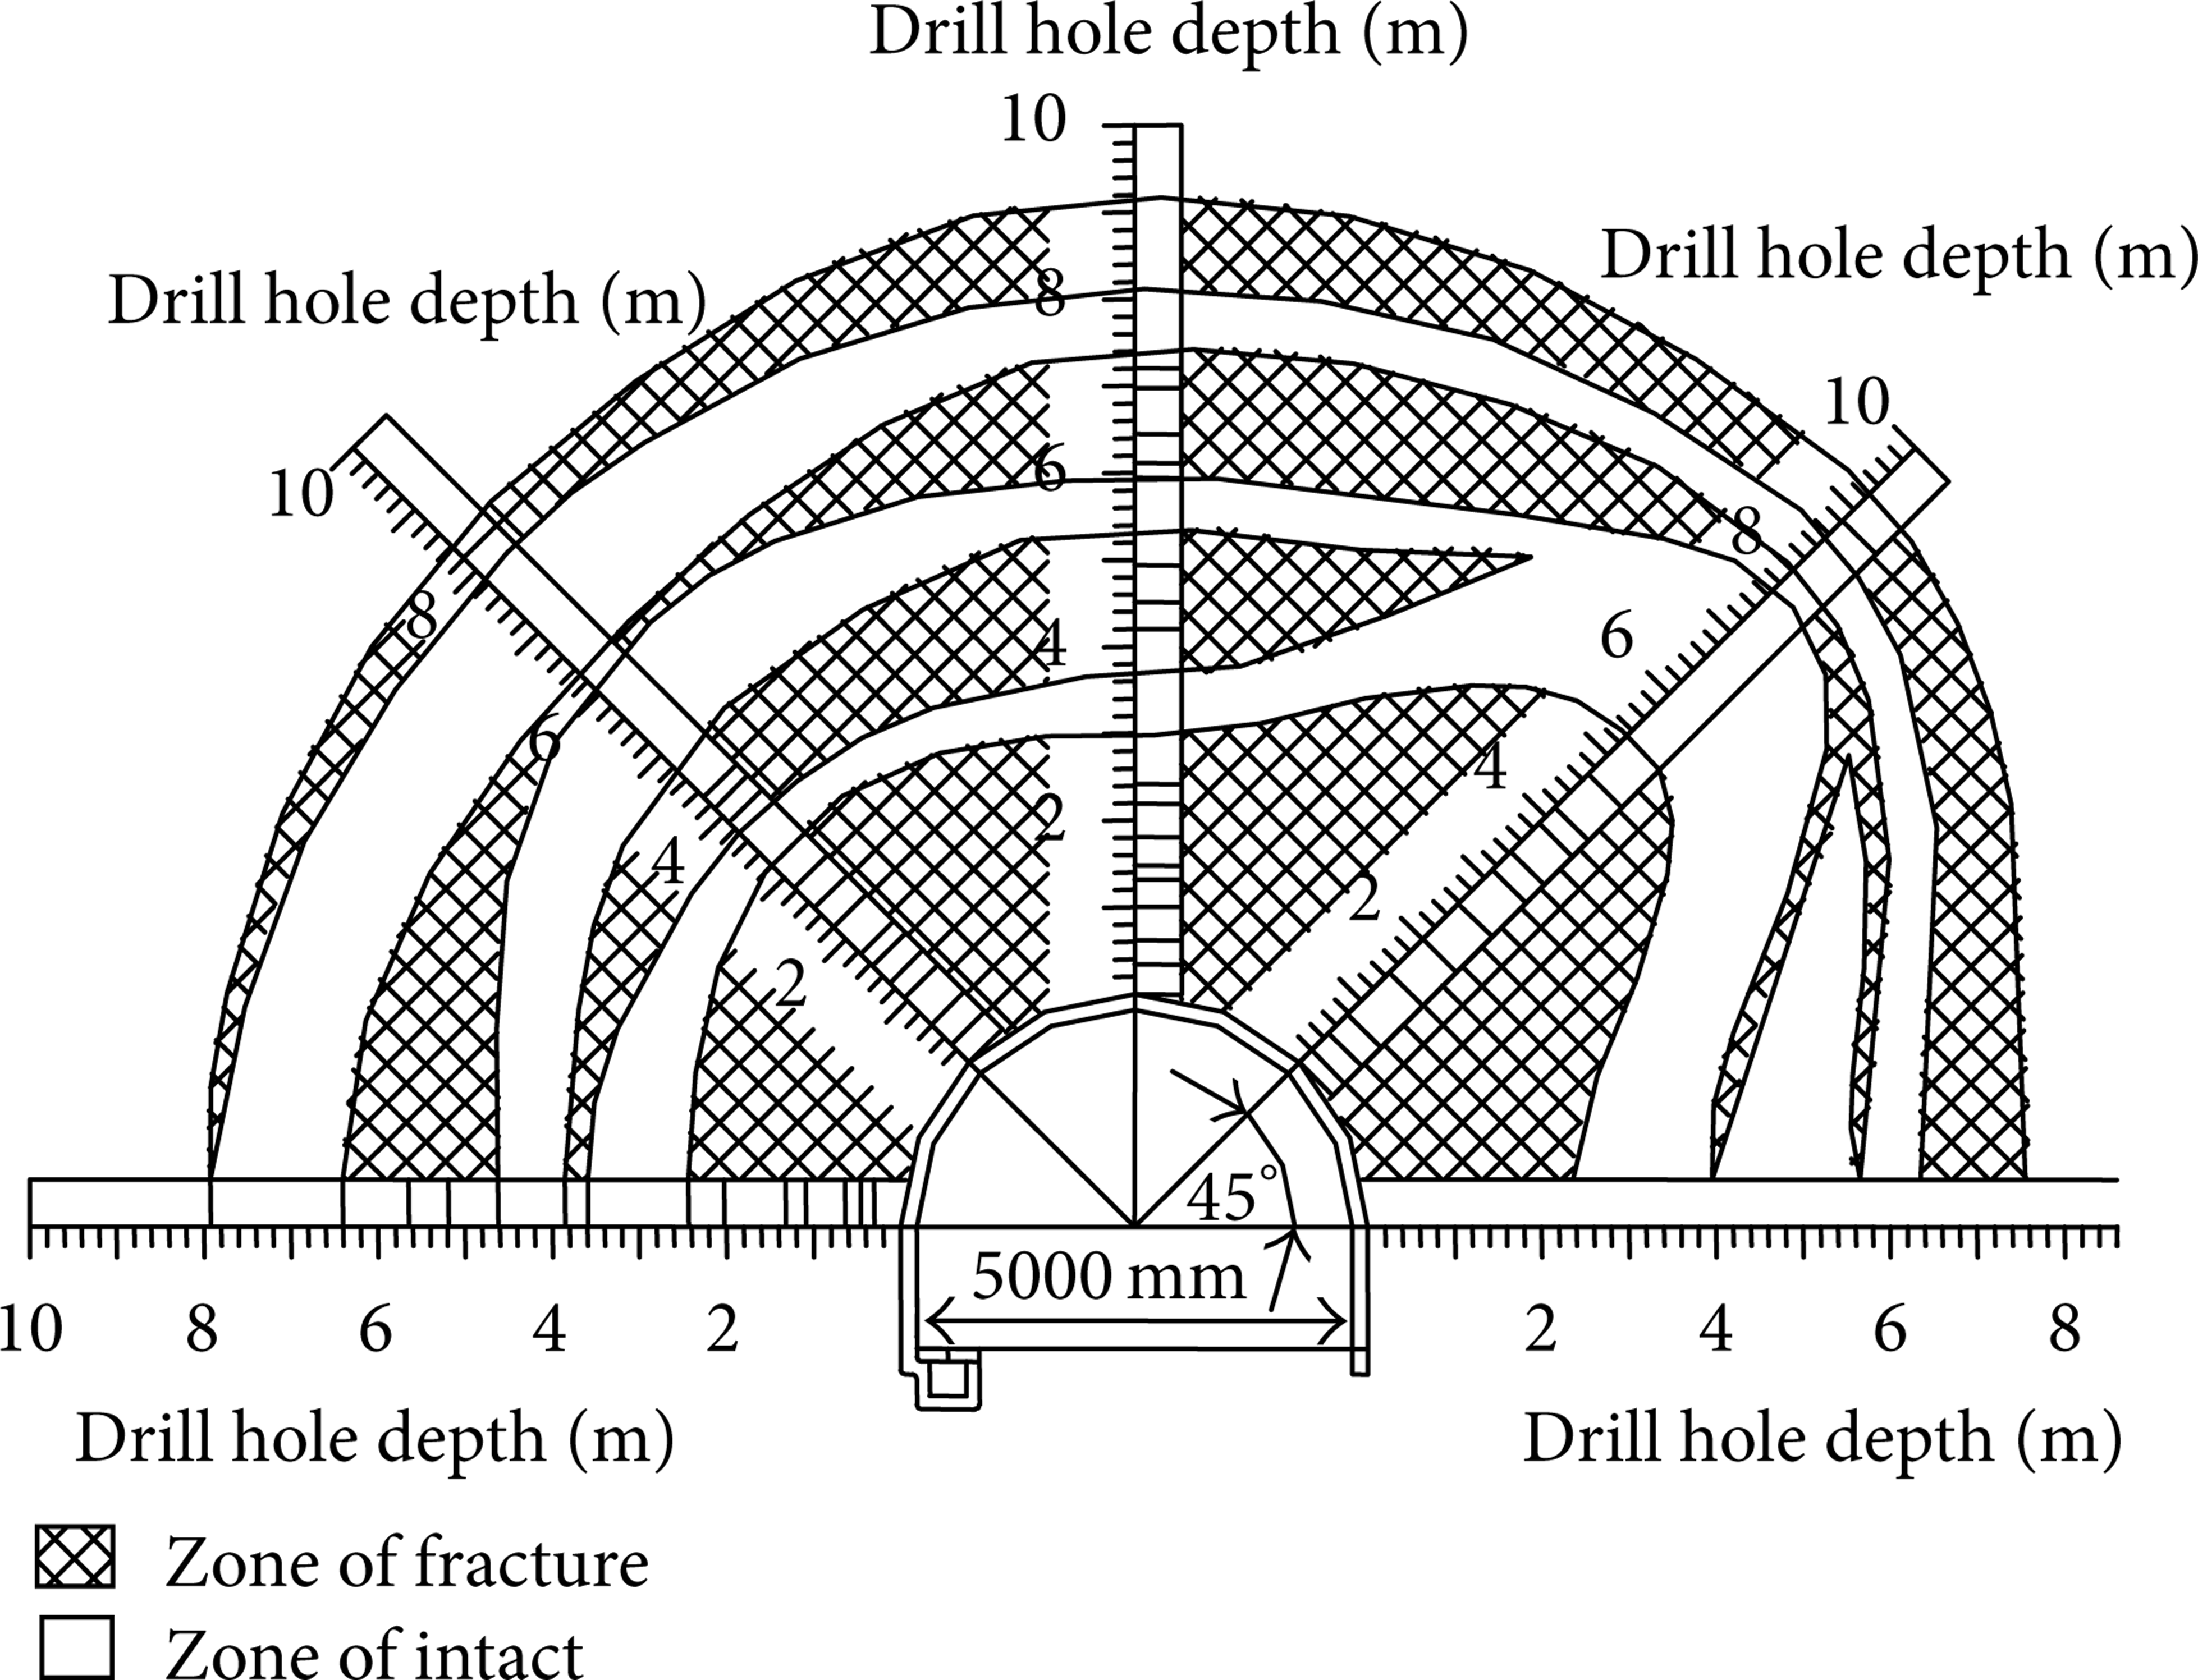
Zonal disintegration at Dingji Coal Mine in Huainan mine area [9].
It is very important to have a good understanding of the failure mechanism of deep rock mass and to form the theoretical basis for support design [10]. Although many researchers have tried to explain the zonal disintegration by site investigation, laboratory test, theory analysis, and numerical modeling, the mechanism of zonal disintegration is still under debate [1].
Many researchers devoted themselves to theoretically explain the zonal disintegration. For instance, Shemyakin from Russia illustrated the existence of the abutment pressure on the two sides and in front of tunnel face based on the elastic-plastic theory, and then analyzed the mechanism of zonal disintegration and reproduced it in laboratory [2–5]. Wang et al. investigated the quantization effect of geomechanical energy and deemed that due to the zonal disintegration, the mining method, support type, and support scope should all be reconsidered [10–12]. According to Li et al. [13, 14], the prerequisite of zonal disintegration is the spalling failure in the abutment area around tunnel. They deemed that during excavation, the zonal disintegration is not caused by dynamic disturbance but by creep deformation. On the other hand, Zhou et al. [15] and Li et al. [16] took the mining activity as a dynamic problem in order to characterize the zonal disintegration around underground deep tunnel.
In the experimental study aspect, Shemyakin et al. [2–5] tested and verified the zonal disintegration in laboratory and found that during the failure process of zonal disintegration, the load in the rock mass changes very slowly and it can be considered as a static one. Sellers and Klerck [17] studied the impact of the structural planes in rock mass on zonal disintegration in laboratory and the result showed that under some conditions, the structural planes existing in rock mass can be the origination of the zonal disintegration. Based on the laboratory loading tests of physical model containing a round or a U-shaped tunnel, Gu et al. [18] confirmed that the larger compressive stress along the axial direction of tunnel was the main reason of zonal disintegration. Tang et al. [19, 20] numerically simulated the failure process of a square specimen under 3D loading conditions and the zonal disintegration was successfully reproduced by using the RFPA-Parallel code. Tang deemed that the zonal disintegration was the result of annular tension failure under the principal stress along tunnel axis. One year later, Zhang [21] also reproduced the zonal disintegration successfully in a similarity material test.
Due to the mechanism for zonal integration remains controversy, it is very import to investigate the initiation, development and formation of zonal disintegration. There are a lot of impact factors on zonal disintegration, such as stress state, tunnel shape, rock mass properties, and excavation sequence. In this paper, the RFPA-Parallel was used to study the failure process of numerical rock specimens. The zonal disintegration phenomenon around the existing holes was reproduced and the impact of tunnel shape and the direction of maximum principle on the zonal disintegration were discussed.
2. Introduction about RFAP Code
2.1. Heterogeneous Material Property Distribution
Rock is a kind of heterogeneous material in the mesoscopic scale and the physicmechanical properties of the mesoscopic element can be expressed by the statistic distribution function. In RFPA-Parallel, the rock specimen is assumed to be composed of many elements with the same size, and the mechanical properties of these elements are assumed to conform to a given Weibull distribution as defined by the following probability density function [22]:
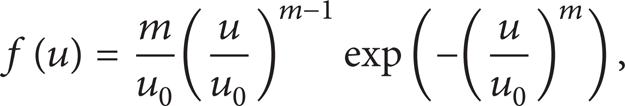
where u is the mechanical parameter of the element (such as strength or Young's modulus); the scale parameter u0 is related to the means of the element parameters and the parameter m defines the shape of the distribution function. From the properties of the Weibull distribution, a larger value of m implies a more heterogeneous material and vice versa. Therefore, the parameter m is called the homogeneity index in our numerical simulations.
2.2. The Constitutive Model of Mesoscopic Element
Before loading, the mesoscopic elements are under elastic condition and can be expressed by the elastic modulus and Poisson's ratio. The stress-strain relation for each element is elastic. When the stress comes to the damage threshold, the element then takes on a softening character. Once one of the following criteria is satisfied, the damage begins [23]. Consider

where fc0 is the uniaxial compressive strength, E0 is the initial elastic modulus of element, k is the tension-compression ratio, and ϕ is the internal friction angle.
The first part of (2) is the maximum tensile strain criteria and the second part is the Mohr-Coulomb criteria, which are taken as the damage threshold of tensile stress and shear stress. Therefore, the damage of each element is either under tensile stress damage, which is according to the maximum tensile strain criteria, or shear stress damage, which is according to the Mohr-Coulomb criteria. Consider

where ω is the damage variable. E and E0 are the elastic modulus of damaged and undamaged elements, respectively. In RFPA, because the element and its damage are taken as isotropic, the E, E0, and ω are all scalar. In this paper, the compressive stress and compressive strain are taken as positive.
The constitutive model of element under uniaxial stress state (tension or compression) is shown in Figure 5, where ft0 and f tr are uniaxial tensile strength and residue uniaxial tensile strength and fc0 and f cr are uniaxial compressive strength and residue uniaxial compressive strength, respectively. The stress-strain curve in the initial stage is elastic, which means no damage occurs or ω = 0. When the maximum tensile strain criterion is satisfied, the element is damaged.

The constitutive law of the mesoscopic element under uniaxial stress state (here ft0 andf tr are uniaxial tensile strength and residual uniaxial tensile strength of element, respectively. And fc0 and f cr are uniaxial compressive strength and residual corresponding strength of element, resp.).
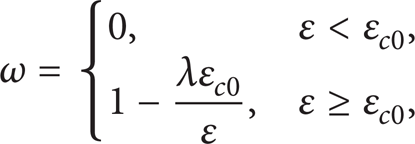
The constitutive law under uniaxial tensile state in Figure 5 is expressed as

where λ is the residual strength factor, and the residue strength can be expressed asf tr = λft0, where ft0 is the tensile strength of element. εt0 is ultimate elastic strain and is called threshold strain, which can be expressed by
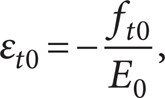
where ε tu is the ultimate tensile strain of element, under which the element will be damaged completely. The ultimate tensile strain can be expressed by ε tu = ηεt0, where η is the ultimate strain factor. Here we suppose that λ and η have nothing to do with stress state.
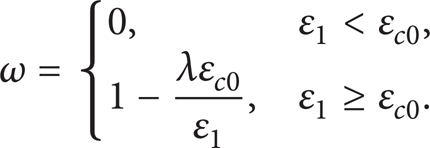
In RFPA3D, we suppose that the damage of element under multiaxial stress state is isotropic, so the constitutive equation in 1D can be easily extended to 3D. Under multiaxial stress state, when the equivalent tensile principal strain comes to the threshold strain of εt0, damage occurs in element. And the equivalent principal strain

where ε1, ε2, and ε3 are the three principal strains and < > is a function defined by (7)

Substituting the strain ε in (4) by the equivalent strain defined by (6) and (7), the constitutive law of element can be expressed as

According to elastic damage mechanics, the constitutive equation of stress-strain relation can be obtained as

where

Like the condition under uniaxial tensile state, when the element is under uniaxial compressive state, the damage failure follows the Mohr-Coulomb criteria. The damage variable can be expressed as
where λ is residue strength factor and f cr /fc0 = f tr /ft0 = λ under uniaxial compressive or tensile state. εc0 can be calculated by the following:

In RFPA3D, damage will occur when the strength of element satisfies the Mohr-Coulomb criteria. During the damage process, the impact of principle stress should be taken into account in the model. When the Mohr-Coulomb criteria is satisfied, the maximum principal (compressive) strain εc0 can be calculated according to the peak value of the maximum principal (compressive) stress:

Suppos that the shear damage evolution is only relate to the maximum compressive principal strain ε1, the uniaxial compressive strain c in (8) can be substituted by the maximum compressive principal strain of the damaged element ε1, then we get the expanded equation under triaxial stress state:
Equally, according to the damage mechanics, the constitutive equation can be written as

2.3. The Brief to RFPA3D-Parallel
The RFPA-Parallel is composed of four parts, that is preprocessor, elastic stress analysis, failure analysis, and postprocessor. In the preprocessor and postprocessor parts, the friendly man-machine interaction mode is used. And the software is developed by Visual C and OpenGL, which brought a user friendly interface. There is no need to build a rigid matrix and system of equation. The windows serial program is used in the failure analysis. The FEM is used in elastic stress analysis.
The calculation function is written by Fortran 90 in RFPA3D. The numerical model is meshed by cube elements, which can reflect the heterogeneity of material. The calculation program is run under Redhat Linux 9.0. The Message Passing Interface (MPI) technique is used in the programming. The Preprocess Conjugate Gradient method (PCG) is used to solve the linear equations. For more details, readers are recommended to refer to related papers [24].
3. Numerical Studies on Zonal Disintegration
3.1. Numerical Model
The numerical model shown in Figure 6 is 35 mm × 140 mm × 140 mm in dimension and the axial direction of the tunnel is in x direction. The whole domain is discretized into 35 × 140 × 140 = 686000 finite elements.

Boundary conditions for the tunnels.
In order to investigate the effect of the tunnel shape on zonal disintegration, as well as to compare numerical simulation results with the laboratory by Gu et al. [18], circular tunnels with diameter of d1 = 20 mm and d2 = 30 mm, as well as U-shaped tunnels with a size of 20 mm × 25 mm (width × height) and 30 mm × 30 mm (width × height) are chosen. The diameter of the crown of the U-shaped tunnel is 10 mm and 15 mm, respectively. The boundary condition of the model is showed in Figure 6. A displacement is applied on the surface of x = 35 mm by 0.01 mm per step.
In addition, for studying the effect of the direction of maximum principal stress on the failure mechanism of zonal disintegration, two kinds of boundary conditions for the U-shaped tunnel are considered.
Apply displacement on the surface of y = 140 mm vertically and fix the perpendicular displacement on surfaces at z = 0 mm, x = 0 mm, x = 35 mm, and y = 0 mm, respectively.
Apply displacement on the surface of z = 140 mm horizontally and fix perpendicular displacement on surfaces z = 0; v, x = 0 mm, x = 35 mm, y = 0 mm, and y = 140 mm.
For rock material, there might be randomly distributed defects in it, which can be considered in the model by adopting the Weibull distribution function to describe the inhomogeneity of rock prosperities in spatial. The homogeneity index of the model is m = 5. The elastic modulus and the poisson's ratio are 40 GPa and 0.25, respectively. The mean strength of the elements is 60 MPa, which means that the corresponding macroscopic strength of the whole model is about 26 MPa.
3.2. Numerical Simulation Results
3.2.1. Circular Shaped Tunnel
(A) The Character of Loading Stress, AE and Accumulated AE of the Model. For the two numerical models containing a circular tunnel with a diameter of 20 mm and 30 mm, respectively, the stress-loading steps curves along x, y, and z direction under the x direction load are shown in Figure 7. The AE and accumulated AE curves are shown in Figure 8.

The stress vs. loading-step curves for tunnel with different diameters.

Curvatures of AE accumulation/AE energy accumulation vs. loading step of specimen with different tunnel diameters.
As shown in Figures 7 and 8, for model with d1 = 20 mm, the loading stress in x direction comes to its peak value of 71.0 MPa at step 6, which is about 2.73 times of the compressive strength; while at step 7, the amount of the microcracks increase dramatically and the corresponding loading stress is near to the residue strength of the rock material. After step 7, the increase of the microcracks is then getting mild, which indicates that most of the cracking events cluster in step 7. As for the model with diameter of d2 = 30 mm, the loading stress in x direction comes to its peak value of 58.2 MPa at step 5, which is 2.24 times of the compressive strength of material. At step 6, the amount of microcrack increases sharply before step 7, which means that most of the microcrack events are in step 6.
It can be seen from Figure 7 that the larger the span is, the smaller the bearing capacity of the model is. For example, for d2 = 30 mm, the loading stress in x direction is only 58.2 MPa, while for d1 = 20 mm, the loading stress in x direction is 71.0 MPa, nearly 1.22 times of the former, which is in good agreement with the laboratory results by Gu et al. [18].
In Figure 8, for a smaller span tunnel model, due to its higher load bearing capacity, the deformation prior to failure is larger than that of the small span model; the released energy and the amount of mircocracks in it are more than that of the larger span model.
(B) Zonal Disintegration Process Analysis on the Circular Tunnel Model
(1) For Tunnel with Diameter ofd1 = 20 mm. Figure 9 shows the zonal disintegration process under the x direction load. Figure 9 (a) shows the elastic modulus distribution at specific steps and Figure 9 (b) shows the maximum principal stress distribution. With the increase of the loading, the mirco-cracks first initiate at the periphery of the tunnel and then gather into several conjugate slip lines around the tunnel. Due to the heterogeneity of the material, the propagation of the microcracks is discontinuous but finally forms into fracture rings (see step 5 (1)). After the first fracture ring has formed, the diameter of the tunnel is becoming larger indeed, thus forming the next new fracture under a larger axial compressive stress (see step 7 (5)). With the load increase, some new fracture rings are formed and the space between the fracture rings is increasing simultaneously but still near the tunnel span in size (see steps 7 (11) and 7 (31). After step 7, the amount of the microcracks increases slowly, which is the same with Figures 7 and 8.

Zonal disintegration process under the load in x direction.
In fact, the zonal disintegration described as circle microcracks [2–9] in many papers are deduced from limited borehole data drawn by the field observers, which cannot present the real zonal disintegration phenomenon. If we analyze the sketch drawn in Russia mine in the paper [2–5], we will find that the fracture rings are not continuous but with some isolated fracture rings or two fracture rings developed from the fracture. The numerical simulated results show that the fracture curve is either continuous or discontinuous, indicating that the propagation of fracture is influenced by many factors such as the heterogeneity, boundary conditions, and so on.
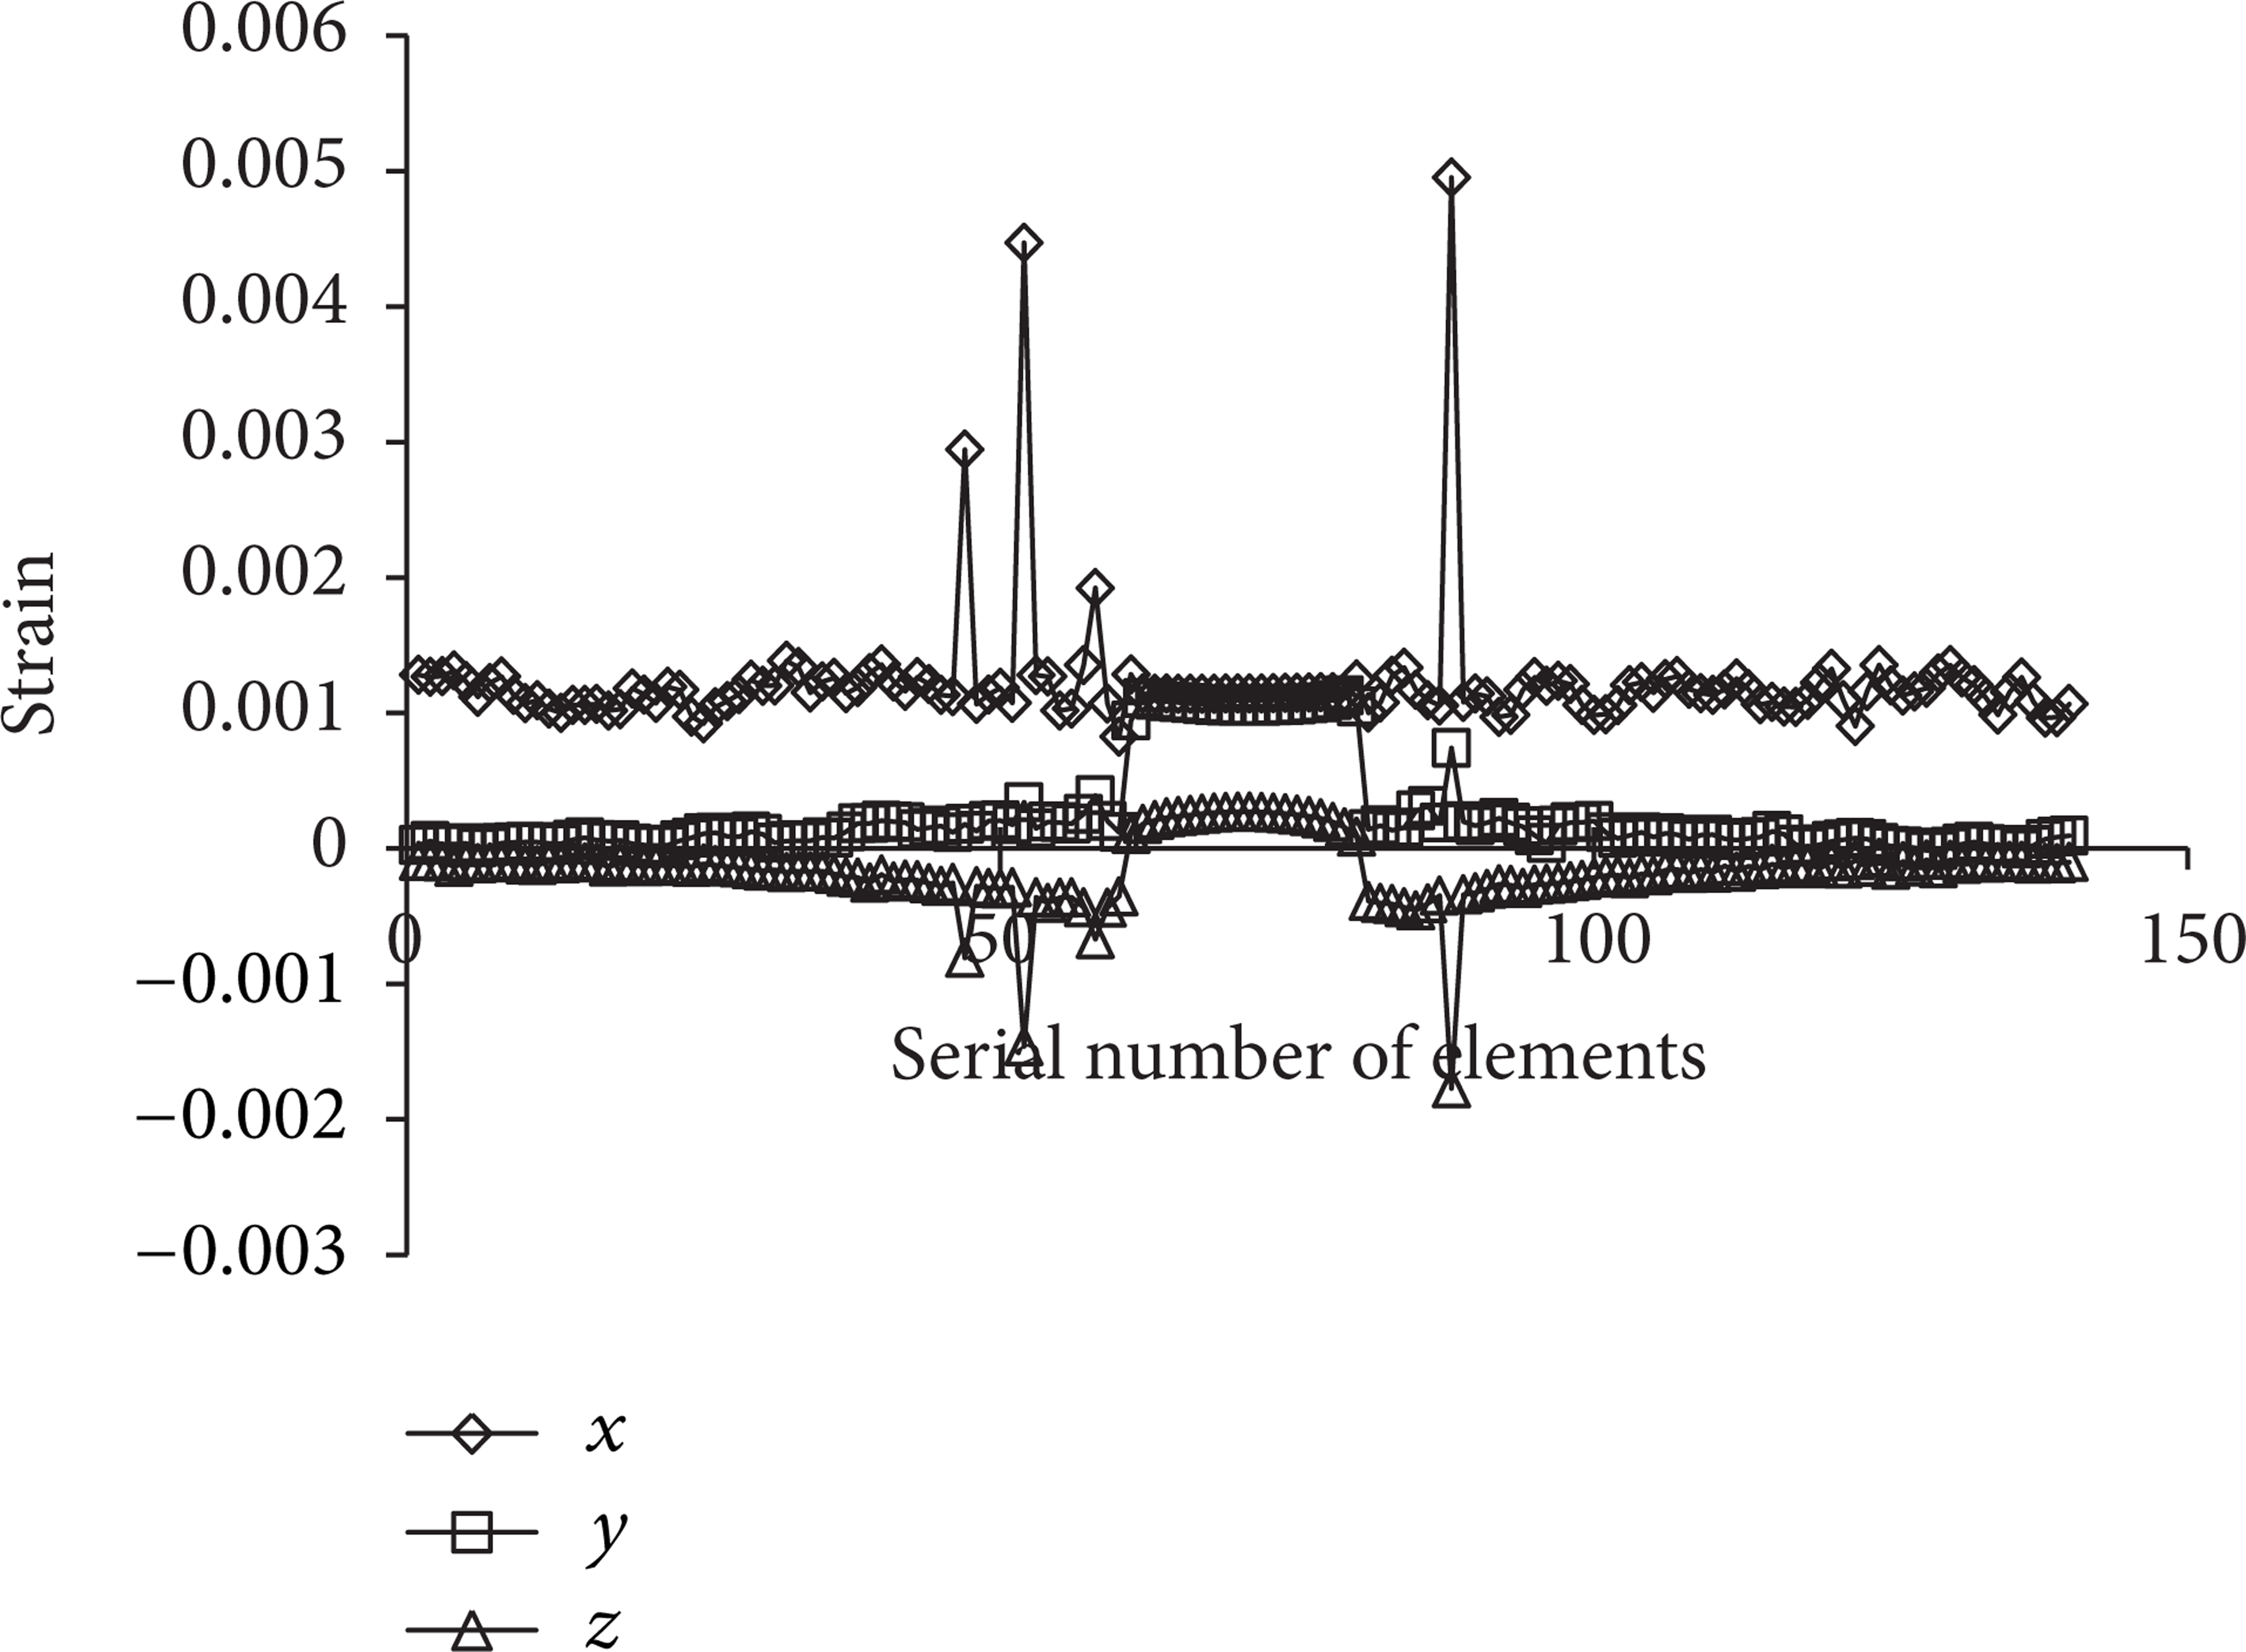
With the increase of axial load, the loading stress comes to the peak value at step 6 and the stress curve along horizontal line (x = 18 mm, y = 70 mm) in z direction is shown in Figure 10. It needs to be noted that the stress and strain of an element are averaged over its Gaussian points. The displacement around the tunnel periphery is larger than that in the area far from the tunnel boundary. The displacement around tunnel can be explained by the elastic theory εθ = u/r for a small r; the tangential strain εθ caused by the radial displacement u is then large enough to cause the shear slip line fracture. For a larger radius of curvature r, the rock mass under a larger axial compressive stress will swell laterally into tunnel, which causes a radial tensile stress in the rock mass. The tensile stress is small near to the periphery of tunnel but is large far from tunnel periphery [18]. When the axial stress is increased to some value, the maximum radial tensile stress will be up to the ultimate tensile strain of rock mass, which leads to the tensile failure of rock mass. As it is mentioned before that when the loading stress comes to the peak value, the displacement of tunnel wall gets larger so that the conjugate slip line failure mode happens. At the same time, discontinuous fracture rings form due to tensile failure in the surrounding rock mass.

Strain curves of elements along z direction at positions x = 18 and y = 17 at step 6.
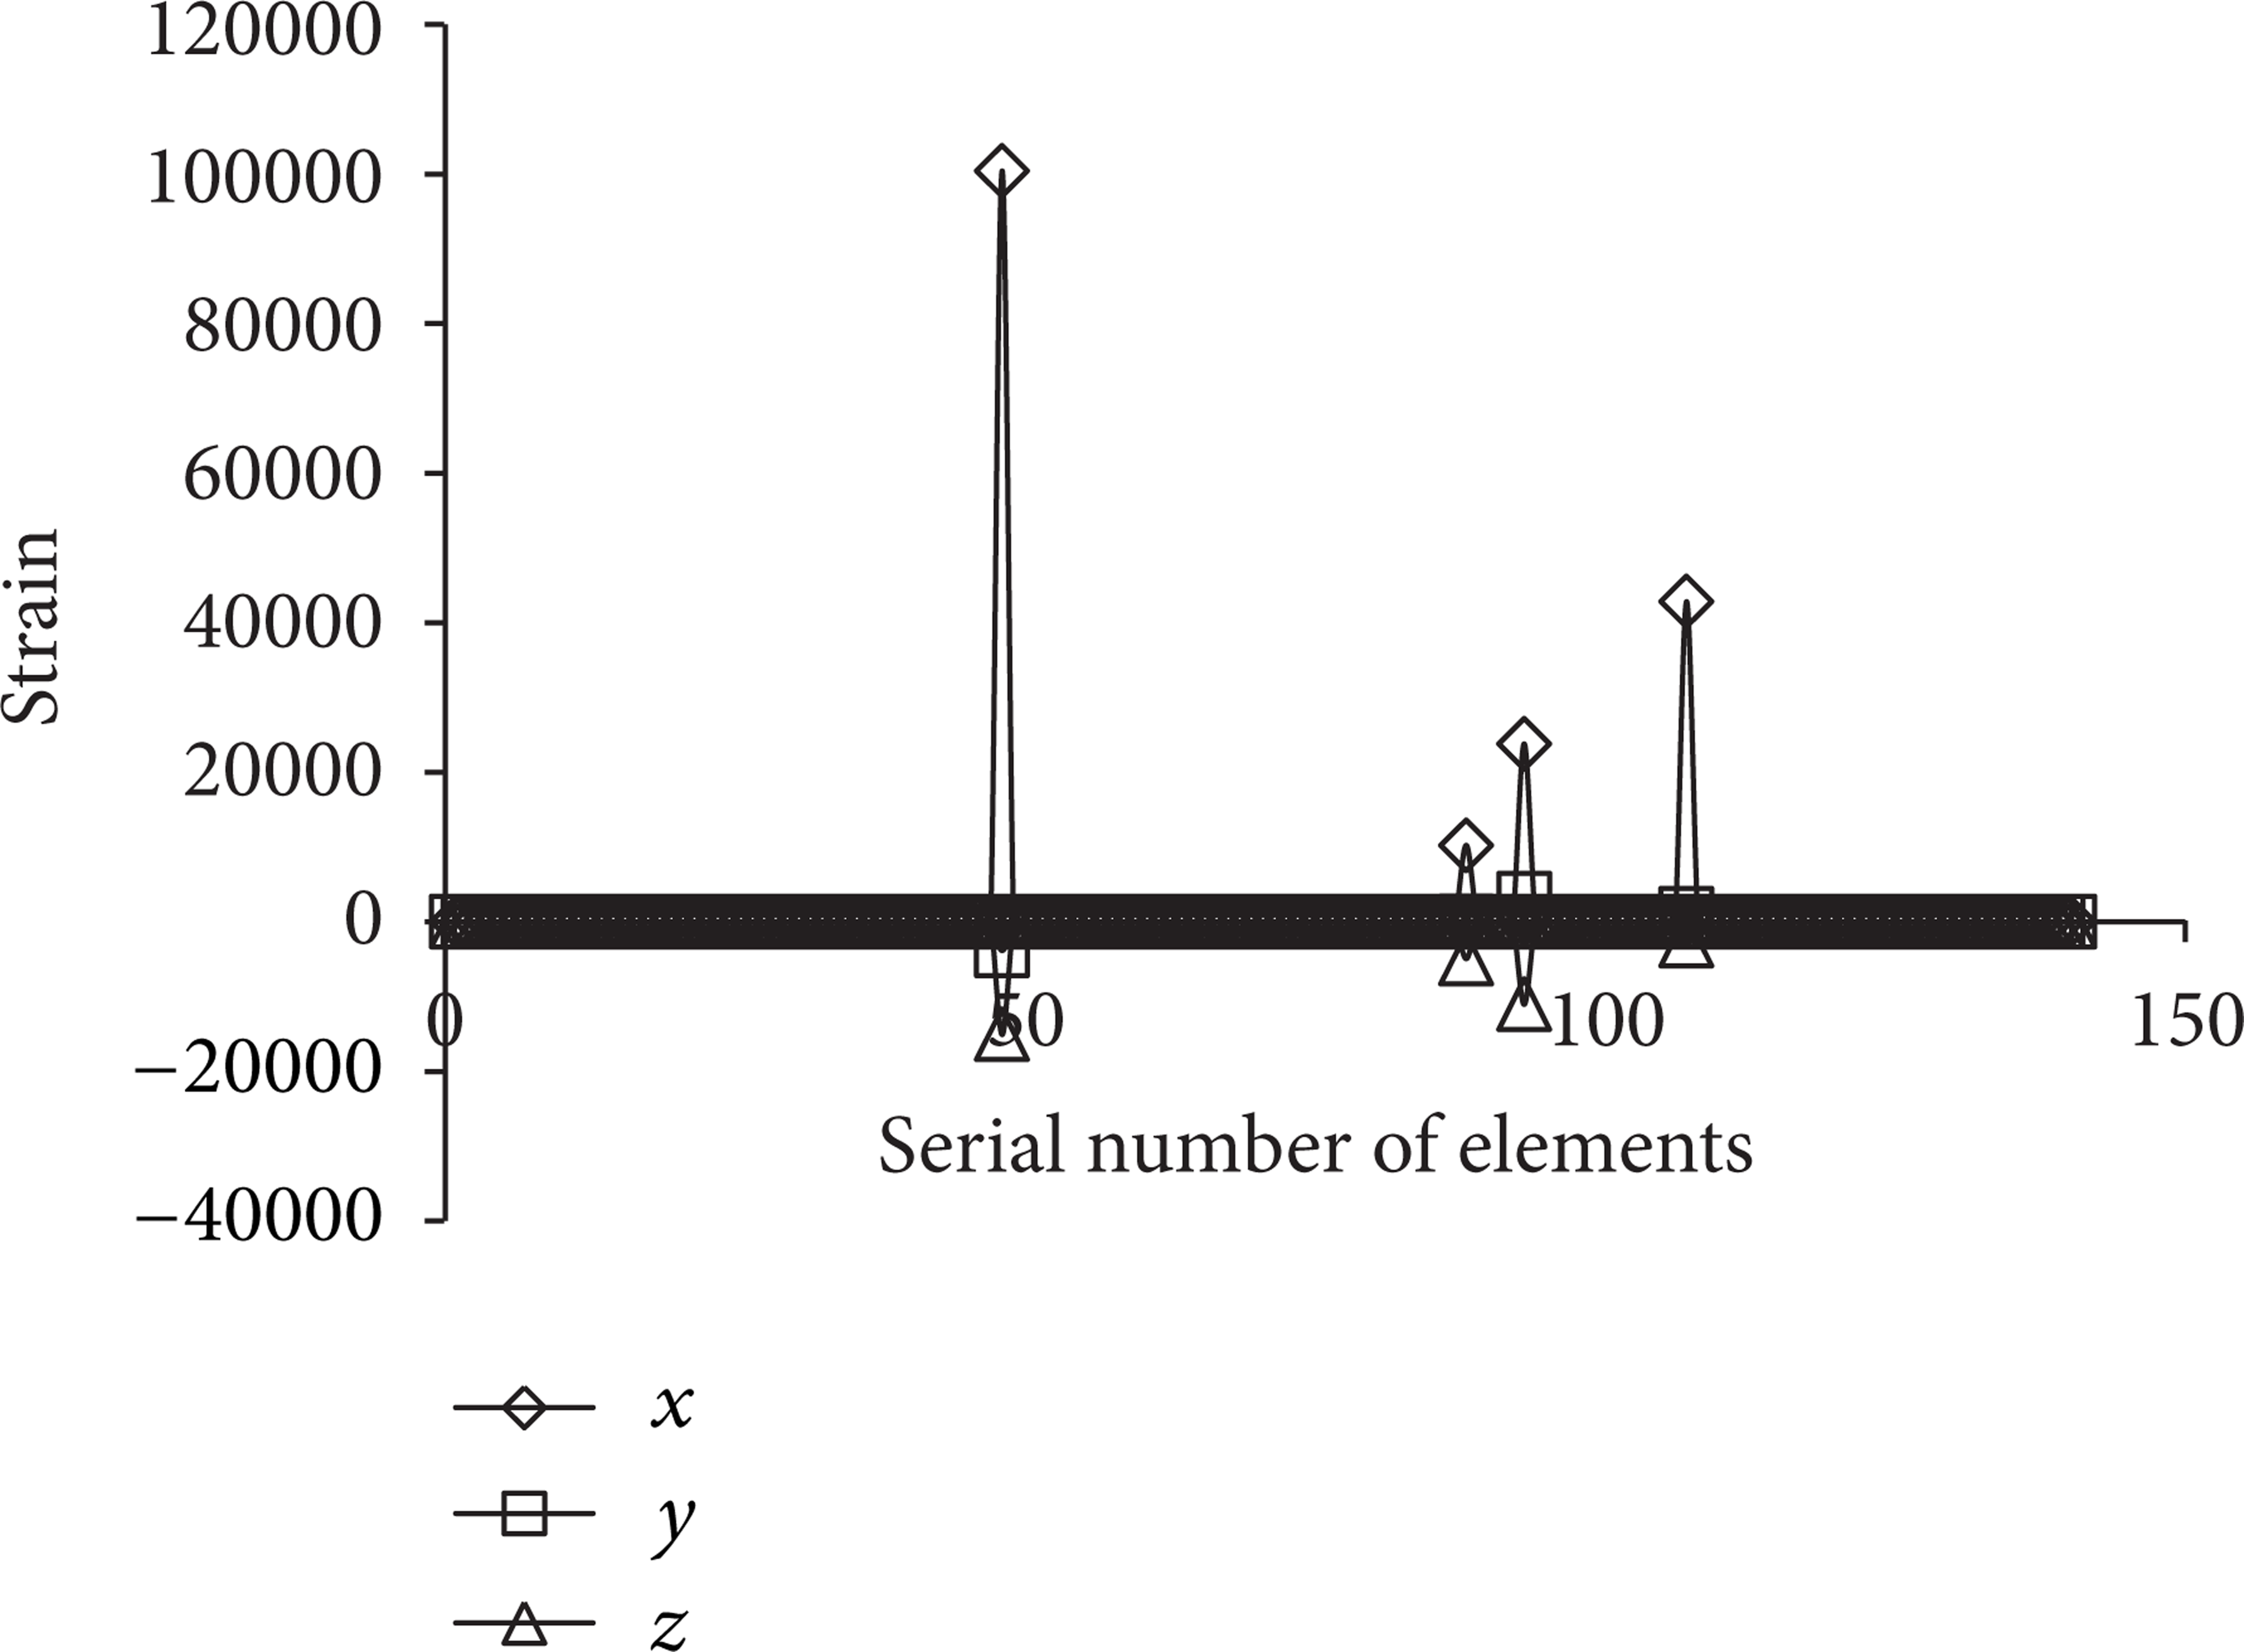
Figure 11 shows the strain curves of middle units (x = 18 mm, y = 70 mm) in the horizontal direction (z) at step 6 and step 20. At step 20, the zonal disintegration is already in a stable stage. Compared with Figure 10, in this stable stage, the strain in the fracture area is larger and the peak strain area exists in both sides of tunnel. But even in the same fracture ring, the peak values are not the same due to the heterogeneity of rock mass. From the whole failure process, it can be seen that before a certain loading stress, the zonal disintegration can be developed gradually, but when the loading stress comes to a certain value, the development of zonal disintegration is reduced.

Strain curves of elements along z direction at positions x = 18 mm and y = 17 mm at step 20.
(2) For Tunnel with Diameter ofd1 = 30 mm. Figure 12 shows the zonal disintegration process for model with a tunnel diameter of 30 mm. Cracks first initiate from the tunnel periphery and then gradually develop into conjugate slip lines. The first fracture ring is relatively circle but is discontinuous. It can be noticed that the distance between microcracks is relatively wide and more microcracks generated from one fracture intersect with each other, thus forming the conjugate slip lines. The distance between microcracks increases with the increase of tunnel diameter.

Zonal disintegration process under the load in x direction.
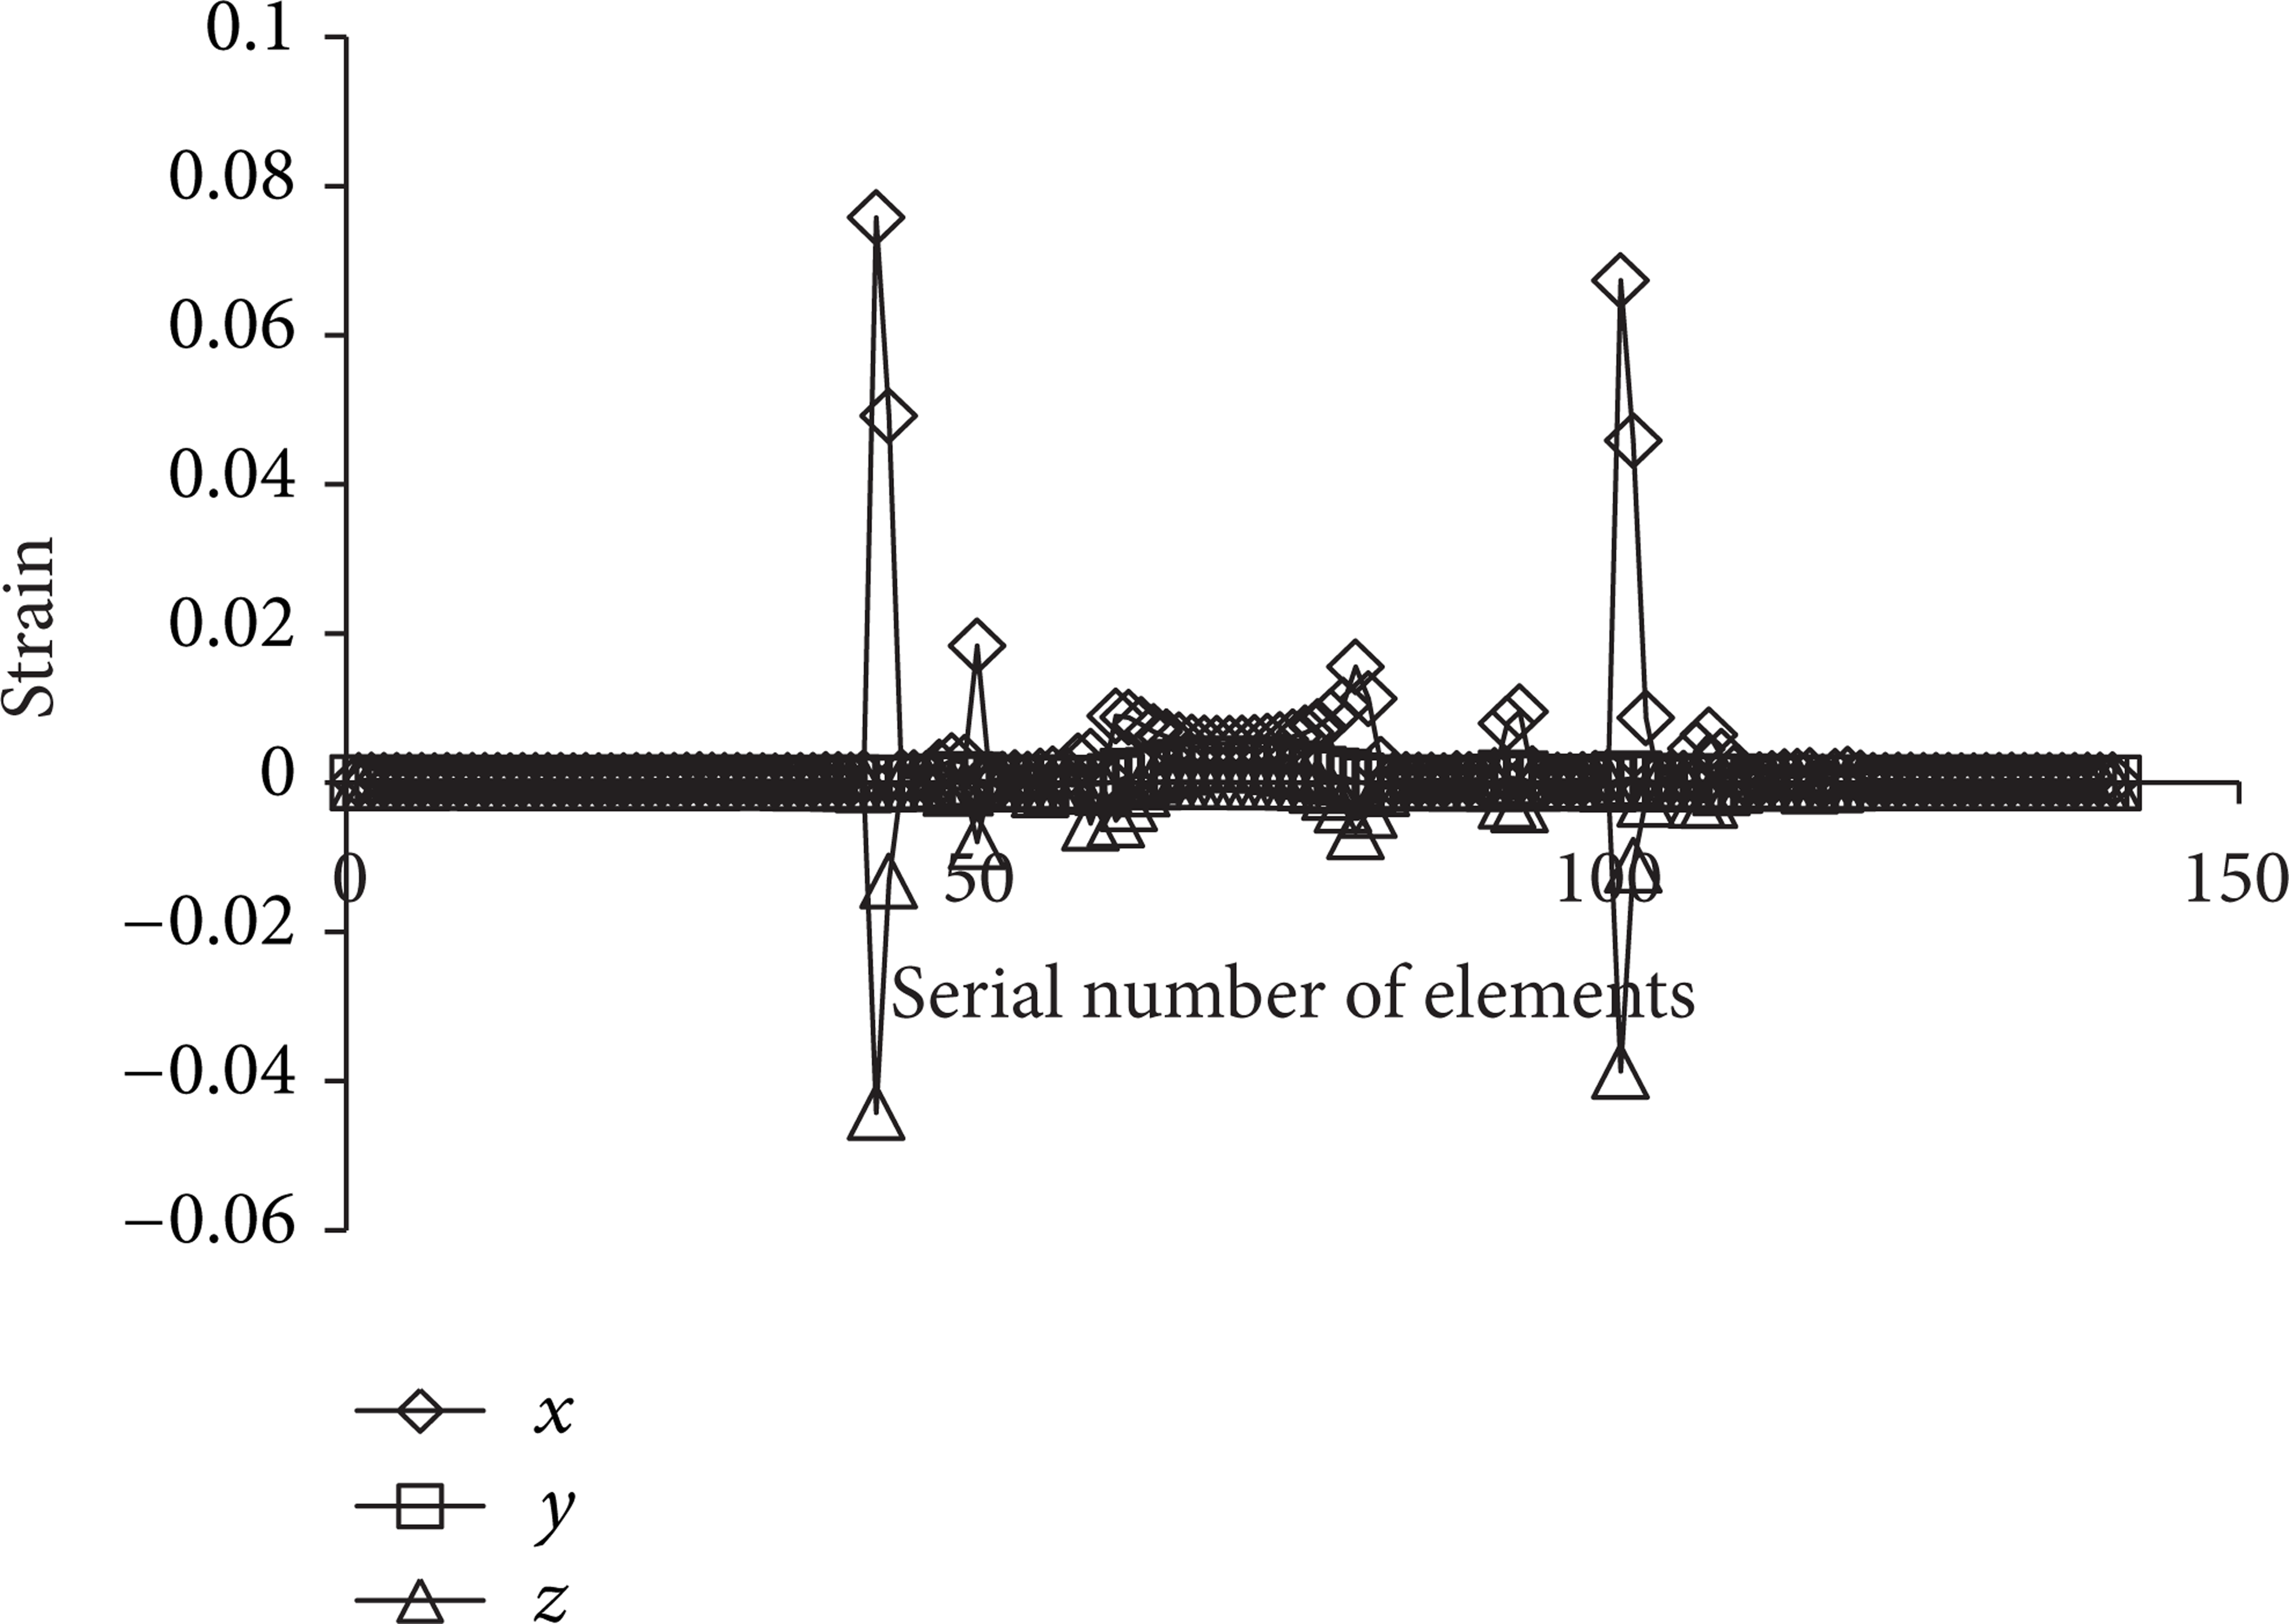
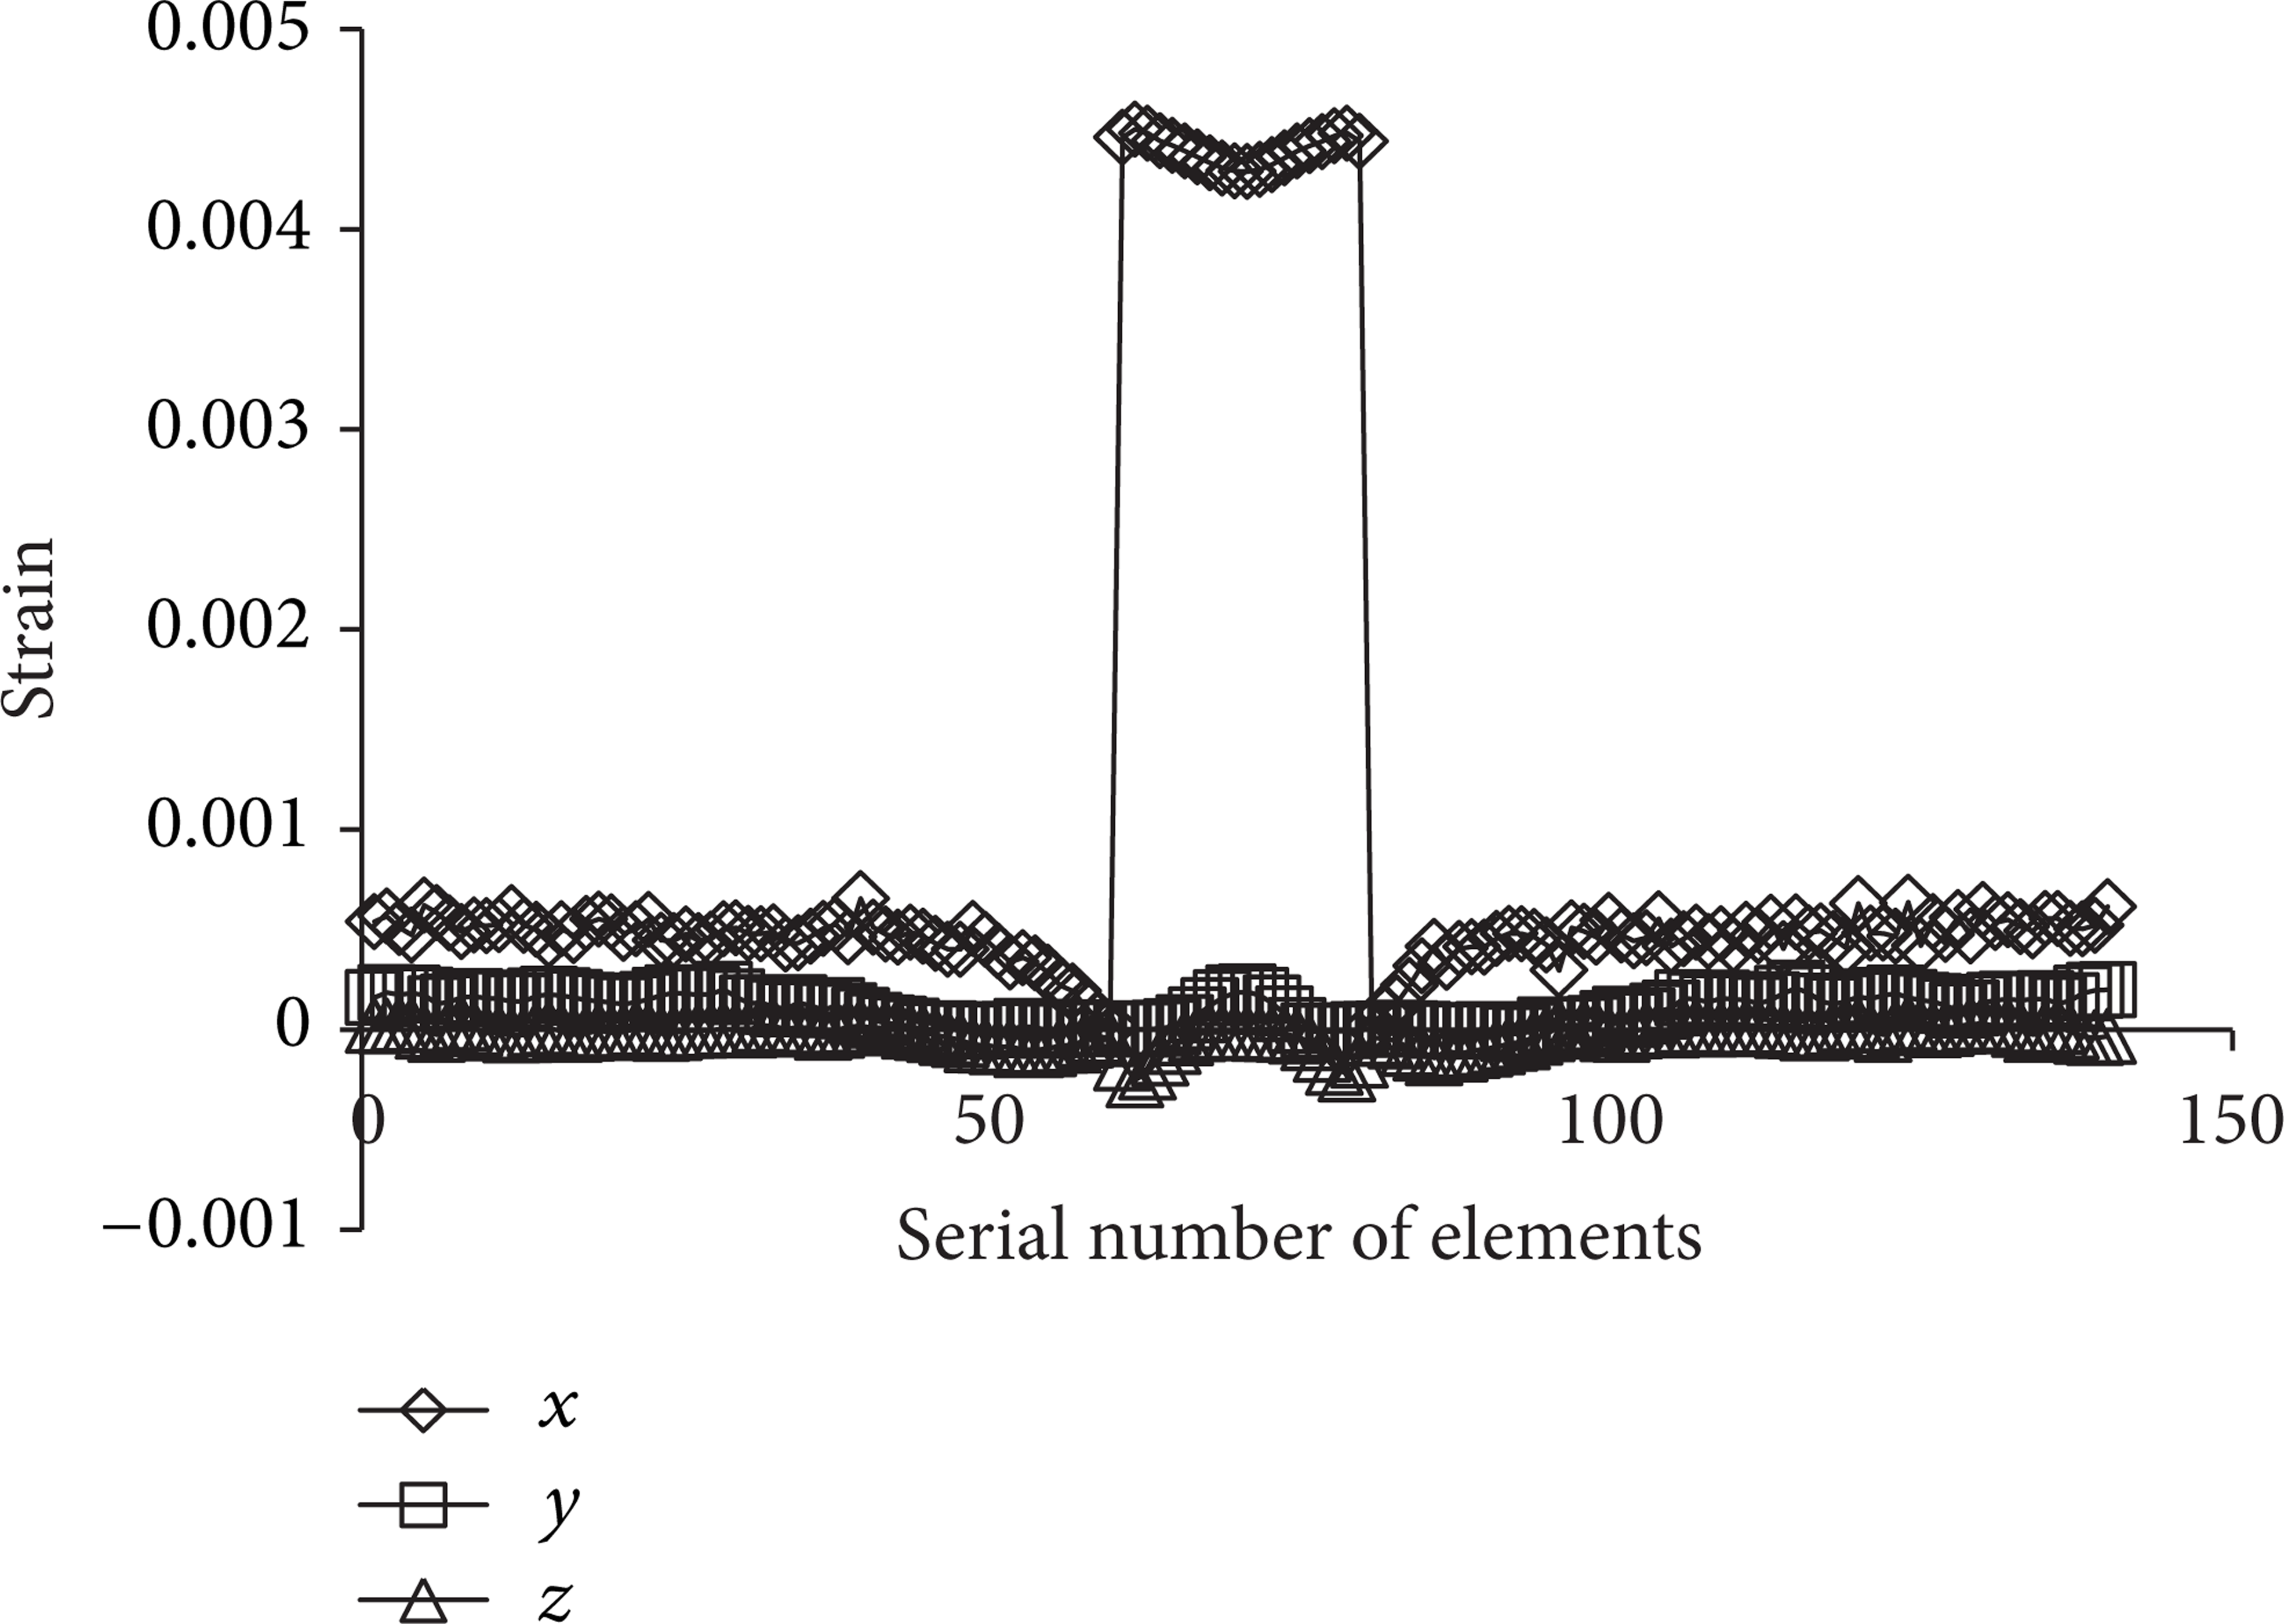
The loading strain curves along the horizontal line through points (x = 18 mm, y = 70 mm) along z direction at step 5 (peak value stage) and step 20 (stable stage) are shown in Figures 13 and 14. The displacement in the fracture area is larger than that of the small diameter model, which may indicate that for a larger span, the surrounding rock mass is easier to move into.
Strain curves of elements along z direction at positions x = 18 mm and y = 17 mm at step 5.

Strain curves of elements along z direction at positions x = 18 mm and y = 17 mm at step 20.
3.2.2. U-Shaped Tunnel
(A) The Character of Loading Stress, AE and Accumulated AE of the Model. Figure 15 shows the stress-loading step curves of two models with different tunnel size of 20 mm × 25 mm and 30 mm × 30 mm (width × height), respectively. The models are loaded in x direction. The AE and accumulated AE curves are shown in Figure 16. For the model with tunnel size of 20 mm × 25 mm, at step 4, the loading stress comes to the peak value when the load in x direction is up to 48 MPa, which is about 1.85 times of the compressive strength. At step 5, the microcracks increase sharply and the loading stress drops to the residue strength of 21 MPa at the end of step 5. At the same time, the increase of microcracks becomes slow, meaning that most of the fracture events occur at step 5.
Stress vs. steps curves for different U-shaped tunnels.

AE accumulation/AE energy accumulation vs. steps curves of different U-shaped tunnels.
Similarly, for the model with tunnel size of 30 mm × 30 mm, at step 4, the loading stress comes to the peak value of 47 MPa, which is about 1.81 times of the compressive strength, while at step 5, the microcracks increases dramatically and the corresponding loading stress drops to 16 MPa which equals to the residue strength of the material. After step 5, the increase of microcracks gets slow, which also indicates that most of the microfracture events occur at step 5.
From Figure 15, it can be concluded that the load bearing capacity of model is almost unchanged when the span and cross-sectional area of tunnel are in some range. The peak load value of the small tunnel cross section model is 1.02 times of the large tunnel cross section model, which is almost the same. But after the peak value, the residual load bearing capacity for the small tunnel cross section model is 1.31 times the large one, which indicates that the load bearing capacity is increased with the decrease of tunnel span and cross-sectional area. This can also be seen from Figure 6, which also shows that for the small span and cross section area tunnel, the amount of microcracks and displacement energy released during failure are more than that of the large span tunnel.
(B) Failure Process Analysis on U-Shaped Tunnel
(1) For U-Shaped Tunnel with Size of 20 mm × 25 mm. Figure 7 shows the failure process of numerical model under the load in x direction. The elastic modulus and the maximum principal stress at certain steps are shown in Figures 17 (a) and 17 (b), respectively. With load increasing, microcracks first initiate at the periphery of the tunnel, and most of the microcracks concentrate at the two side walls. Some microcracks develop from the bottom of the side walls although most of the microcracks in the sidewalls are still in some distance from the wall. It can be seen that the new generated tunnel after zonal disintegration is still a round opening (see step 5 (4)). With the increase of the load, near to the first fracture ring, the second fracture ring forms (see from step 5 (12)). Due to the heterogeneity, the development of the fracture rings is discontinuous. With the increasing of load, the next fracture ring forms, but the space between the new formed one and the second fracture becomes larger (see step 5 (40)).

Zonal disintegration process under the load in x direction.
It should be noted that for a small radius of curvature, the failure mode is conjugate slip failure on the bottom of side walls, while for a larger radius of curvature, the fractures mainly propagate parallel to the side wall in some distance. As mentioned before, this is due to the different tangential compressive strain εθ caused by the radial displacement u of tunnel boundary with different radius of curvature.
It can be concluded that there are two prerequisite for the zonal disintegration, one is the large compressive stress acted along the axial direction of tunnel, the other is that the radius of curvature of the tunnel should be large. As is the same with the laboratory test [18].
Figures 18 and 19 are the stress curves at step 4 (peak value stage) and step 20 (after zonal disintegration formed) of elements along z direction at point x = 18 mm, y = 70 mm under the load in x direction. It can be seen that with the development of zonal disintegration, the strain in the fractured area is increased especially in the vicinity of tunnel sidewalls, which indicates that the zonal disintegration develops with the increasing of load.
Strain curves of elements along z direction at positions x = 18 mm and y = 17 mm at step 4.

Strain curves of elements along z direction at positions x = 18 mm and y = 17 mm at step 20.
(2) For U-Shaped Tunnel with Size of 30 mm × 30 mm. Figure 20 shows the failure process of a U-shaped tunnel with size of 20 mm × 25 mm under the load in x direction. The mirco-cracks initiated at the two side walls are not so many and the first fracture ring is formed relatively intact compared with the small size U-shaped tunnel. In addition, the fracture face is crushed and the distance between fracture rings increases with the tunnel span, which means the number of fracture rings decrease with the increase of tunnel span and cross section area.

Zonal disintegration process under the load in x direction.
Figures 21 and 22 show the strain curves of elements along z direction at points x = 18 mm, y = 70 mm under the load in x direction at step 4 (peak value stage) and step 20 (after zonal disintegration). The strain at the two sidewalls increases sharply at the beginning of zonal disintegration. With the increase of load steps (Figure 22), the local strain at some distance from the two sidewalls increases obviously, which means the fracture forms there thus causing a large displacement. It can be concluded that for a stable stage of zonal disintegration, the displacement of the fracture area is larger and with the increase of tunnel span and sidewall height, the increase of displacement is even larger and can be up to several order of magnitude.

Strain curves of elements along z direction at positions x = 18 mm and y = 17 mm at step 4.
Strain curves of elements along z direction at positions x = 18 mm and y = 17 mm at step 20.
From the figures shown above, some conclusions can be drawn.
The spacing between fractures is in direct proportion to the diameter of tunnel.
The new shape formed after fracture is still a round shape for both the circular tunnel and U-shaped tunnel. Moreover the fracture ring is not a standard circle, but a discontinuous one.
From the fracture characteristics shown in the simulation, the fracture surface is crushed other than intact and it will be more obvious with the increase of tunnel diameter. This phenomenon is closely related to the heterogeneity of rock material and will not occur in homogeneous material described in Gu's paper [18].
Under the same loading condition, the zonal disintegration is more likely to occur around large underground excavation.
(C) The Impact of the Direction of Maximum Principal Stress on Failure Mode of Tunnel. In Sections 3.2.2 (A) and 3.2.2 (B), we have discussed the failure characteristics of model under the load in X direction. Here we mainly focus on the failure characteristics under the load in Y and Z directions.
(1) Loading in Y Direction. Figure 23 shows the stress-steps curves along X, Y, and Z directions and Figure 24 shows the AE curve and accumulated AE curve. At step 13, the loading stress comes to the peak value of 32.9 MPa, which is about 1.3 times of the compressive strength of rock model in Y direction. Then the loading stress drops to the residual strength at step 15. Most of the mirco-cracks formed between step 9 and step 15. The AE amount increases sharply at step 15 and then decreases dramatically.

Stress vs. steps curves of numerical model.

AE accumulation/AE energy accumulation vs. steps curves.
The failure process under the load in Y direction is shown in Figure 25. The change of elastic modulus of the model at some specific steps is shown in Figure 25 (a) and the corresponding maximum principal stress distribution at each step is shown in Figure 25 (b). According to the simulated results, with the increase of load, stress concentration occurs in the roof and floor (see step 2 (0)) and microcracks initiate at the two side walls until two failure zones form (see step 12 (2)). Then several conjugate slip lines extend from both side failure zones (step 14 (3)) to the upper boundary of the model (see step 15 (14) and 20 (0)). So the failure mode under the load in Y direction is funnel failure.

Zonal disintegration process under the load in y direction.
Figures 26 and 27 show the strain-step curves of elements in the location of x = 18 mm, y = 70 mm along z direction at step 13 and step 20 under the load in Y direction. It can be seen from Figure 26 that the displacement at the two side walls is asymmetrical, but the failure zones and the conjugate slip lines at the two side walls are nearly symmetrical, while in Figure 27, the displacement is more symmetrical and the zonal disintegration is more obvious.

Strain curves of elements along z direction at positions x = 18 mm and y = 17 mm at step 13.
Strain curves of elements along z direction at positions x = 18 mm and y = 17 mm at step 20.
(2) Load in Z Direction. Figure 28 shows the stress-load step curves in X, Y, and Z directions. The AE curve and accumulated AE curve are shown in Figure 29. At step 13, the loading stress comes to the peak value of 32.1 MPa in Z direction, which is 1.2 times of the compress strength. At step 15, the loading stress drops to the residual strength. Most of the mirco-cracks propagate between step 11 and step 15. The amount of AE increases quickly at step 14 and step 15 and then decreases after step 15. The failure process and AE under the load in Y direction are almost the same with what was described above.

Stress vs. steps curves of numerical model.

AE accumulation/AE energy accumulation vs. Steps curves.
Figure 30 shows the failure process under the load in Z direction. With the increase of load, stress concentrates at the two side walls (step 2 (0)), but microcracks mainly occur at the roof and floor and are rarely seen near the two side walls. As shown at step 13 (0) and step 14 (14), some conjugate slip lines are formed in the roof and floor and then form into a horizontal fracture near the two side walls. With the load increase, the conjugated slip lines extend to the boundary of the model (step 15 (5) and step 20 (0)). So, the failure mode under the horizontal loading condition is conjugate slip failure.

Zonal disintegration process under the load in z direction.
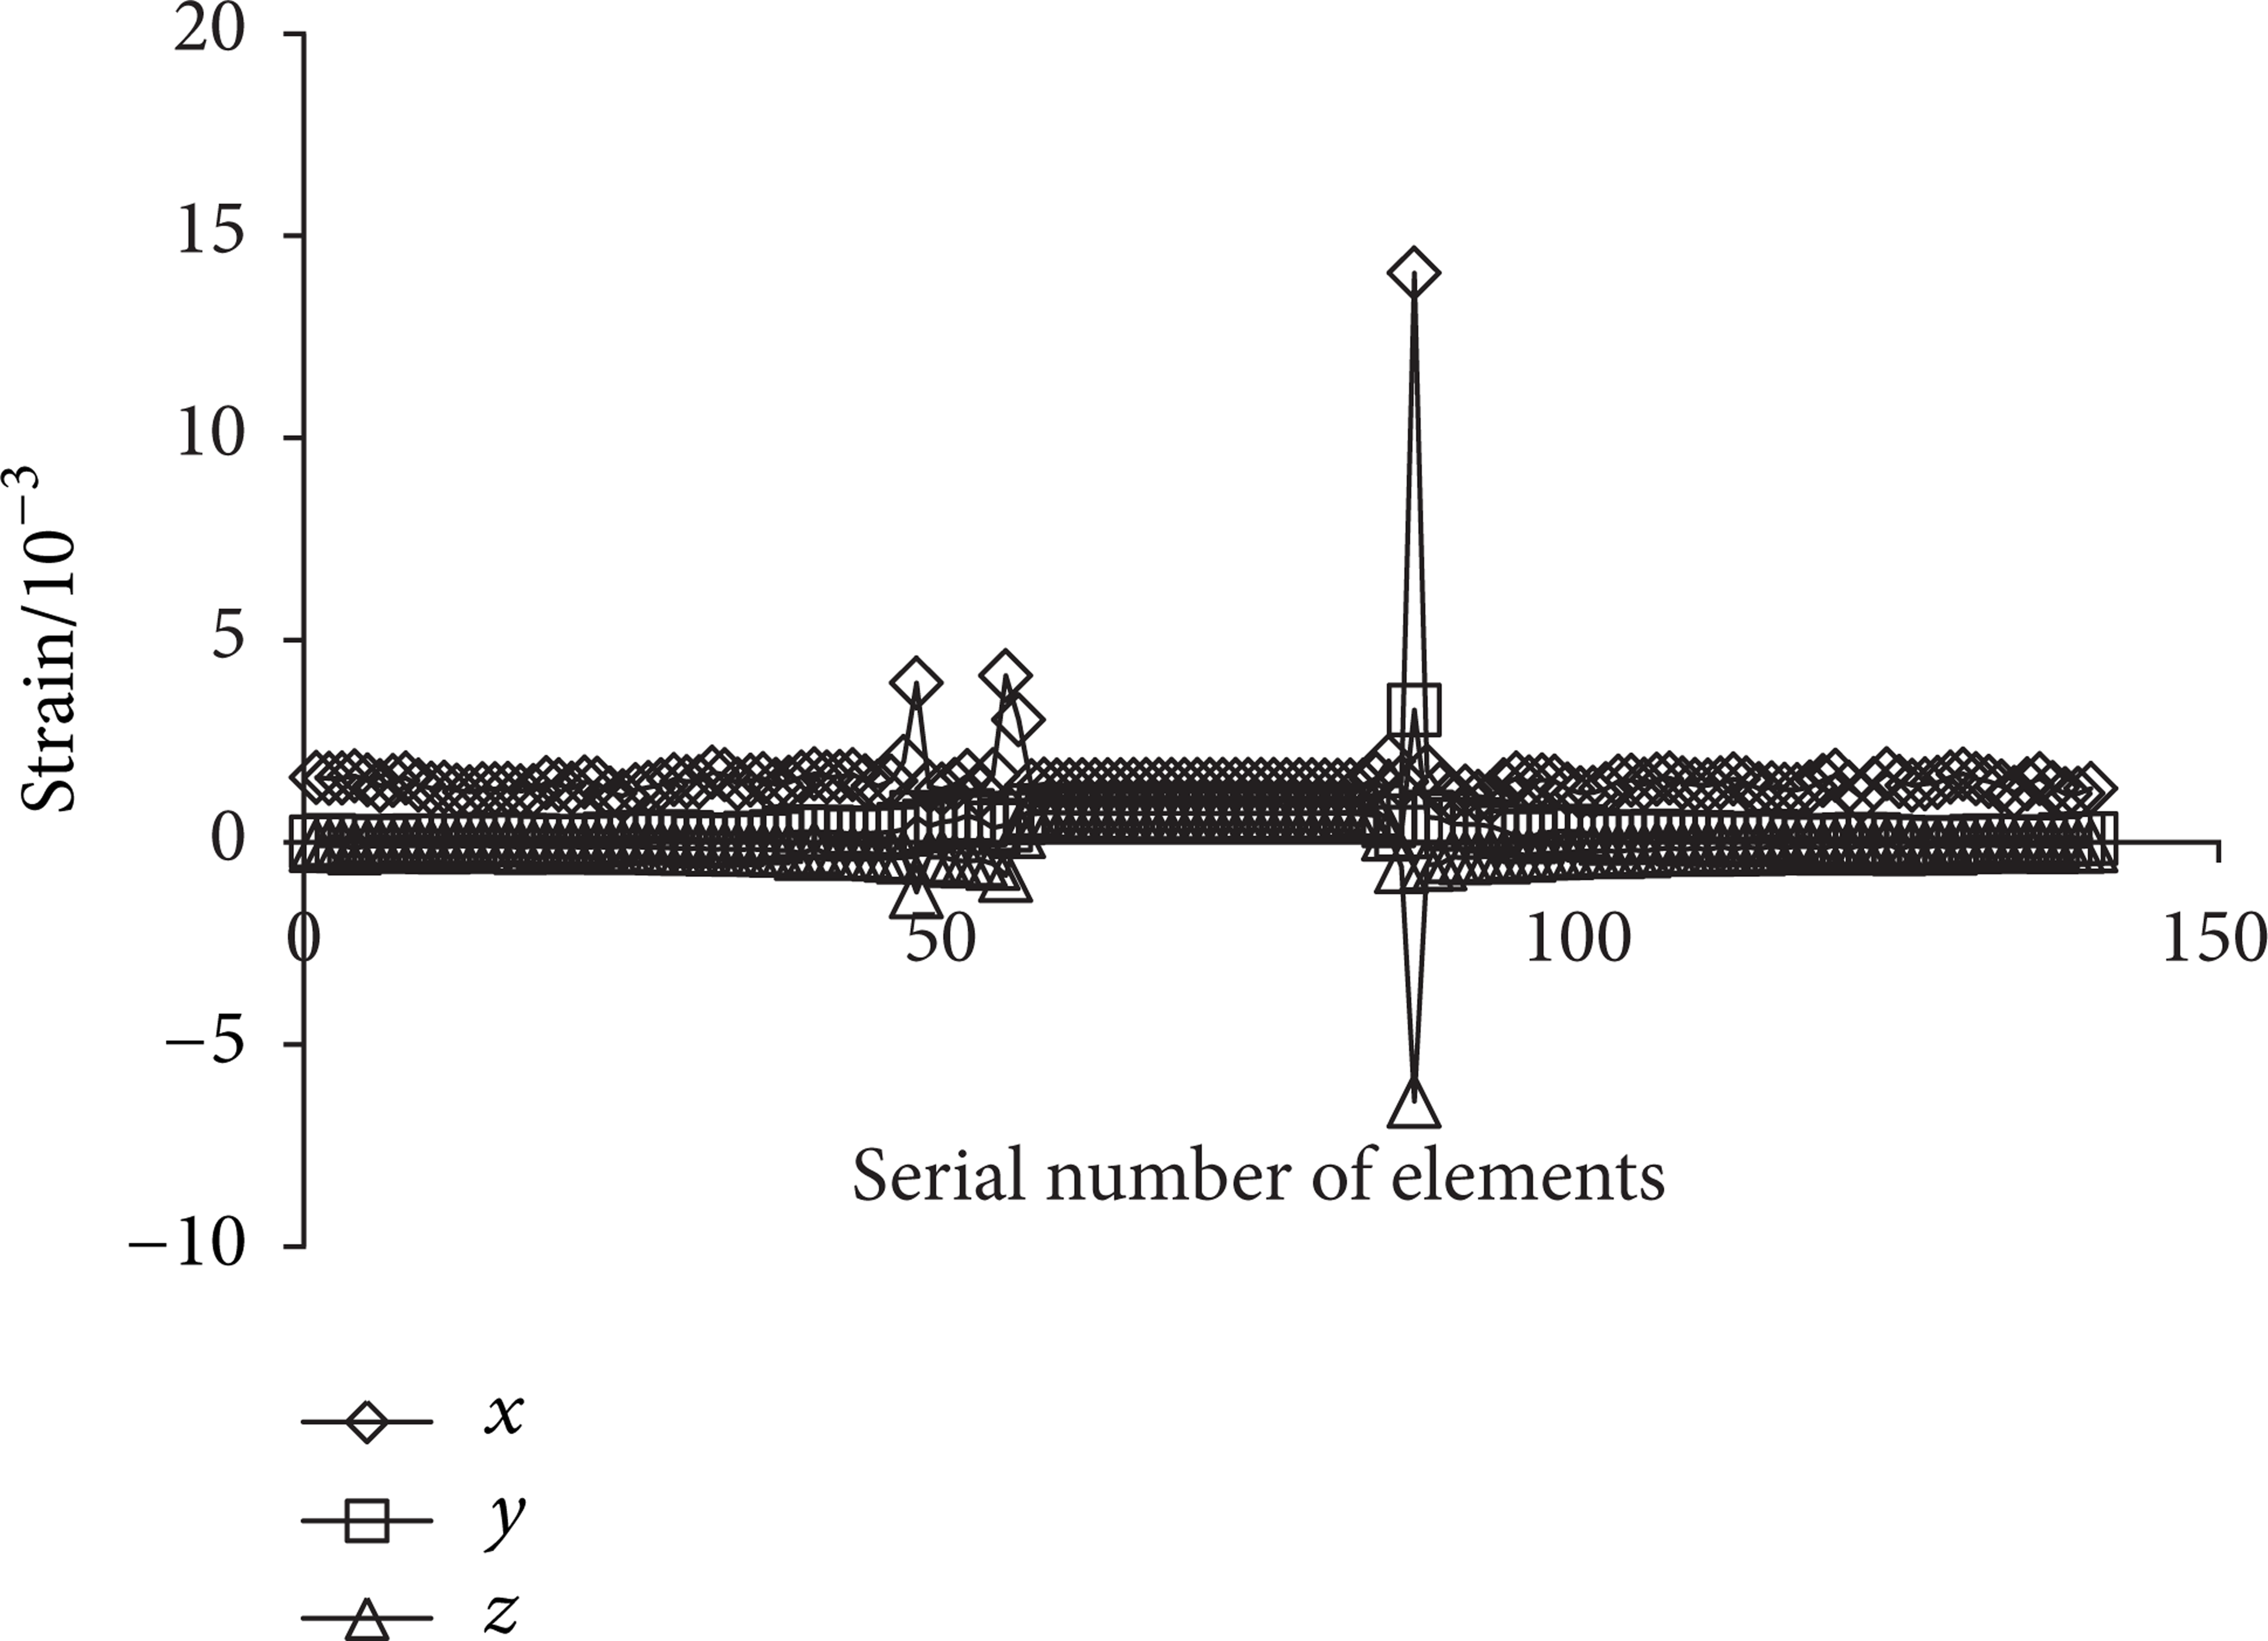
The stress-step curves of elements at x = 18 mm, y = 70 mm along Z direction at step 13 and step 20 under the load in Z direction are shown in Figures 31 and 32, respectively. From Figure 31, it can be seen that displacements at the two side walls are larger compared with the place far from the tunnel boundary, while as shown in Figure 32, the displacement at the loading point is much larger, which is different from the vertical loading condition.
Strain curves of elements along z direction at positions x = 18 mm and y = 17 mm at step 13.

Strain curves of elements along z direction at positions x = 18 mm and y = 17 mm at step 20.
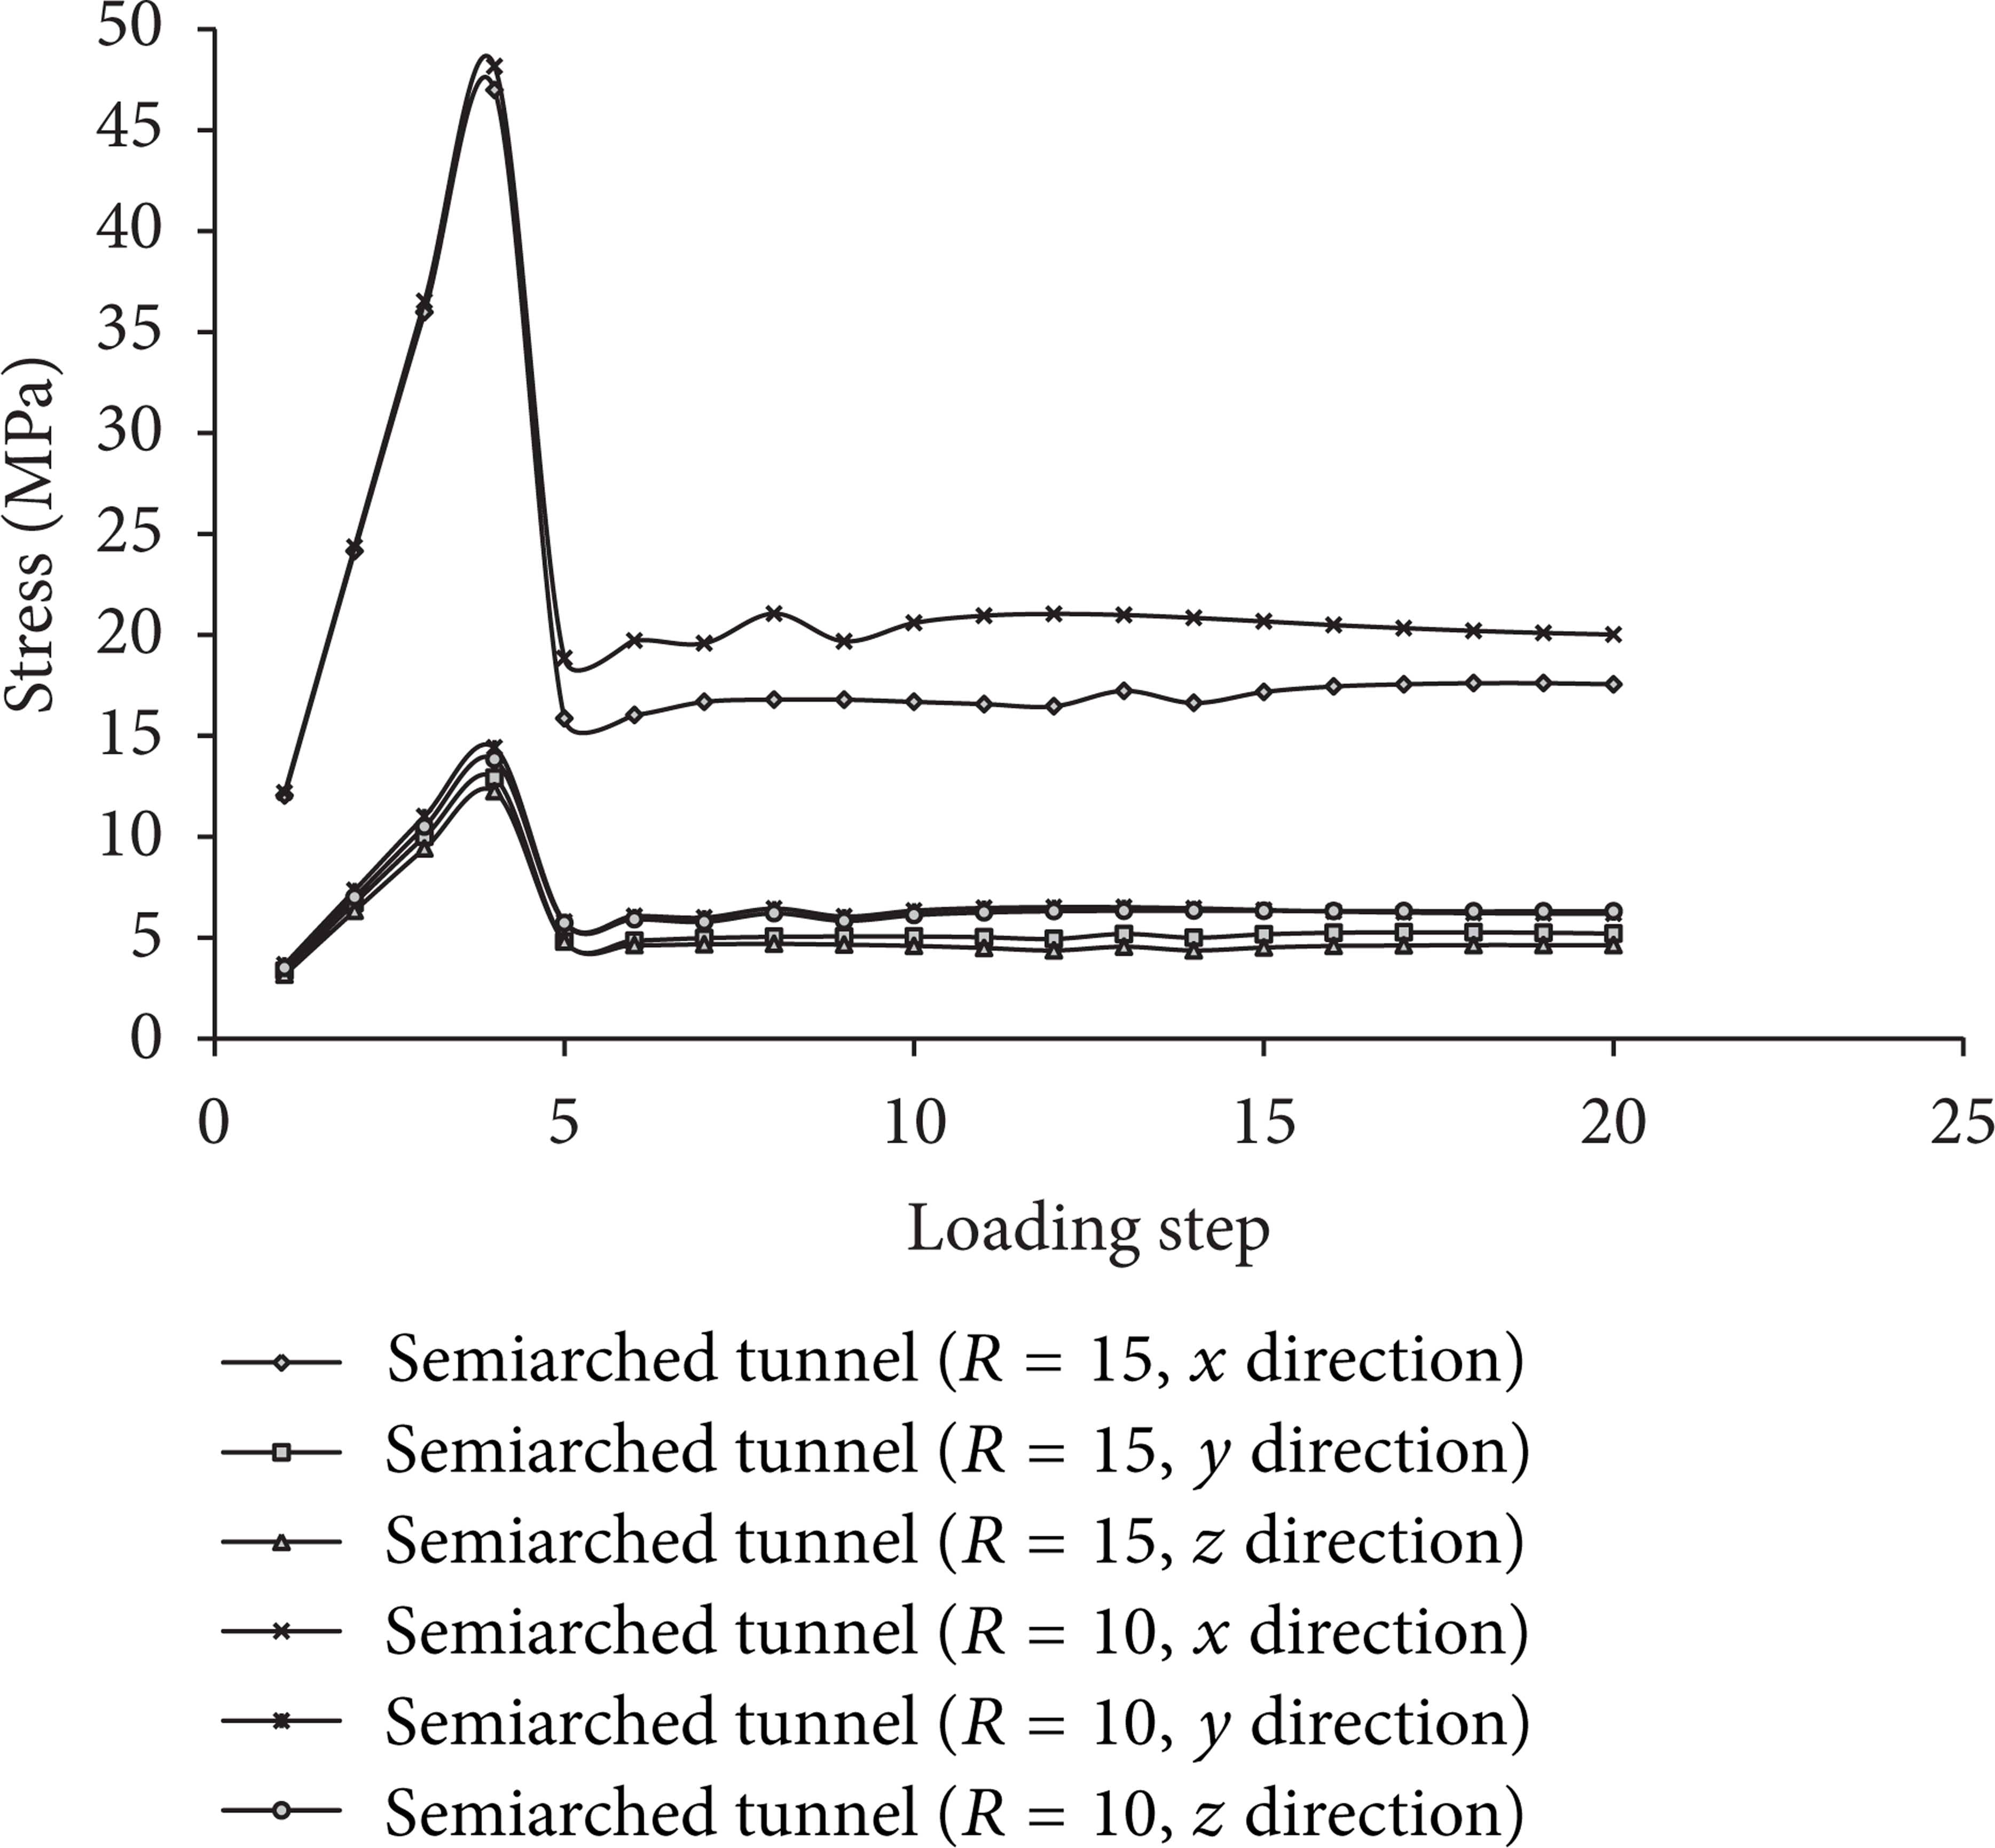
From the simulation results shown above, the direction of maximum principal stress has a very important impact on the failure mode of tunnel. When the tunnel axis is parallel to the maximum principal stress, the zonal disintegration may occur; when the maximum principal stress is in the vertical direction, the funnel failure will occur; when the maximum principal stress is in the horizontal direction, conjugated slip failure will occur at the roof and floor of tunnel. In addition, the load bearing capacity of tunnel depends on the direction of the maximum principal stress. The load bearing capacity is higher when the direction of maximum principal stress is parallel to the tunnel axis and is the lower for vertical and horizontal loads. Because the maximum tectonic stress in deep rock mass is always in horizontal direction, the zonal disintegration may occur when the tunnel axis is parallel to the maximum horizontal stress. For this reason, the occurrence of zonal disintegration must be under some conditions and is not a universal phenomenon. Two prerequisites must be satisfied: one is the relatively high horizontal stress and the other is a large tunnel diameter. This conclusion is in agreement with the precious conclusions [18]. Thus, the alignment of tunnel should be carefully considered with regard to the direction of tectonic stress and magnitude before tunnel construction.
4. Conclusions
There are lots of factors posing an impact on the zonal disintegration. In this paper, a large-scale RFPA-Parallel analysis system has been used to analyze the failure process of numerical specimens with different tunnel cross-sections. The zonal disintegration phenomenon is reproduced successfully and the effects of tunnel cross sections and the direction of the maximum principal stress on zonal disintegration are discussed. The main conclusions are drawn as follows.
Under a high compressive stress along the axial direction of tunnel, the zonal disintegration may develop in the surrounding rock mass. For a small axial compressive load and a small tunnel diameter, the microcracks near to the tunnel periphery are mainly conjugate slip lines. While for a large axial compressive load and large tunnel diameter, the fracture rings of zonal disintegration will generate at a distance from the tunnel periphery.
The zonal disintegration and the stability of tunnel are influenced by the size and shape of tunnel. The distance between the fracture rings is in direction ratio with the tunnel diameter. The cross section of the new formed tunnel after zonal disintegration is circular and is independent on its initial shape. The fracture rings are not real circles but are discontinuous circles. The fracture rings are fragmented due to the heterogeneity of rock mass and will be more fragmented with the increase of tunnel diameter. Under the same loading condition, the larger the diameter is, the more fragmented the fracture is, especially for the circular tunnel shape.
The failure mode and the load bearing capacity of tunnel depend on the direction of the maximum principal stress. When the maximum principal stress is along the tunnel axis, the zonal disintegration may be developed and the load bearing capacity of tunnel is higher compared with other loading conditions. When the maximum principal stress is vertical to the roof and floor, the failure mode is funnel shaped failure. When the maximum principal stress is horizontal to the side wall of tunnel, the failure mode is conjugate slip line fractures in the roof and floor and the load bearing capacity is the lowest.
The zonal disintegration is not a universal phenomenon in deep rock mass. Two conditions must be satisfied, one is that there exists a large horizontal tectonic stress along the tunnel axis, the other is that the radius of curvature of tunnel should be large.
Footnotes
Acknowledgments
The study presented in this paper was jointly funded by the National Natural Science Foundation of China (nos. 50934006, 41172265, and 51304036), the National Technology R&D Program for the 12th Five-Year Plan (no. 2012BAB08B06), the Key Project for the Nature Science Research from the Guizhou Province Bureau of Education (2010003), the Governor Fund Project for Outstanding Scientific and Technological Education Talent from the Guizhou Province (2011-36), Guizhou Provincial Scientific and Technological Program (GY2011-3063), and Special Project for Guizhou Province High-Level Personnel Scientific Research (TZJF-2010-044).