
Abstract
With the rapid development of urban transport and the sharp increase in vehicle population, traffic accidents form one of the most important causes of urban traffic congestion other than the imbalance between traffic supply and demand. Traffic congestion causes severe problems, such as environment contamination and energy dissipation. Therefore, it would be useful to analyze the congestion propagation characteristics after traffic accidents. Numerical analysis and computer simulation were two of the typical methods used at present to study the traffic congestion propagation properties. The latter was more widespread as it is more consistent with the actual traffic flow and more visual than the former. In this paper, an improved cellular automata (CA) model was presented to analyze traffic congestion propagation properties and to evaluate control strategies. In order to apply them to urban traffic flow simulation, the CA models have been improved and expanded on. Computer simulations were built for congestion not only extending to the upstream intersection, but also the upstream intersection and the entire road network, respectively. Congestion propagation characteristics after road traffic accidents were obtained, and controls of different severities and durations were analyzed. The results provide the theoretical foundation and practical means for the control of congestion.
1. Introduction
Urban traffic congestion has become one of the most representative factors severely influencing urban economic development, which also causes problems such as air and environmental pollution and energy dissipation. Many reasons could attribute to traffic congestion, and traffic accident is one of the most important causes [1–3]. Due to the characteristics of city's traffic, as well as the unpredictable feature of the timing and location of traffic accidents, in general, effective measures could not be taken in time. Therefore, traffic accidents often lead to lane blockages, and the resultant vehicle queues could rapidly extend to neighboring intersections and links upstream. To resolve the traffic accident as soon as possible, effective measures for decreasing the areas influencing by traffic accidents and recovering normal traffic flow must be conducted. Hence, it would be useful to analyze urban traffic congestion propagation characteristics, which could help tin inhibiting and dispersing traffic congestion.
Scholars have done a lot of research into the impact of traffic accidents on the road network. Edie suggested a variation in the car-following and continuum theories in an effort to make them more accurate for less-than-optimal traffic densities [4]. Brastow built a dynamic deterministic traffic assignment algorithm, which is particularly applicable to congested networks [5]. By dynamically reassigning flow elements to their shortest-time paths whenever elements reach nodes that intersect alternative partial paths to their destinations, this model forces the distribution of flows to approach “user-optimized” flows at any instant. Wie et al. concentrated on dynamic user-optimal traffic assignment. This assignment method was popularly used on congested multidestination city road networks [6]. Sanso and Soumis proposed a general framework for assessing the effectiveness of the transportation network in the event of a traffic accident [7]. Afterwards, Sanso˘ developed the idea to show how to assess the impact of traffic accidents on the efficiency of urban traffic networks considering the impact of traffic information [8]. Eddelbuttel formulated the optimization of traffic lights in a congested network as a linear programming problem [9]. Roberg proposed a simulation model that concentrates on a holistic view of traffic jam formation in a setting of isotropic flow in which incidents can be introduced anywhere in the network [10]. Later, Roberg et al. researched the properties of incident-induced traffic jams on rectangular grid networks and proposed possible measures for preventing and controlling them [11]. Bando et al. presented a dynamic model of traffic congestion based on the equation motion of each vehicle [12]. Kerner and Rehbornobserved complex space-time structures of traffic inside a large traffic jam [13]. Wright and Robergdeveloped simple models for jam growth arising from a single bottleneck and spreading to an idealized grid network [14, 15]. Sakakibara et al. investigated the effect of obstacles on the formation of traffic jams for traffic flow in a network of city roads [16]. Tong and Wongbuilt a predictive dynamic traffic assignment model for congested capacity-constrained road networks and provided a numerical example to illustrate the effectiveness of the proposed method [17]. Nagel et al. focused on microscopic modeling, that is, coupled differential equations, cellular automata, and coupled maps, and discussed the phase transition behavior of these models [18]. He found that the whole field was moving away from a rather static view of traffic toward a dynamic view using simulation as an important tool.
Analytical or simulate method was used in the above researches. While simulate methods could bring together all kinds of complex traffic circumstances, and they are simpler and more convenient to operate, actual traffic was simplified when using analytical methods with relatively strict assumptions, which result in final results inconsistent with actual traffic patterns. The simplicity and assumption caused a large gap between actual traffic phenomena and the aforementioned models. Those models were useful for understanding how congestion spreads, but the accuracy is on the low side. Thus, it is necessary to find a more accurate model to reflect the dynamics of traffic flow on city roads based on the previous work.
Traffic cellular automata (TCA) are microscopic traffic flow models. They are generated from the physical science of statistical mechanics, having the advantage of reproducing macroscopic behavior based on a minimal description of microscopic interactions.
The basic concepts of cellular automata (CA) can be traced back as far as 1948, when von Neumann introduced them to analyze biological systems. Von Neumann's outstanding work consisted of the notions of self-reproduction and theoretical machines. Then, von Neumann started to cooperate with Stanislaw Marcin Ulam, who introduced him to the concepts of cellular spaces, cell states, and so forth. Turing proposed a continuous model that illustrated reaction-diffusion in the context of morphogenesis [19–21]. This model has a direct analogy with a simplified biological organism [22]. In 1986, Cremer and Ludwig applied CA to the study of traffic flow for the first time [23]. In recent years, TCA models have been used for traffic flow simulation in large-scale systems. Two of the most famous cellular automaton traffic flow models are the one-dimensional CA model proposed by Nagel and Schreckenberg in 1992 [24], which is named Nasch model in short, and the two-dimensional CA model proposed by Biham, Middleton, and Levine (BML) at the same time [25], which is named BML model in short. These two types of model are based on CA-184 named by Wolfram [26–28]. Among such CA models, the Nasch model is suitable for studying links and the BML model is suitable for studying road networks.
Traffic flow on an urban road network with a complicated structure is difficult to predict due to its randomness, discreteness, and time-varying properties. It is necessary to model traffic accident propagation properties combined with the urban road network structure and the traffic flow theory in order to develop effective control measures. Therefore, this paper will develop traffic accident propagation properties in basic links on a city road network using CA models based on the literature and traffic flow theory. The CA-184 model will be improved to make it closer to realistic traffic. The study is of great significance for providing the theoretical foundation and practical means for the control of congestion.
2. Problem Description and Mathematical Notation
The urban road network is composed of links and intersections. The links play the part of connecting the intersections. In the following, traffic flow characteristics will be discussed when there is a traffic accident or not.
A simple example of road structure is shown in Figure 1. This road structure has three segments in accordance with its structural features and traffic functions. Segment I is a channelization approaching the downstream intersection. In this section, the vehicles have to travel in one direction without changing lanes or overtaking. Here, traffic accidents are usually rear-ends that interfere with the saturation flow rate and lead to queuing. Segment II is a basic link where vehicles can travel freely, change lanes, and overtake. Here, traffic accidents include rear-ends and side collisions. They cause the flow rate to decrease at the downstream intersection and can even cause the queue to extend upstream. Segment III is where the cars are driving out of the upstream intersection. This paper will analyze traffic accident propagation properties in Segment II.

Simple example of road structure.
From a theoretical point of view, the physical environment and the cells' states, which can be described in four rules listed as follows, play an important role in the CA models. In Nasch's model, the mathematical transition rules of N vehicles on the fixed grid of length L are expressed by the four rules given as follows.
Rule 1 (acceleration stage). In this stage, vehicle velocity increases to drive freely. Vehicle velocity at time n can be expressed as follows:

where v n is vehicle speed at time n. v max is the maximum vehicle speed.
Rule 2 (deceleration stage). In this stage, vehicle velocity decreases to avoid rear-end accidents. Vehicle velocity at time n can be expressed as follows:

and vehicle position satisfies the following equation to stay safe:

where x n is vehicle position at time n. d n is the safety distance between vehicles.
Rule 3 (randomization stage). Vehicle velocity changes according to the surroundings.
While v n > 0, vehicle velocity will be expressed as follows:

The randomization probability is defined asp. In this situation, p ∈ (0, 1).
Rule 4 (movement stage). Vehicle position updates with the changing of vehicle velocity, which can be written as follows:

The grid border is set up as open controlled, which means that it detects the last vehicle on the link at every time step. While the conditions of the input vehicle are satisfied, vehicles on the road are generated randomly according to the Poisson distribution. The Poisson distribution can be expressed as follows:
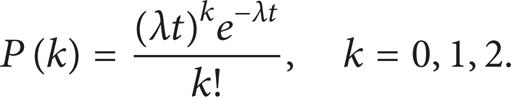
It should be noted that, in (6), P(k) is the probability of k vehicles arriving within the interval t, λ is the average arrival rate in the unit interval (veh/2 s), t is each counting interval duration (2 s), and e is the Napierian logarithm.
3. Numerical Simulation
The queue length is a typical indicator for evaluating traffic congestion. Generally, the queue model consists of the queuing theory, the cumulative curve, and the traffic wave. Even though these methods have solved a lot of problems in traffic research, there is still a gap in terms of modeling and actual traffic. Therefore, the following comparison method will be used to study the three different congestion states with CA models, which are listed in the following.
3.1. The Traffic Congestion Does Not Extend to the Upstream Intersection
Generally, there are two stages for the developing of traffic congestion after traffic accidents happen: the growing queue stage and the decreasing queue stage. The queue length will reach a maximum at the intersection of these two stages. The Nasch models were adopted to simulate the characteristics and the regular pattern of link traffic flow following an accident.
The parameter settings are as follows: the link includes 200 cells and is about 1.5 km long. The simulation time is 1 h, and the accident happens 75 m far away from the link exit when the program reaches 1000 s. After simulation, the space-time phase diagram after the accident happened for 200 s was shown in Figure 2, and the diagram without an accident was shown in Figure 3.

The space-time phase diagram with an accident.
The space-time phase diagram without an accident.
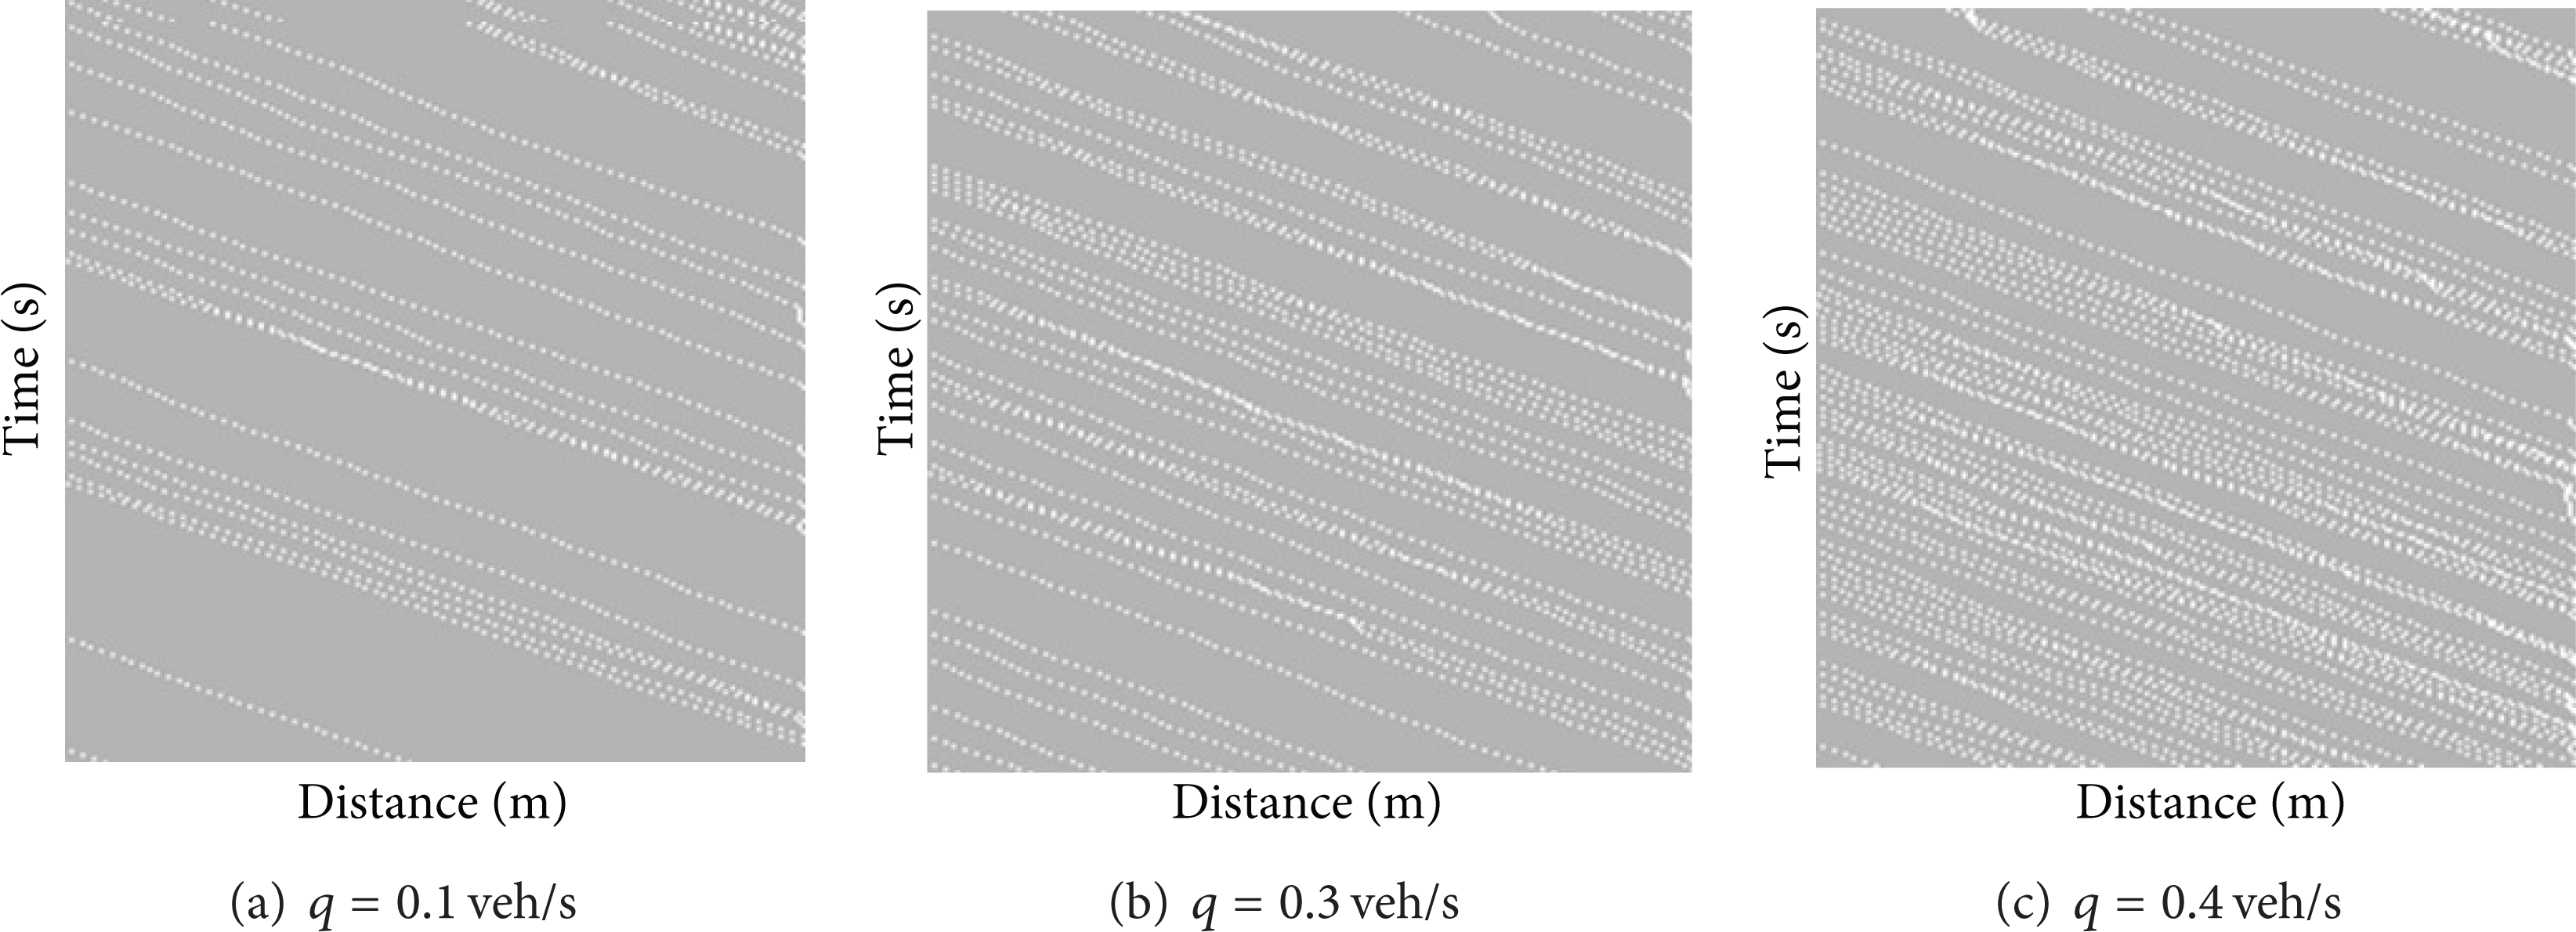
To test the simulation effect, the parameters were input into the cumulative curve models (CCMs) to obtain queue length. The maximum queue length under the varying arriving flow rate A is compared with the result of the CA simulation, which is shown in Figure 4.
The maximum queue length of the CA simulation compared to the CCMs.
It can be seen in Figure 4 that the CA simulation values have the same changing trend with that of the calculated ones; moreover, CA simulation results are a little higher than those obtained by calculation. While the CA model takes into account the vehicles' random arrivals, the vehicles' randomization, and so on, results obtained by CA model are more accurate than calculated ones. Therefore, all of these prove that the CA model is closer to the actual traffic than the calculated values.
3.2. The Traffic Congestion Extends to the Upstream Intersection
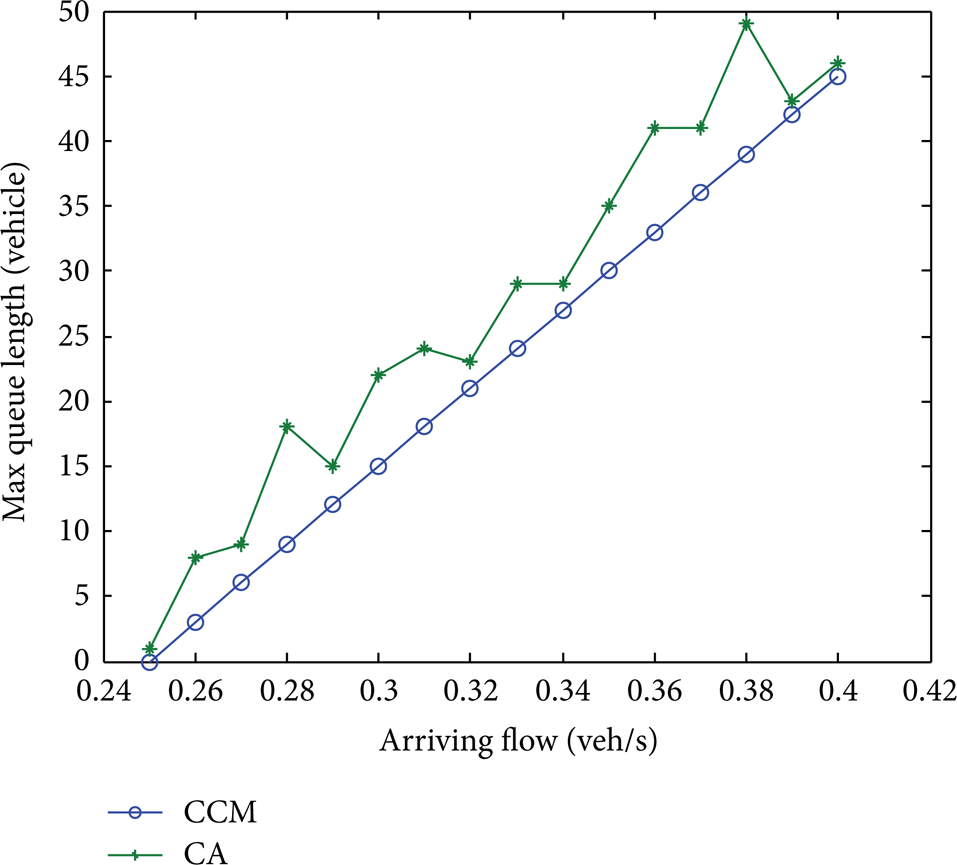
When the vehicle queue extends to the upstream intersection, the traffic congestion of the first upstream intersection I0 is shown in Figure 5. In this condition, the through-traffic movements F 1T at the west entrance, the left-turning F 1L at the north entrance, and the right-turning F 1R at the south entrance cannot go through the intersectionI0. Along with the extension of the accident influencing area, the flow rates of other streams will gradually decrease, even as far as 0.
The traffic congestion at the upstream intersection.
The parameters that are used to simulate are set up as those in Section 3.1. Similarly, the maximum queue length under the varying arriving flow rate obtained by the CA model is compared with the calculated values, and the comparison result is plotted in Figure 6. It can be seen in Figure 6 that the results obtained by the CA model and the calculated method show nearly the same trend. However, the curve of the CA models is more volatile than that of the calculated method, which is quite smooth. This is due to the fact that CA models take into account more random factors.

The maximum queue length of the CA simulation compared with the CCMs at the road link.
3.3. The Traffic Congestion Extends to the Entire Road Network
The queue features of intersection I0 have been analyzed in Section 3.2. If the control measures are not taken in time and the accident continues to spread, then the traffic congestion will diffuse to the entire surrounding network. This will result in traffic congestion at intersection I1 – w, at which the vehicle queue for the west entrance will extend upstream. In a similar way, it will result in the congestion of intersection I1 – n, at which the queue for the north entrance extends upstream. Also, it will result in the congestion of intersection I1 – s, at which the queue for the south entrance extends upstream. Similarly, intersection I1 – w will continue to extend to I2 – ww, I2 – wn, andI2 – ws, I1 – n will continue to extend to I2 – nn, I2 – nw, and I2 – ne, and I1 – s will continue to extend to I2 – ss, I2 – sw, and I2 – se. The schematic diagram for traffic congestion extends to the entire road network is plotted in Figure 7. As can be seen in Figure 7, the congestion boundary will be approximately diamond shaped.
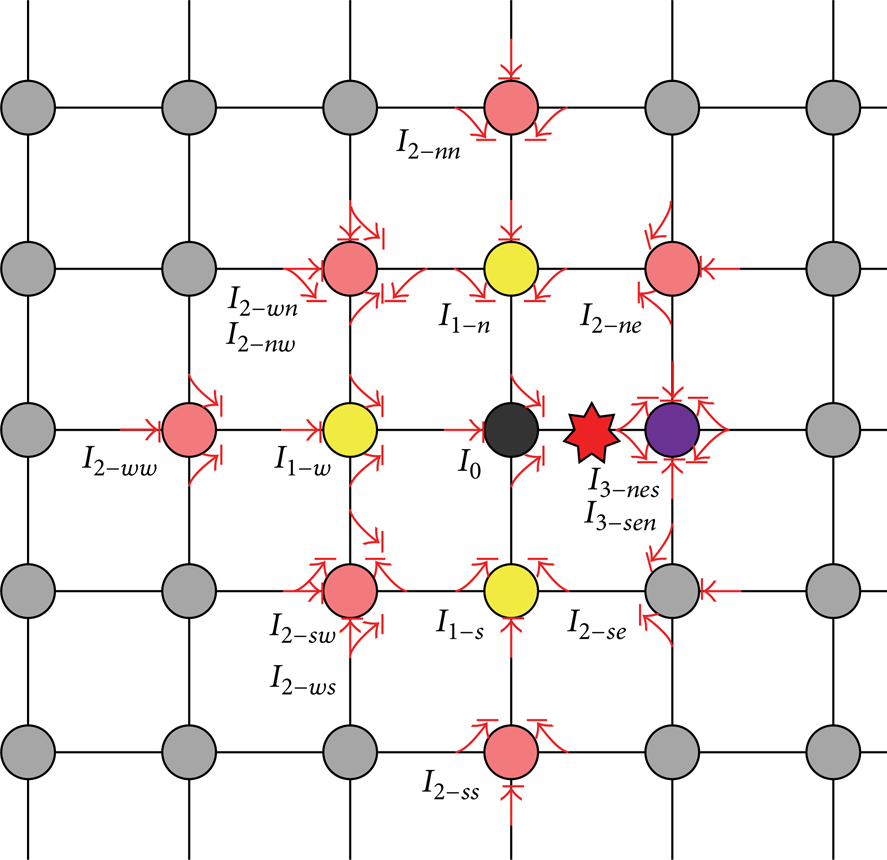
The congestion area on the road network.
Traffic accidents leading to the spread of congestion were analyzed theoretically in the above. Actually, the queue features of every intersection refer back to the outcome of the previous intersectionI0. Combining this with previous queue models and the flow rate variation of every node, we can see that the congestion boundary will be approximately diamond shaped within a given time interval after the accident. This conclusion was verified using the CA simulation and the simulation result is shown in Figure 8. It can be seen in Figure 8 that the congestion boundary is approximately diamond shaped in the network.

The CA simulation of the congestion propagation on the road network.
4. Analysis of Traffic Control Measures
Limited by the characteristic of city traffic, the unpredictable features of the timing, and location of traffic accidents, effective traffic control measures could not be conducted in time, which lead to the spread of traffic congestion and result in server consequence. Usually, temporary traffic control measures will be taken to decrease and dissipate the congestion. The severity degree and duration of traffic control measures depend on the level of traffic accident. According to the description in Section 3, the vehicle queuing length was extended to the links and intersections, then to the entire road network. The traffic accident propagation range was analyzed based on the congestion area of the road network. Thus, detailed traffic control measures could be implemented according to the determined space range. However, the duration and severity of the required traffic control measures are more difficult to estimate. To analyze the effects of traffic control measures with different severities and durations, the link traffic accident was utilized as the research object using the method of numerical simulation of CA.
4.1. The Effects of Traffic Controls with Different Severities
The parameters are set as follows: boundary conditions are set to be the open one; the initial arrival rate of vehicles is 0.5 veh/s; the link includes 200 cells and its length is about 1.5 km; the simulation time is 5000 s; the accident happens 75 m away from the link exit when the program has been running for 1000 s. The accident duration is 300 s; the upstream flow is limited from the start to the end of the accident. The limited flow rate is 0.4 veh/s, 0.2 veh/s, and 0.1 veh/s, respectively. Accident data will be analyzed for 2000 s following the start of the accident.
A virtual cross-section 100 m upstream of the accident was set. The variation in the average speed over time was analyzed and depicted, which is shown in Figures 9, 10, 11, and 12. In these figures, time is defined as the horizontal axis and its unit is 20 times the simulation time step. The average speed is defined as the vertical axis and its unit is m/s. The average speed under different severities of controls limiting flow is shown in Figures 9–12. It can be seen in these figures that the average speed increases with greater control severity.

The average speed without limited flow, q = 0.4 veh/s.
The average speed with limited flow, q = 0.4 veh/s.

The average speed with limited flow, q = 0.2 veh/s.
The average speed with limited flow, q = 0.1 veh/s.
4.2. The Effect of Traffic Controls with Different Durations
Parameters are set as follows: boundary conditions are set to be the open one; the initial arrival rate of the vehicles is 0.5 veh/s, the link includes 200 cells and its length is about 1.5 km; the simulation time is 5000 s, and the accident happens 75 m from the link exit when the program has been running for 1000 s. The accident duration is 300 s, the upstream will limited at 300 s, 600 s, and 900 s, respectively. Data will be analyzed for 2000 s following the start of the accident.
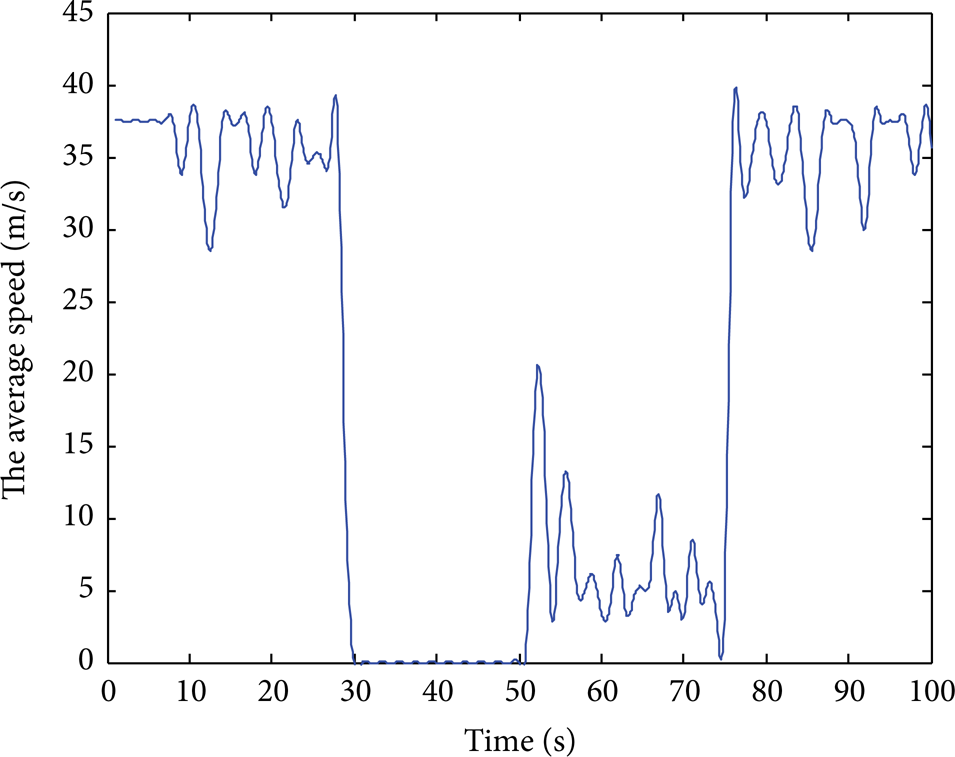
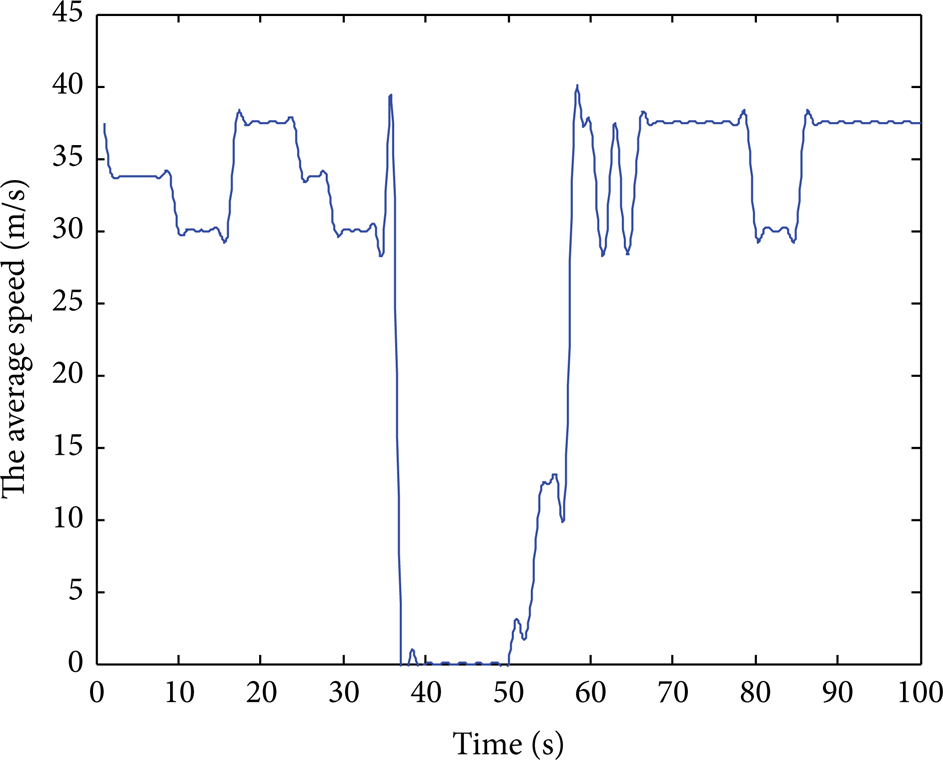
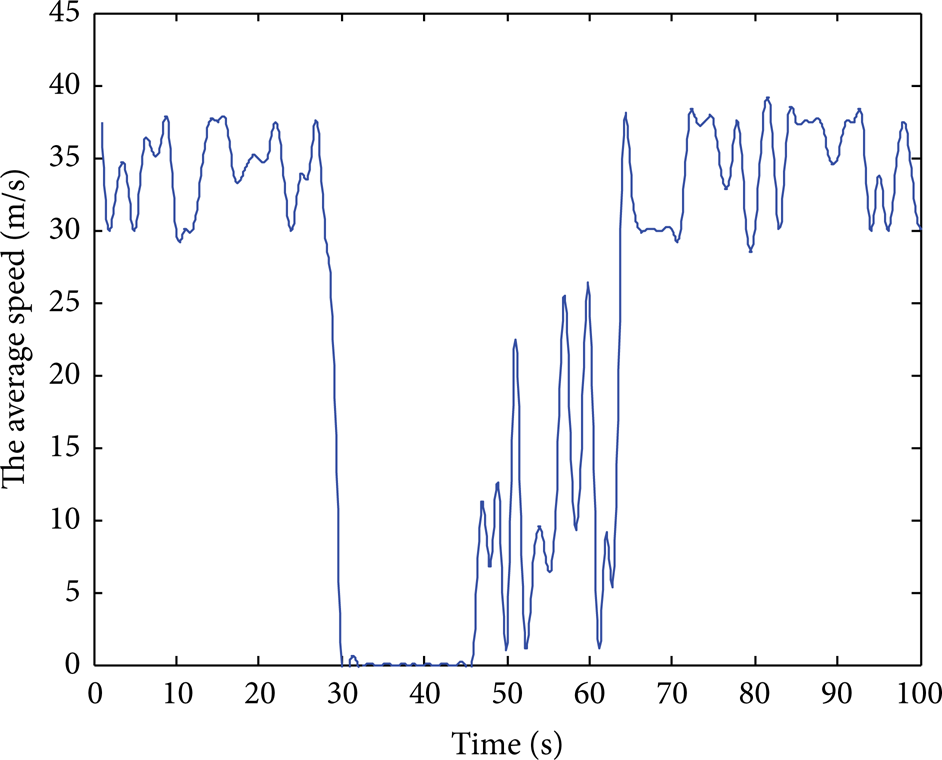
Like the above case, a virtual cross-section 100 m upstream of the accident was set. The variation in the average speed over time was analyzed and depicted, which is shown in Figures 13, 14, 15, and 16. Time is also defined as the horizontal axis and its unit is 20 times the simulation time step. The average speed is defined as the vertical axis and its unit is m/s. The average speed under different durations of limited flow is shown in Figures 13–16. It can be seen in these figures that the average speed increases as the control duration increases.

The average speed without limited flow.
The average speed with limited flow, duration 300 s.

The average speed with limited flow, duration 600 s.

The average speed with limited flow, duration 900 s.
It can be concluded from the above analysis that the greater the duration and severity of traffic control measures are, the larger the average speed can reach. However, the more severe and longer traffic controls will cost much more manpower and material resources. Therefore, suitable traffic controls should be considered.
5. Conclusions
Urban road traffic accidents generally result in traffic congestion. To resolve the traffic accident as soon as possible, effective and suitable traffic control measures for decreasing the areas influencing by traffic accidents and recovering normal traffic flow must be conducted. Therefore, the development and propagation of traffic congestion must be studied. An improved CA model was introduced in this paper to simulate traffic congestion propagation following a traffic accident on a basic link. Based on this, the effectiveness of traffic control measures with different severities and durations was analyzed to discover the influence of the severity and duration of traffic control measures on traffic congestion propagation. It would be desirable to obtain the propagation properties of traffic congestion under different durations of accidents and to provide theoretical support for our conclusions regarding control severity and duration.
However, due to the limitation on simulation times, it is hard to investigate the influence of traffic duration, flow, and the capacity of road on urban traffic congestion. Besides, in this paper, data used to simulate was collected in a traffic light cycle; the impact of driving control and parking control after traffic accident on traffic congestion cannot be evaluated. While urban traffic congestion is attributed to many causes, in addition to the complexity of urban traffic, there are still many issues to be perfected. Traffic signal controls, mixed traffic, information guidance, and so forth, will be our focus in the future.
Conflict of Interests
The authors declare that there is no conflict of interests regarding the publication of this paper.
Footnotes
Acknowledgment
This research was supported by the program of the National Nature Science Foundation of China under Grant no. 51208225and the National Natural Science Foundation of China (Grant no. 51375200).