
Abstract
Car-following model has important applications in traffic and safety engineering. To enhance the accuracy of model in predicting behavior of individual driver, considerable studies strive to improve the model calibration technologies. However, microscopic car-following models are generally calibrated by using macroscopic traffic data ignoring measurement errors-in-variables that leads to unreliable and erroneous conclusions. This paper aims to develop a technology to calibrate the well-known Van Aerde model. Particularly, the effect of measurement errors-in-variables on the accuracy of estimate is considered. In order to complete calibration of the model using microscopic data, a new parameter estimate method named two-step approach is proposed. The result shows that the modified Van Aerde model to a certain extent is more reliable than the generic model.
1. Introduction
Car-following models can be used to describe the process of drivers following each other and the interaction between adjacent vehicles in the same lane. Therefore, the models have become widely preferred for applications in traffic and safety engineering, for example, for capacity analysis, traffic simulation, network analysis, and Advance Vehicle Control [1–3]. Especially, as microscopic traffic data (such as trajectory data and floating car data) have become more available, the problem of calibrating car-following traffic flow models with real microscopic data has raised some interest in the literatures [1–9].
Despite the importance of car-following models, however, there are still some drawbacks in the calibration of these models. First, the car-following models have been generally calibrated by using macroscopic traffic data and validated by comparing outputs aggregated at a macroscopic level [2, 7, 10–12]. Using macroscopic data to calibrate a microscopic model would ignore differences of vehicle behavior (such as speed choice and headway choice) within a traffic stream. Second, it is always supposed that there is a determinate relationship between the variables. Also, the model dependent and independent variables are appointed subjectively. Unfortunately, it is not always clear in traffic flow theory which variable should be set to be independent variable and which should be set to be dependent variable [13]. Moreover, it is often supposed that the independent variables are measured exactly and only the dependent variable has errors associated with measurement. However, the observed data will always contain measurement errors [9, 14, 15]. More and more studies indicated that measurement errors-in-variables (EIV) can yield a considerable bias in the estimation results and consequently reduce reliability of the models [9, 14, 15].
This paper chooses the Van Aerde model to demonstrate the improvement for calibration of the car-following model by considering measurement errors. The advantage of this model is that it amalgamates the Greenshields and Pipe car-following models [10–13, 15]. Therefore, it has attracted attention of many researchers [10–13, 16, 17]. The remainder of this paper is organized as follows. In Section 2, Van Aerde car-following model is introduced and modified. The model calibration method is provided in Section 3, and the estimation results are in Section 4. Section 5 is the conclusion.
2. Van Aerde Car-Following Model
2.1. Van-Aerde Car-Following Model
The Van Aerde car-following model was developed by Van Aerde [10] and Van-Aerde and Rakha [11]. It is formulated as
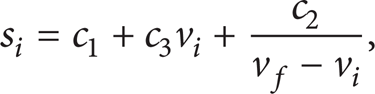
where s i is the spacing and distance headway between vehicle i and vehicle i – 1 in the same lane (m), v i is the speed of the vehicle i (m/s), v f is the facility free-flow speed (m/s), c1 is a fixed distance headway constant (m), c2 is a variable headway constant (m2/s), and c3 is a variable distance headway constant (s−1). This combination provides a linear increase in vehicle speed as the distance headway increases with a smooth transition from the congested regime to the uncongested regime. Specifically, it makes the Van Aerde model amalgamating the Greenshields and Pipes car-following models, and its logic has been assimilated into traffic simulation software [9, 12].
In order to calibrate the model, it is often supposed that the traffic stream is in steady-state and that speed-density relationship is well established [10, 11, 13]. Considering the relationship between traffic stream density and traffic spacing, the speed-density relationship is derived as [10–13]

where k is traffic stream density, k = 1/s, and v is the traffic stream space-mean speed (m/s) assuming that all vehicles are travelling at the same average speed. Based on model (2), the loop detector data can be used to calibrate the model, and the optimization function can be formulated as

where, k i and v i are the field observed density and space-mean speed respectively. Other parameters are defined as above.
It is clear that model (1) is a microscopic model while model (2) is a macroscopic one. Both model (1) and model (2) suppose that speed is independent variable while spacing headway or density is the dependent variable. The speed is also supposed to be measured exactly. Just as mentioned above, the presence of these problems causes biased and inconsistent parameter estimates and leads to erroneous conclusions. In order to improve the accuracy of the model in predicting the behavior of an individual driver, it is necessary to modify the model and develop new estimation method.
2.2. Modified Van-Aerde Car-Following Model
Based on above analysis, Van-Aerde car-following model is modified as
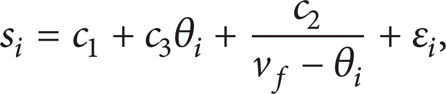

where s i is the observed value of spacing and distance headway between vehicle i and vehicle i – 1 in the same lane (m), θ i is the true value of v i , ε i is measurement error of s i , and δ i is measurement error of v i . In this paper, it is hypothesized that ε i and δ i are normally distributed. v i and v f are the same as defined in model (1).
It is easily found that the neglected measurement error-in-variables are remedied in model (4) and (5) by introducing the error term ε i and δ i . Also, in the model, the distance headway and speed are not distinguished between dependent and independent variables.
3. Calibration Methodology
3.1. Maximum Likelihood
Given that ε i and δ i are normally distributed with E(ε i ) = E(δ i ) = 0, var (ε i ) = σ s 2, var (δ i ) = σ v 2, and Cov (ε i , δ i ) = 0, the maximum likelihood function is derived:
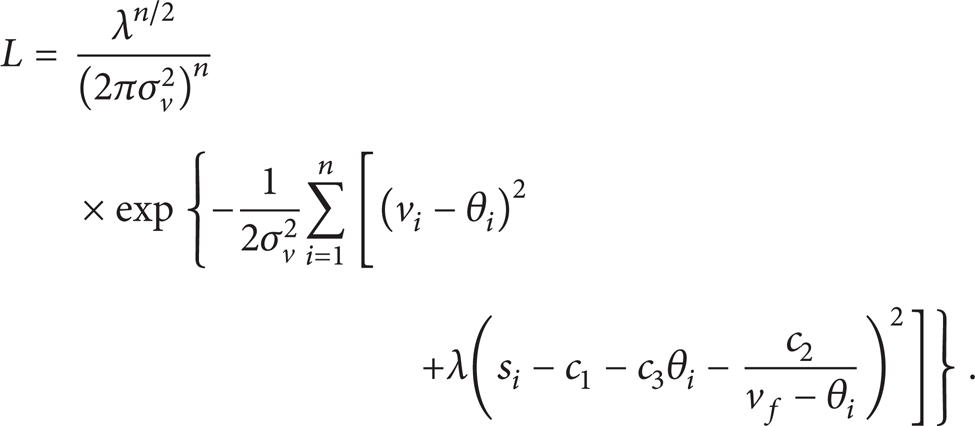
Therefore, the parameters in models (4) and (5) can be estimated using an iterative process by maximizing the likelihood function. In model (6), λ is denoted as

where
3.2. Parameter Estimate
Generally, the parameters in (6) can be estimated using the Gauss-Newton algorithm. In this paper, another approach is developed based on the maximum likelihood principle and is completed in two steps.
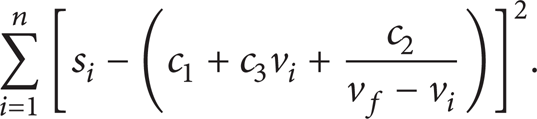
The first step is to estimate c2. For model (1), the least square approach is used to estimate the initial values of parameters. The optimization function is
In (8), the terms v
f
and v
i
are known. Therefore, the nonlinear term
The second step is to estimate c1 and c3. In model (4), the term

It is validated that the maximum likelihood estimator of θ i is
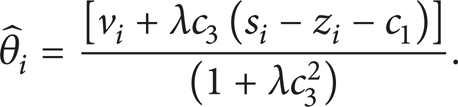
Inserting (10) into (6), it is obtained that the maximum likelihood estimator of c1 and c3 should minimize the following function:

Namely, the maximum likelihood estimates c1 and c3 are the solutions of
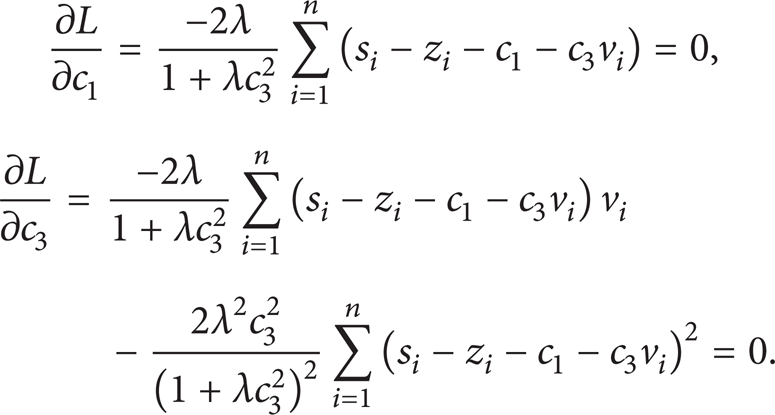
From (12), the maximum likelihood estimates

where
Consequently,

It should be noted that λ is supposed to be known in model (6) or (15). Hence, the value of λ should be determined before calibrating the model. According to the definition of

where
4. Result Analysis and Model Evaluation
4.1. Data Description and Parameter Estimates
The data was collected along the 3rd ring in Beijing City, China, by using car equipped with GPS (Global Position System). The facility free-flow speed is 80 km/h (22.22 m/s). Data collection was conducted on the peak hour, and the traffic stream was congested. Two passenger cars were equipped with high-precision GPS which were used to record the vehicles' position, velocity, and so forth. In the data collection process, one car was required to follow the other car in the same lane. The data collection time period is one second.
Applying the proposed procedure, the parameters are estimated based on the surveyed data. For the first step, the initial estimate values are computed:
It is noted that the initial estimates
4.2. Model Evaluation
To evaluate the modified model and proposed calibration method, the following measure is used:

where Me is the mean estimate error, x
i
is the observed value of distance headway,
The results show that for the modified Van Aerde car-following model, the mean estimate error for distance headway is 7.7% which is better than the generic model (the mean estimate error is 26.4%). It indicates that the modified model is improved for distance headway estimate. Figure 1 also illustrates the difference of the estimate results.

Comparison of estimate results.
Ultimately, the behavior of a single vehicle affects the traffic flow, and the calibrated car-following model should reflect the overall behavior of the traffic stream. Figures 2 and 3 illustrate the macroscopic characteristic that evolves from the calibrated car-following model (only the congested regime is obtained due to lack of uncongested data). From Figure 2, it is derived that the speed at capacity is about 36–42 km/h and the capacity is about 2000–2200 pcu/h/lane, which is consistent with the estimated result using loop detector data [18]. The jam density k j is 137 vehicles per km which also accords with the observed value. Figure 3 clearly demonstrates the speed-density relationship obtained from the modified model which is also consistent with traffic flow theory.

Fitness of the suggested model to the field data.
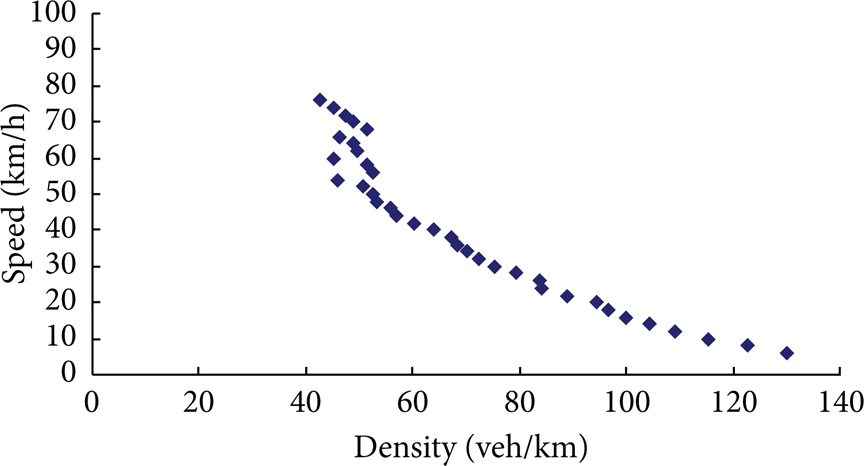
Speed-density relationship obtained from the modified Van Aerde model.
5. Conclusions
The calibration of car-following models is examined in this paper. It has been found that the model reliability and precision are improved by introducing measurement errors-in-variables. For Van Aerde model, the EIV model is proposed and a two-step calibration procedure is recommended. In addition, the modified Van Aerde car-following model is validated from a theoretical point of view by using integrated car-following data. It shows that the modified model provides a desired overall behavior of the traffic stream. Specifically, the flow-density relationship is consistent with traffic theory. This study demonstrates that the proposed modification by considering the measurement errors-in-variables can improve the precision of the car-following model.
Conflict of Interests
The authors declare that there is no conflict of interests regarding the publication of this paper.
Footnotes
Acknowledgments
This work is supported by the National Key Basic Research Program of China under Grant no. 2012CB723303. The authors would like to thank the anonymous reviewers whose comments helped to significantly improve the overall quality of this paper.