
Abstract
The structural components of high speed trains are usually made of aluminum alloys, for example, 6082. The dynamic mechanical behavior of the material is one of key factors considered in structural design and safety assessment. In this paper, dynamic mechanical experiments were conducted with strain rate ranging from 0.001 s−1 to 100 s−1 using Instron tensile testing machine. The true stress-strain curves were fitted based on experimental data. Johnson-Cook model of 6082-T6 aluminum alloy was built to investigate the effect of strain and strain rate on flow stress. It has shown that the flow stress was sensitive to the strain rate. Yield strength and tensile strength increased with a high strain rate, which showed strain rate effect to some extent. Fracture analysis was carried out by using Backscattered Electron imaging (BSE). As strain rate increased, more precipitates were generated in fracture.
1. Introduction
The type 6 aluminum alloys belong to the moderate intensity alloy. Due to their excellent extrusion resistance, weld ability, and corrosion resistance, they were widely used in the railway train, automobile, aviation, and other transport means [1]. As the technology of high-speed rail continues to develop, 6082-T6 aluminum alloy was widely used as high-speed rail body material due to its light weight and excellent mechanical properties. The survey has found that the strain rate of 6082-T6 aluminum alloy is about 70 s−1 during the service; therefore, studying the mechanical properties under different strain rate and building a high-precision material constitutive model are of great importance to the safety of the trains. Currently, studies of 6082-T6 aluminum alloy mainly focused on its weld ability, failure, and heat treatment [2–5], but few studies have been focused on its constitutive model, especially for secondary strain rate constitutive model.
In this paper, five repeated tensile tests were carried out using Instron tensile testing machine under each strain rate, and complete stress-strain curves were obtained from quasistatic to moderate strain rates (0.001 s−1–100 s−1). Johnson-Cook model of 6082-T6 aluminum alloy was built to investigate the effect of strain and strain rate on flow stress. Fracture analysis was carried out by using Backs-cattered Electron imaging (BSE).
2. Experimental Design
Experimental materials were 6082 aluminum plate specimens with T6 aging treatment (insulated for 8 hours at 175°C after solution treatment at 500~540°C). Its chemical composition was shown in Table 1 and its mechanical properties were shown in Table 2 [6].
6082-T6 aluminum alloy chemical composition.

6082-T6 aluminum alloy mechanical properties.

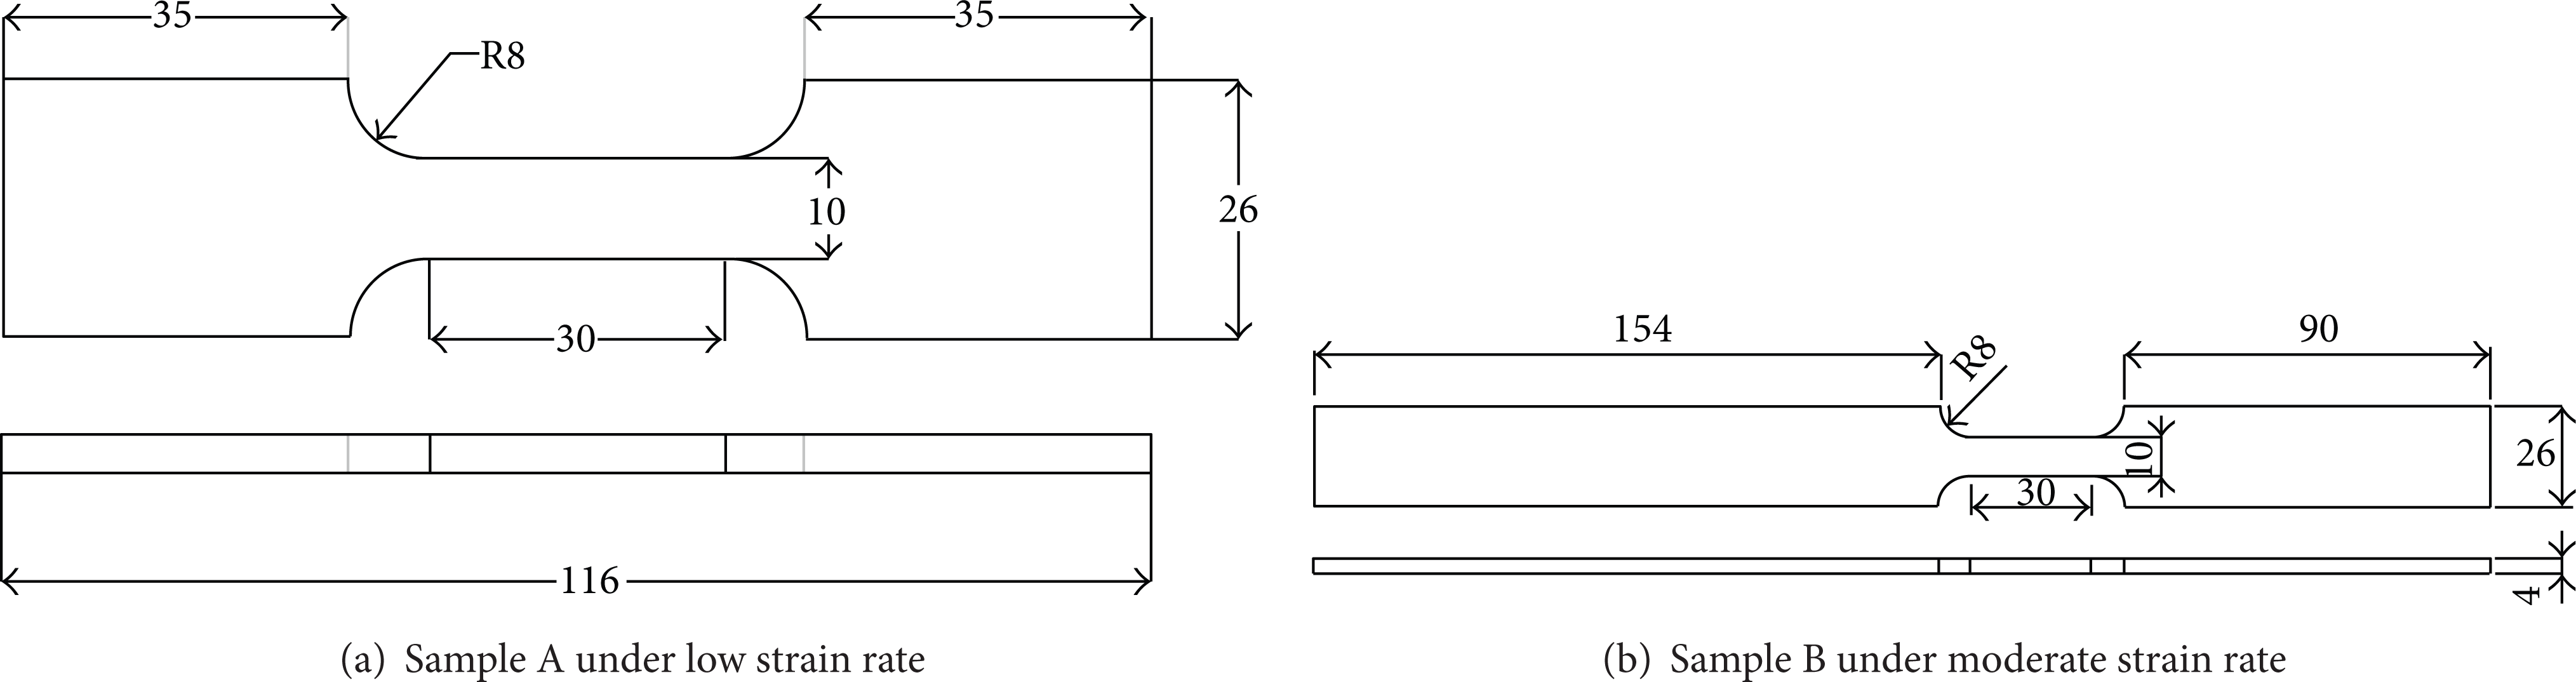
The experiment used two types of samples showed in Figure 1. The typical rectangular cross-section sample was used under low strain rate (0.001 s−1~1 s−1), with the gauge length of 30 mm, thickness of 4 mm, and width of 10 mm; the clamping segment length on both ends is 35 mm. Under moderate strain rate (10 s−1~100 s−1), samples with extended gripping end were used. Other parameters stay the same as the specimen under low strain rate. The samples used under different strain rate were showed in Table 3.
Tensile test condition setting.

6082-T6 aluminum alloy specimens.
For the low strain rate (0.001 s−1~1 s−1) experiments, Instron 8874 tensile testing machine was used. And VHS 160-100-20 type tensile testing machine was used for medium strain rate (10 s−1~100 s−1) experiments. The maximum tensile speed of this tensile testing machine is 20 m/s, and the maximum load is 160 t. The noncontact digital speckle method [7] was used to measure the stress and strain. To eliminate the impact of the initial acceleration process of the testing machine on strain rate, an air-way area of the samples was designed. At this stage, the testing machine accelerated when the speed reached a predetermined rate and then the load was added.
3. Results and Analysis
3.1. Stress-Strain Curve
Figure 2 showed the true stress-strain curves of 6082-T6 aluminum alloy, and the overall shapes of the curves were on the elastic stage; the flow stress increased rapidly as the strain increased. When the stress reached a certain point, the material began to yield. After entering the plastic stage, under the effects of work-hardening and dynamic recovery, flow stress increased much slower than the beginning part. When the stress reached a certain value, the material began necking and local stress increased sharply [8, 9].

The true stress-strain curve.
Since the material showed no significant yield point, therefore the strain of 0.2% was used as the yield point; the yield strength and tensile strength were shown in Table 4. As the strain rate increased from 0.001 s−1 to 100 s−1, the yield stress increased from 306.1 MPa to 322.63 MPa, increased by 5.4%, and the tensile strength increased from 364 MPa to 384 MPa, increased by 5.49%. Yield strength and tensile strength increased with a high strain rate, which showed strain rate hardening effect to some extent.
Yield and tensile strength of 6082-T6 alloy under different strain rate.

Generally, in the plastic stage, flow stress increased due to dislocation motion and the result of the interaction of dislocations. At the beginning of the plastic stage, a large number of dislocations formed and began to expand at the action of stress. When the dislocations crossed the grain boundary and other dislocations or precipitates, they stopped and induced stress. Meanwhile, the second phase particles on the grain boundary had pinning effect, which hindered the grain boundary sliding and grain growth to improve the strength of the material [10]. Therefore, the alloy could withstand a larger force.
3.2. Constitutive Model
The most commonly used thermal-viscoelastic constitutive models were Johnson-Cook model, Zerilli-Armstrong model, Follansbee-Kocks model, and Bodner-Paton model [11]. As Johnson-Cook model clearly expressed hardening, strain rate hardening, and temperature softening effects, this paper would adopt Johnson-Cook model building the constitutive model of 6082-T6 aluminum alloy. The expression of Johnson-Cook model was

And (A + Bε
p
n
),

By fitting the experimental data, the Johnson-Cook model of 6082-T6 aluminum alloy was achieved as follows:

Figure 3 showed the experimental data and Johnson-Cook model under different strain rate. As can be seen, the Johnson-Cook model and experiment data met good agreement. The dynamic properties of 6082-T6 aluminum alloy fit very well using Johnson-Cook model with the strain rate ranging from 0.001 s−1 to 100 s−1.

Constitutive model and experimental curves.
3.3. Strain and Strain Rate on the Flow Stress
The constitutive equations of 6082-T6 aluminum alloy could be described as:

The effect of strain and strain rate on flow stress could be described as follows:

Figure 4 showed the effect of strain on the flow stress. As can be seen, at a determined strain rate, the flow stress increased rapidly as the strain increased in the initial stage, then, the growth rate decreased; and remained at a low level above zero, which meant that without other factors, the stress would get bigger and bigger as the strain increased, and this was because that, under the influence of stress, new dislocations developed, and even secondary slipping system started moving; thus, the material could bear a higher force.

Strain on flow stress.
Generally, strain rate sensitivity was related to microstructure of the material. Refering to the research of Humphrey and Jankowski [13], the effect of strain rate for the yield strength could be divided into three stages. The first stage is called nonthermal activation zone, and in this stage, the stress was not sensitive to strain rate. The second stage was more sensitive to strain rate due to dislocation motion controlled thermal activation mechanism. As the strain rate increased, phonon drag phenomenon occurred at this time, and the flow stress was more sensitive to strain rate [12–16].
In this study, the nonthermal activation mechanism was the main mechanism for controlling the flow stress. Figure 5 showed that in the nonthermal activation zone, as the strain rate increases, changing rate of stress over strain decreases, the stress increment caused by nonthermal activation mechanism is limited.

Strain rate on flow stress.
3.4. Fracture Analysis
Basically, ductile damage was described by void nucleation, growth, coalescence, and final fracture. Figure 6 showed the SEM photographs of fracture under strain rates of 0.001 s−1, 0.1 s−1, 20 s−1, and 100 s−1. Dimples observed in SEM micrographs represented microvoids created during the tensile test. The parabolic shaped impressions shown in micrograph at failure may be representing shear failure as expected in ductile materials. As can be seen in Figure 8, the dimples in lower strain rate were smaller and well centered in shape. However a combination of small and large dimples was observed in high strain rate. As the strain rate increased, the percentage of dimples decreased, which meant that the material showed more brittleness. Besides, the dimples under lower strain rate were deeper than those under higher strain rate [17, 18].
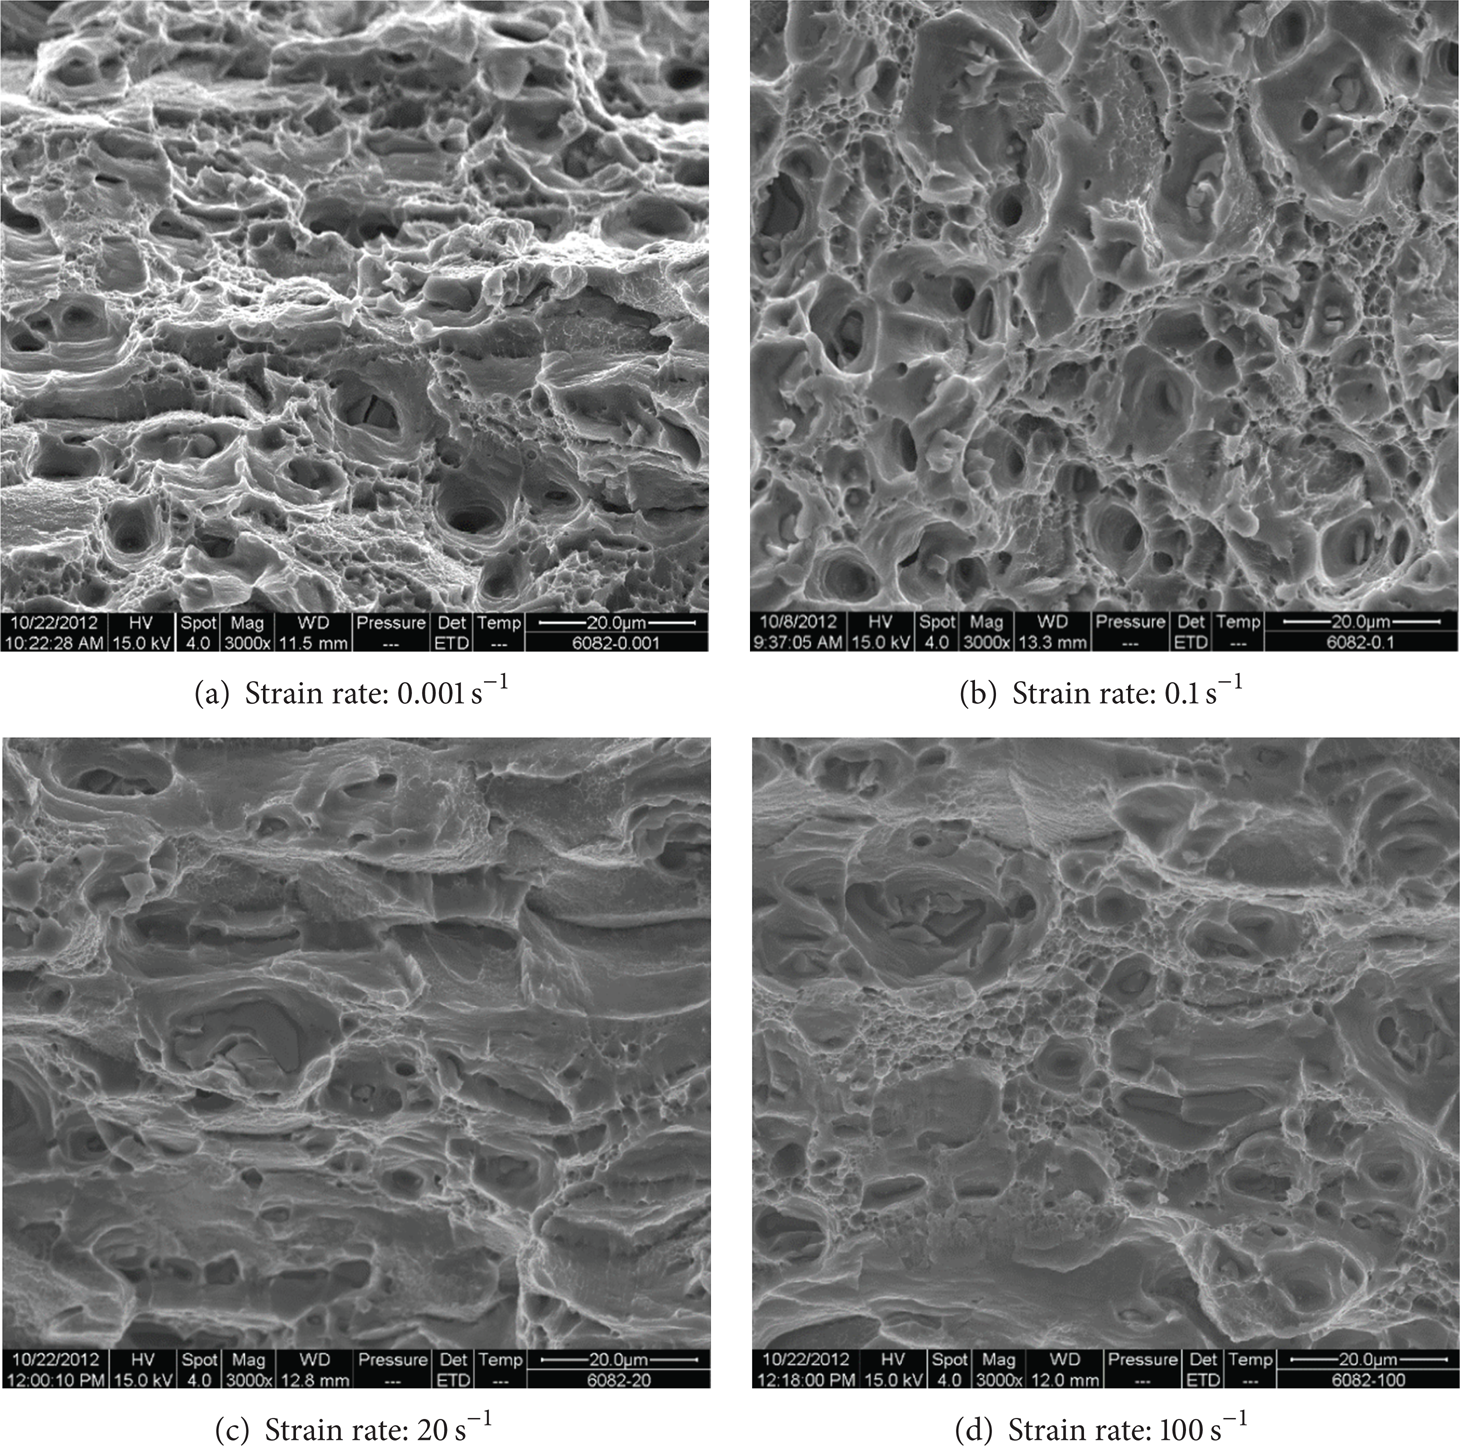
SEM photographs of fracture under strain rates of 0.001 s−1 and 100 s−1.
Figure 7 showed the plastic strain under different strain rate. As can be seen, with the strain rate increasing, the plastic strain decreased and showed more brittleness. Usually, dimples were on behalf of toughness, and cleavage fracture represented brittleness. Dimples were the result of empty aggregation. At first, spaces formed inside the material and gradually grew together with other spaces under the action of the slip and then the dimples were formed. Cleavage fracture surface occurred along a certain crystal plane, when two cleavage crack intersected, cleavage steps formed. Because there existed the situation that when positive cleavage come accross negative cleavage, they will offset one another, the cleavage tends to expand to plane. As more cleavage appeared at a higher strain rate, the plastic strain got smaller than that at a lower strain rate.

Plastic strain under different strain rate.

Backscattered photo of 6082-T6 aluminum alloy fracture.
Figure 8 showed the backscatter photos of 6082-T6 aluminum alloy. The light particles were in second phase, and it showed that the second phase particles were rich in Mn, Mg, Si, Fe, and other elements (Figure 9). There were mainly two kinds of precipitates: precipitates with Mg element and precipitates without Mg element. Among all the 32 randomly selected precipitates (4 under each strain rate), only 31.2% percent had element of Mg. Usually, aluminum and magnesium formed compound of Al8Mg5, but it is hard to nucleate and the size was small, playing a limited role in strengthening the material [19]. The average mass fraction of Si element, Fe element, Mn element, and Al element in the other precipitates was about 6.96%, 15.89%, 9.67%, and 67.4% and showed strain rate that is independent. This meant that the precipitates were nearly all of the same kind. And the precipitation strengthening was mainly determined by the number of precipitates.
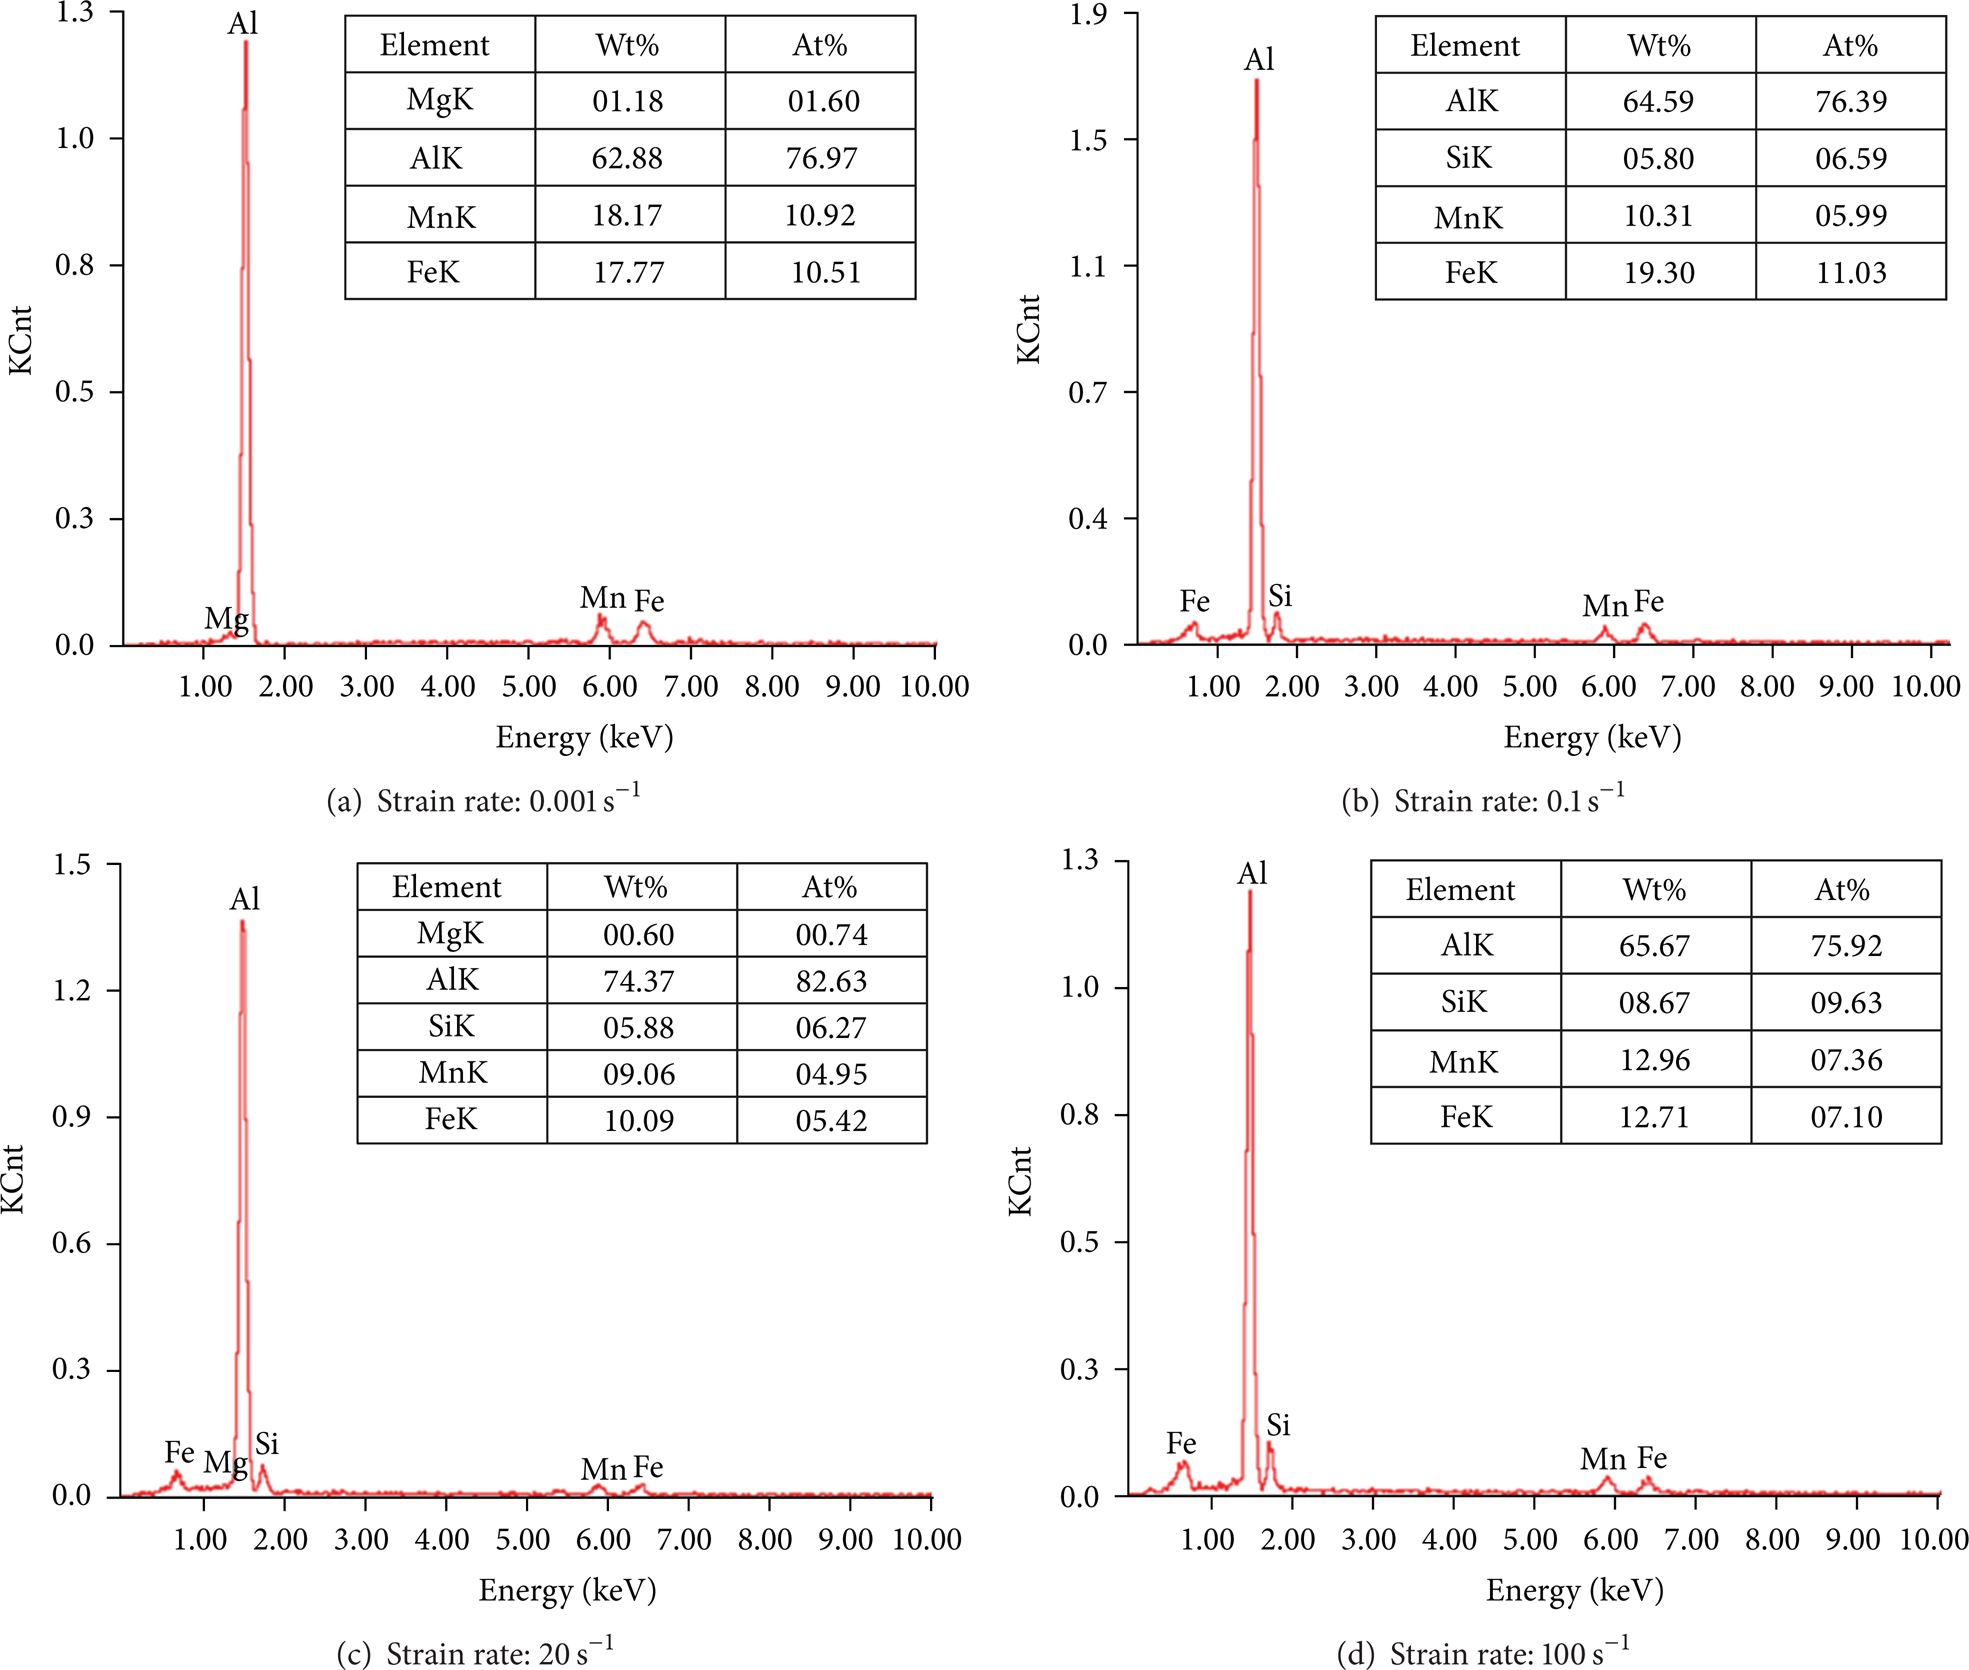
Precipitates composition analysis.
Figure 8 showed the precipitates under the strain rate of 0.001 s−1, 0.1 s−1, 20 s−1, and 100 s−1; as strain rate increased, more precipitates were generated in fracture. The size of the precipitates is usually small in a low strain rate; as the strain rate increased, a combination of small and big precipitates appeared. This meant that as the stretching rate increased, precipitates grew with greater speed. The bigger precipitates precipitated before the smaller ones.
Generally, the second phase particles on the grain boundary had pinning effect, which hindered the grain boundary sliding and grain growth to improve the strength of the material. With more precipitates generated in fracture, the dislocation would encounter more obstacles when moving, thus reducing the amount of plastic deformation. Meanwhile, particles crossed by the dislocation loop will have a repulsive force, which will create resistance against the dislocation loop propagation, the existence of more dislocation loops will face more resistance by the particles generating higher resistance forces. In order to maintain deformation compatibility, more dislocations would start to move, so the material could bear higher stress.
4. Conclusions
In this paper, complete stress-strain curves of 6082-T6 aluminum alloy were obtained with strain rate varying from quasistatic (10−3 s−1) to moderate strain rate (100 s−1). The Johnson-Cook constitutive model was built based on experimental data. The effect of strain rate and strain on the flow stress was discussed. Finally, the fracture was analyzed on morphology and precipitates.
6082-T6 aluminum alloy has low strain rate sensitivity. The established Johnson-Cook constitutive equation of 6082-T6 aluminum alloy has good agreement with experiment data with a strain rate from 10−3 s−1 to 100 s−1 at room temperature. As the strain rate increases, changing rate of stress over strain decreases. It can be seen that more precipitates appear with an increasing strain rate through BSE graphic analysis, which may enhance the pinning effect on grain boundaries.
Footnotes
Acknowledgments
The research has been financially supported by the National Basic Research Program of China (2011CB013404) and the National Science and Technology Major Project of the Ministry of Science and Technology of China under Project (2012ZX04012011).