
Abstract
Automatic recognition of personal comfort is critical in realizing autonomous control of building utilities. We can infer human comfort level based on indoor environmental conditions, such as temperature and humidity, collected through sensor networks. However, the majority of methods for optimally deploying sensor networks in indoor climate monitoring mainly focused on achieving accurate measurements such as temperature distribution map with the minimum cost. Indeed, for automatic recognition of comfort using machine learning, we need to collect datasets preserving as much of the discriminatory information for inferring personal comfort with the minimum cost. In this paper, we present a novel method of placing and minimizing sensor nodes for sensor networks in smart energy systems. We have developed ZigBee-based sensor nodes and collected temperature, humidity, and illumination dataset from 13 nodes for a week. Using the dataset, we group the sensor nodes into coherent clusters, and then select a representative node which has the maximum value of RSSI for each cluster and remove the other redundant sensors, reducing the number of sensor nodes deployed. To show the feasibility of the proposed method, we perform a classification analysis of building environment. The recognition accuracy decreased by 13 percent with 6 selected sensor nodes, compared to the result with all 13 sensor nodes.
1. Introduction
In the USA, the largest consumer of energy is buildings, with residential applications accounting for 22.5% and commercial applications accounting for 18.6% [1]. In particular, buildings represent a major fraction (72.9%) of electricity consumption in the USA, including lighting, heating, ventilation, and air-conditioning (HVAC) system, and home and office appliances [2]. Accordingly, energy conservation concerns require us to balance energy use against occupant comfort. Smart energy systems are driven by the clear needs of concerning energy conservation and balancing building energy usage against occupant comfort requirements. Smart energy systems would be able to advance building energy efficiency by monitoring, manipulating, and leveraging contextual information across the building environments [3].
Since smart energy systems have become a prime target for energy savings and occupant comfort, indoor climate monitoring based on wireless sensor networks (WSNs) have been widely employed in attempts to collect various parameters from buildings, including temperature, humidity, CO2, light, and occupancy. These signals could be used to analyze the building environment condition and infer the occupant's comfort level and finally control electric outlets, HVAC system, and lighting in order to improve building energy efficiency while preserving the occupant's comfort level. Therefore, a WSN consisting of various sensor nodes is seen as one of the pivotal enablers of smart energy systems.
Research on optimal sensor placement in WSNs for indoor environment monitoring is decades old and many lessons have been learned in our community. The research mainly focuses on investigating an appropriate placement solution of sensor nodes in WSNs and, thus, improving wireless communication quality, minimizing the total energy consumption of networks, and maximizing informativeness of sensed data at the same time. One example is to place the minimum number of sensor nodes (i.e., minimizing communication cost) and then predict values at locations where no sensor nodes are placed, being able to achieve highly accurate temperature distribution (i.e., maximizing information). However, for smart energy system, in particular, automatic recognition of human comfort based on sensed data (e.g., temperature, humidity, and CO2), we need to develop a new approach for deploying sensor nodes in WSNs, which can collect data sets preserving as much of the discriminatory information for inferring human comfort level as possible. Accordingly, we first consider a practical set of possible locations for sensors (i.e., locations probably highly related to human comfort, for example, on each desk in an office), group them into clusters having similar output signals, and finally choose the optimal set of sensor locations to minimize the network cost.
Our work addresses these problems by creating and testing ZigBee-based wireless sensor nodes equipped with temperature, humidity, and light sensors in a laboratory environment based on machine learning technologies. We have collected data sets spanning continuous one-week collection periods (April 13, 2012 to April 19, 2012). With the collected data set, we first tried to calculate similarity distance between wireless sensor nodes using distance measures. With the distance matrix among all sensor nodes, we next grouped the sensors into coherent clusters using a simple hierarchical clustering approach. From the coherent sensor cluster, we could finally select a sensor node with the maximum average radio signal strength indicator (RSSI) value as a prime sensor for the sensor cluster, and the others are redundant sensors that could be removed. In this way, we will be able to reduce the overall energy consumption of WSN by eliminating the redundant sensor nodes in each coherent sensor cluster. Finally, we show the feasibility of our proposed method by performing a classification analysis in which a given 1 hour data set of temperature and humidity is classified into the day it was collected, that is, which day of a week (Monday through Sunday). We believe the proposed approach will provide a systematic sensor deployment method in which the data sets collected could include as much of the building environment discriminatory information as possible with the minimum number of sensor nodes.
The organization of the paper is as follows. Section 2 introduces smart energy systems as well as several studies on optimal sensor placement methods for WSNs. Section 3 presents a WSN-based test environment for indoor climate monitoring and illustrates the data sets we collect for a week. Section 4 describes the proposed sensor selection method using hierarchical clustering on similarity measures and show the feasibility of the sensor selection method using a classification analysis of indoor climate environment based on temperature and humidity data sets. Finally, Section 5 offers concluding remarks.
2. Related Work
Sensor and actuator technologies based on ubiquitous computing and WSNs have been employed in attempts to implement responsive environments. The office at Xerox PARC is one of the examples of such responsive environments, where electric outlets, HVAC systems, and lightings were automatically controlled in response to the occupants’ preferences [4]. Pan et al. developed an intelligent light control system based on WSN in indoor environments [5]. More recently, data sets collected from WSN for a long period have been used in an attempt to perform automatic classification and clustering of indoor climates using machine learning technologies. For example, Gouy-Pailler et al. collected a temperature data set for 10 days from 25 sensor nodes installed in a house and calculated distance and similarity measures for sensor selection in highly instrumented buildings [6]. User's personal comfort level could be automatically recognized by integrating data sets collected from WSN such as temperature and humidity into machine learning algorithms such as support vector machine and Fisher Discriminant [7, 8].
To effectively deploy WSNs for environment monitoring, researchers have been working on efficient deployment of sensor nodes in WSNs [9, 10]. Beutel et al. proposed deployment-support networks (DSNs) for the development, test, deployment, and validation of WSNs [11]. By implementing a DSN composed of 71 BTnodes rev3 devices, they showed that they could enhance scalability and flexibility in deployment of a large number of nodes of WSNs. Dyer et al. also presented a similar approach for developing and testing WSNs in a realistic environment [12]. Woehrle et al. proposed a fundamental method for a systematic design of WSNs for supporting the development of WSN software conforming to all design requirements including robustness and reliability [13]. Wang et al. proposed systematic solutions for resolving sensor placement and sensor dispatch problems in order to reduce the cost of sensor deployment and enhance detection capability of WSNs [14].
In particular, optimal sensor placement methods have been widely studied for enhancing coverage, surveillance, communication cost, and informativeness of sensed data in WSNs. Chakrabarty et al. present a grid-based sensor placement method for effectively locating targets in distributed sensor networks, at the same time, minimizing the cost of sensors for complete coverage of the sensor field [15]. Similarly, Dhillon and Chakrabarty present polynomial-time algorithms for optimizing the number of sensors and determining their placement to support minimalistic sensor networks in which a minimum number of sensors are deployed and sensors transmit/report a minimum amount of sensed data [16]. Lin and Chiu develop a grid-based optimal sensor placement algorithm for locating targets with minimum distance error for large sensor fields under the minimum cost limitation [17]. Recently, optimal sensor placement has been also considered for detecting overheating components and enhancing energy efficiency in data centers. Wang et al. present an optimal sensor placement method for hot server detection in data centers based on computational fluid dynamics (CFD) analysis of thermal dynamics in data centers, maximizing hot server detection probabilities, performing efficient cooling, and, thus, improving the energy efficiency of data centers [18, 19]. Similarly, Chen et al. propose a temperature forecasting technique in data centers by integrating CFD modeling and real-time data-driven prediction via wireless sensing to achieve high fidelity temperature forecasting [20]. Work to maximize information of sensed data with the minimum energy in WSNs has been also studied. Krause et al. proposed a data-driven approach using Gaussian process to model the monitored phenomena and predict communications cost and finally present a polynomial time algorithm for maximizing information of sensor data while minimizing communication cost [21, 22]. Although this work is most closely related to our work, the authors use a sensor placement strategy in which the level of informativeness of a sensor placement is calculated based on entropy and mutual information criterion between a set of possible sensor positions and an additional set of locations, where no sensor placements are possible. However, our indoor environments such as homes and offices are not ideal for placing sensor nodes. For example, sensor nodes could not be placed at a particular position in a room due to aesthetics, appearance, proximity, or human intervention even though it is the most informative sensor location. Therefore, we need to first consider a practical set of possible locations for sensors, group them into clusters having similar output signals, and finally choose the optimal set of sensor locations, composed of the representative sensor of each cluster. In addition, this method might be appropriate for automatic recognition of human comfort in indoor environments based on classification learning such as support vector machine algorithm, which could preserve as much of the class discriminatory information as possible [7].
Bandyopadhyay and Coyle proposed an energy efficient hierarchical clustering algorithm to organize the sensors in a WSN into clusters [23]. Sensors in clusters communicate only to clusterheads and then the clusterheads communicate the collected information to the center processing center, minimizing the total energy spent in the network. The authors employed a hierarchical clustering method for grouping sensors in such a way as to minimize the communication cost spent in the network rather than identify the similarity of data collected in the network and minimize the number of sensors. This style of sensor clustering method echoes our motivation in this paper.
Younis and Akkaya presented an extensive survey of optimized sensor node placement in WSNs [24]. They summarized published sensor placement strategies according to various aspects: application, space, deployment, node type, objectives, and constraint. As they presented, most of the published work considered 2D spaces [21, 22] and the node placement problem in 3D space will need an increased attention from the research community to tackle practical deployment scenarios such as smart energy systems. This provides the motivation for our research into sensor deployment for indoor climate monitoring in buildings-3D spaces.
3. Suggested WSN Environment
In this section, we explain a WSN-based test environment for indoor climate monitoring where we develop and illustrate the data sets that we collect for a week.
3.1. Experimental Setup
To acquire sensing signals from indoor building environments for a long period of time, we have developed a ZigBee-based wireless sensor node as shown in Figure 1(a). The sensor node consists of an MSP 430 16-bit ultralow power MCU, a CC2520 IEEE 802.15.4 RF transceiver from Texas Instruments, a SHT11 digital humidity and temperature sensor from Sensirion, and a S1087 light sensor from Hamamatsu. CO2 sensors were also tested at first, but we have decided to exclude them from our study due to the large amount of power consumption of the CO2 sensors. Each wireless sensor node is powered by two AA batteries, and this permits a long-term continuous operation without the need to change the batteries. The sensor nodes are configured to measure and transmit temperature, humidity, illumination, and its voltage level at one-minute intervals. Among them, the voltage level will be used to decide if the battery should be changed. We have developed Java and MySQL-based data logging system on a Mac mini as shown in Figure 1(b), which recorded the data transmitted from the sensor nodes as well as their RSSI value. The RSSI could be used to monitor the quality of wireless communication between the receiver and sensor nodes.
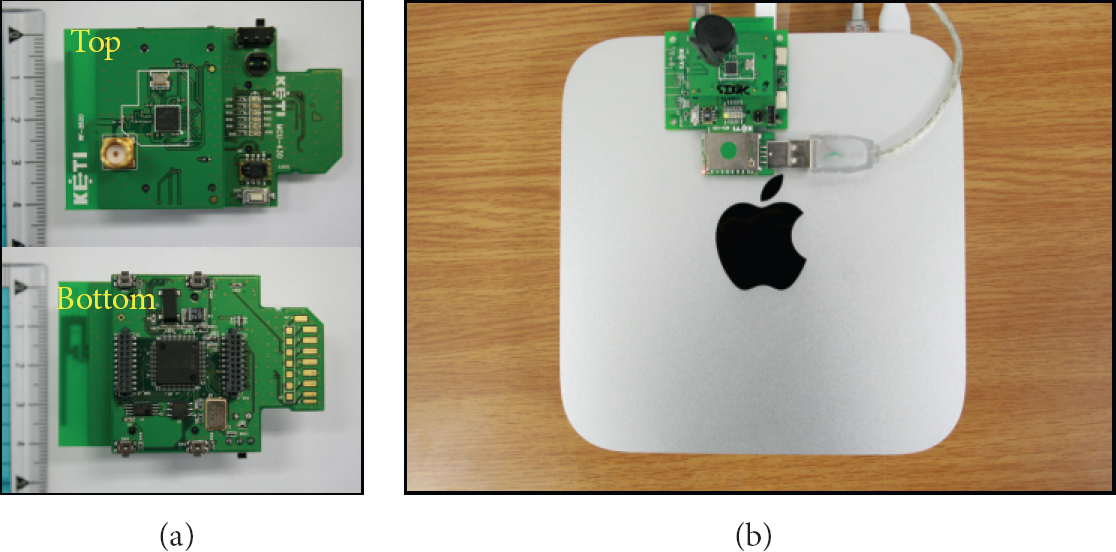
(a) A ZigBee-based sensor node equipped with temperature, humidity, and light sensors, (b) a ZigBee receiver connected to a Mac mini.
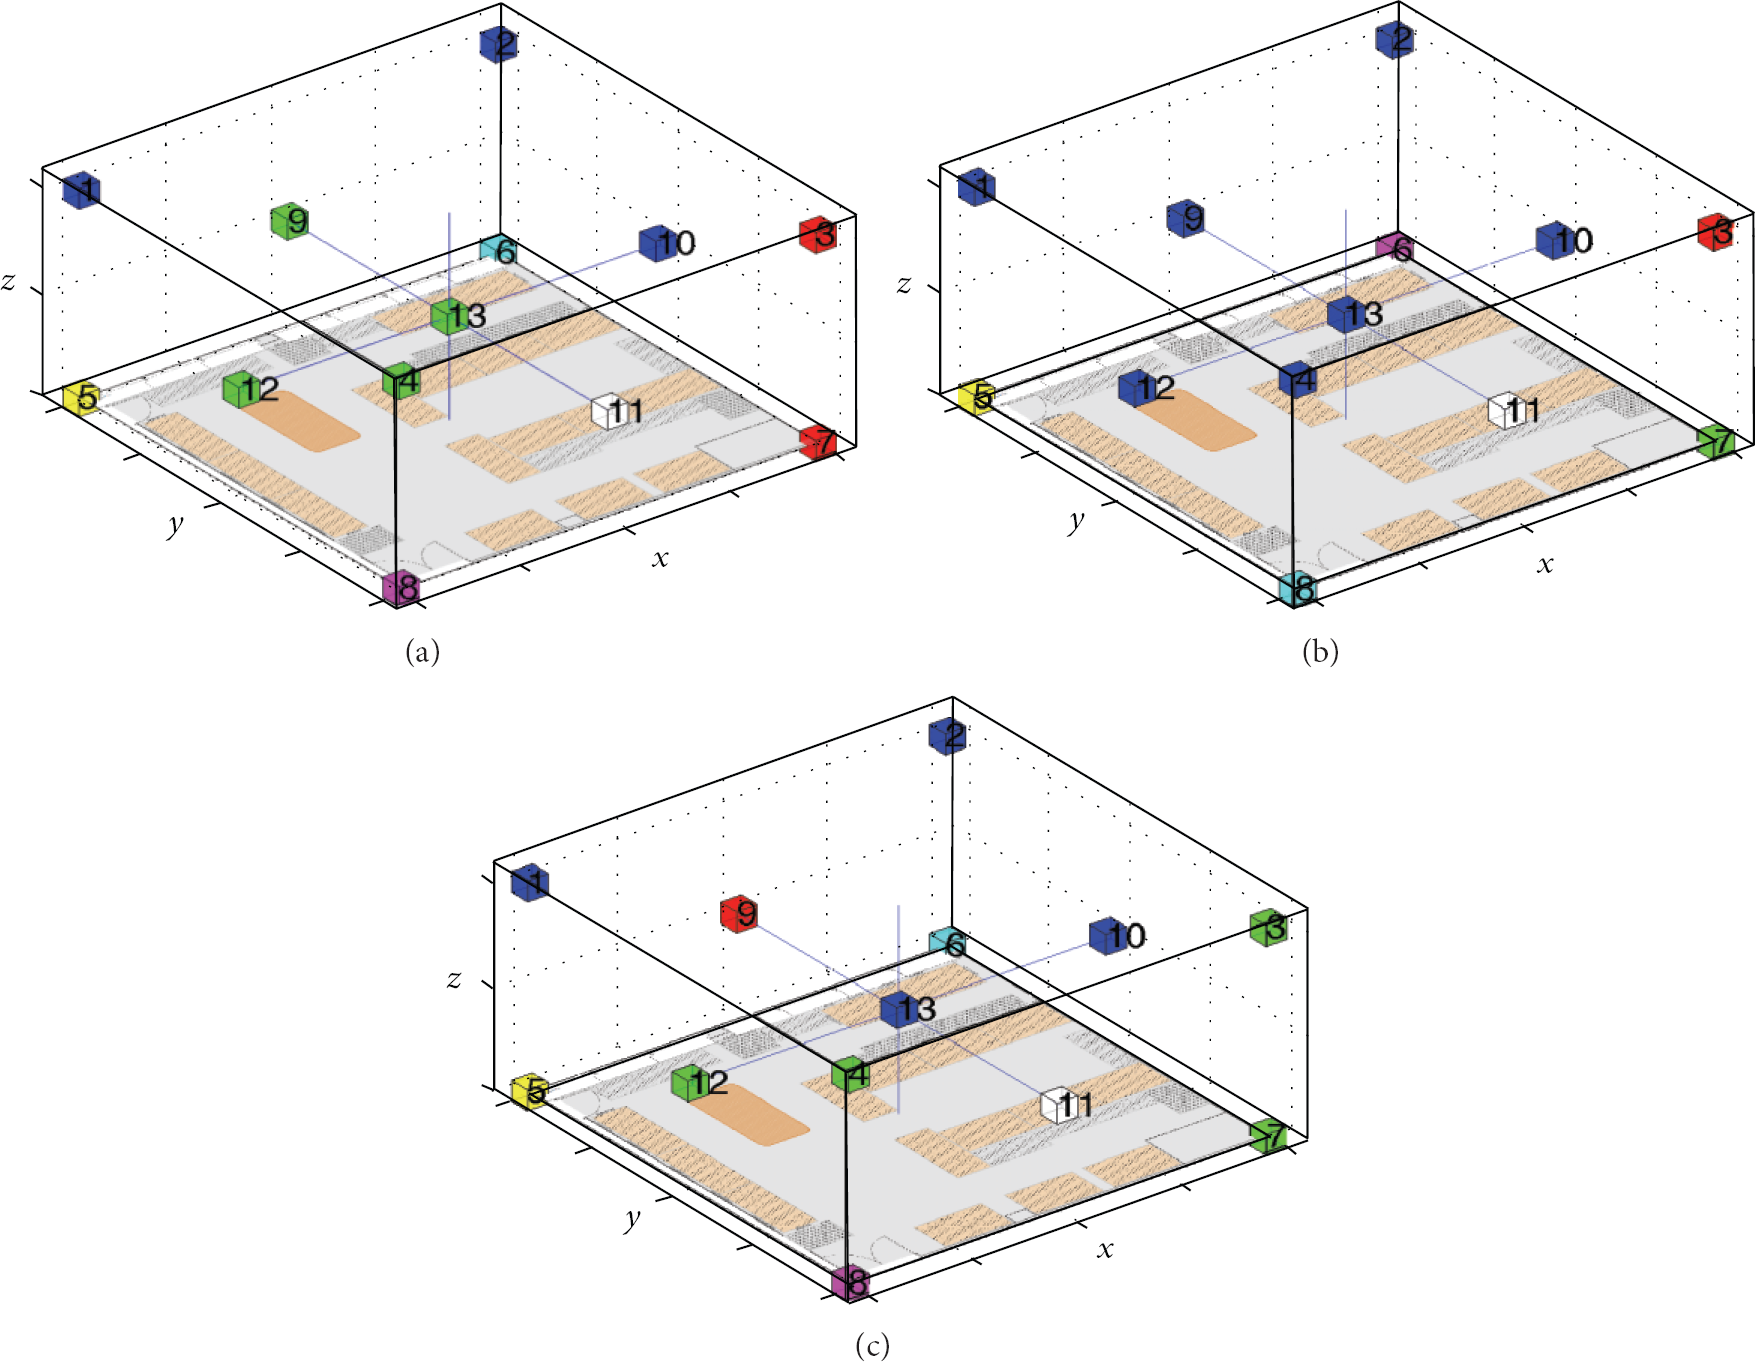
We have attached the sensor nodes developed on the 13 locations of our laboratory environment as shown in Figure 2. The sensor deployment in the space consists of three levels: ceiling (2.6 m), user (1.3 m), and floor level (0.1 m) from the floor. The user level, a height of 1.3 m from the floor, is chosen considering the human body as a complex and dynamic temperature sensor in everyday life. Eight sensor nodes are located in the corners of the room, that is, ceiling and floor levels, another four sensor nodes are located on the walls, and finally a sensor node is installed in the middle of the room (user level).

Our experimental setup of 13 wireless sensor nodes mounted on our laboratory's wall. (1) A wireless sensor node transmits captured data to the sink node connected to the Mac mini; (2) a Java-based logging program puts the received data into the MySQL database table; (3, 4) a JSP-based Web page provides a user interface for selecting the sensor, the day, the time duration of interest; and (5) it retrieves and shows the saved data as a table or graph.
By selecting the sensor, the day, the time duration of interest through a JSP-based Web page, we can see the variation of temperature, humidity, illumination, voltage, and RSSI during the selected time period as a table or graph.
3.2. Data Collection
Our experiment consisted of capturing sensor data sets from 13 wireless sensor nodes for one week (April 13, 2012 to April 19, 2012). During this time, temperature, humidity, illumination, RSSI, and battery level was continuously recorded from 13 sensor nodes. Figures 3 and 4 show the temperature and humidity data collected from 13 wireless sensor nodes we developed from April 13, 2012 (Friday) to April 19, 2012 (Thursday), respectively. In Figure 3, we can observe that the temperature time series varies greatly depending on the work schedule (9 am to 6 pm) of the occupants in the building, that is, the different schedule of the HVAC control system for weekdays (Monday through Friday) and weekend (Saturday and Sunday), that is, no HVAC operation during weekend. It should be noted that the temperature and humidity time series collected from the 11th sensor nodes (dark green, star) show a different signal pattern from others, as seen in Figures 3 and 4. This is due to an abnormal working of the sensor and should be fixed. In our later analysis, we will present a method to systematically examine such abnormal sensors. Figures 5 and 6 show the illumination and RSSI data collected from 13 wireless sensor nodes, respectively. Similar to the temperature and humidity time series in Figures 3 and 4, both illumination and RSSI show a clear difference between weekdays and weekend. In Figure 5, we can see that there was no operation of lighting devices during weekend, and the illumination of all sensor nodes varies according to their locations and the amount of daylight they received. In Figure 6, RSSI time series greatly varies during week days probably because the occupancy of people in the room would cause interference in sensor networks.

Temperature data collected from 13 wireless sensor nodes.

Humidity data collected from 13 wireless sensor nodes.

Illumination data collected from 13 wireless sensor nodes.

RSSI data collected from 13 wireless sensor nodes.
4. Sensor Clustering on Similarity Measures
We first describe three similarity measures for calculating similarity distance among sensors and then illustrate the sensor clustering method based on hierarchical clustering. Finally, in order to show the feasibility of our proposed sensor selection method, we perform a classification analysis of indoor building environment based on temperature and humidity data sets we collect for a week.
4.1. Similarity Measures
For calculating similarity distance among sensors, we have selected three similarity measures: Euclidean distance (ED), complexity invariance distance (CID), and dynamic time warping (DTW). Euclidean distance is the most widely-used distance measure for data classification and clustering due to the simple but powerful performance in many application fields. Complexity invariance distance uses information about complexity differences between two sensors time series as a correction factor for existing distance measures, that is, Euclidean distance. By considering differences in the complexities of the sensors time series being compared, we can force the time series with very different complexities to be further apart. Thus, we can overcome the weakness of Euclidean distance, for example, high sensitivity to error, outliers, and missing data. Dynamic time warping is a well-known algorithm to find an optimal alignment between two time series and has been successfully used in the applications with time deformations between two time series, for example, speech recognition. We choose DTW as one of the methods for similarity calculation for building environments because we thought there would be time distortion among temperature sensors due to the airflow of HVAC system and heat transfer delay in the room.
4.2. Sensor Clustering
In order to group 13 wireless sensor nodes into coherent sensors, we deployed a hierarchical clustering method with a fixed number of clusters. Although a variety of other clustering methods such as k-means algorithm or Gaussian mixture modeling can be used for more detailed analysis, exploring the difference between those algorithms is not the goal of this paper. In addition, hierarchal clustering allows us to decide the level of clustering, that is, the number of clusters, which is most appropriate for our application. All the experiments based on hierarchical clustering in this study are carried out using the MATLAB developed by the MATHWORKS Inc.
Figure 7 shows the temperature-based dendrogram (cluster tree) results with Euclidean distance, complexity invariance distance, and dynamic time warping distance, respectively. It should be noted that the distance between the 11th sensor and all others is very high compared to other distances, this is because the abnormal working of the sensor as mentioned in the previous section. Accordingly, we conclude that if a group of sensor nodes has a very long distance from all others, the sensor nodes in the group might be identified as one further investigation is necessary. Figure 8 shows temperature-based sensor clustering results (seven clusters) with Euclidean distance, complexity invariance distance, and dynamic time warping distance, respectively. It should be noted that the sensors installed on the floor are grouped into different clusters in three clustering results whereas some sensors on the wall and ceiling are grouped into the same clusters. It is also important to note that the sensors of the same color would generate similar time series so that we could reduce the number of sensors of the same color in all figures (13 sensor nodes to 7 sensor nodes). In this procedure, we can select a sensor node with the maximum average value of RSSI during the data collection period as a representative sensor of each cluster. Figures 9 and 10 show the illumination-based dendrogram and clustering results with Euclidean distance, complexity invariance distance, and dynamic time warping distance, respectively. It should be noted that the cluster analysis based on illumination shows almost the same result between three similarity measures. We can conclude that a simple ED will be working well in practice considering the clustering result and the heavy computation load for DTW.

Temperature sensor dendrogram based on (a) ED, (b) CID, and (c) DTW.
Temperature sensor clusters based on (a) ED, (b) CID, and (c) DTW.

Illumination sensor dendrogram based on (a) ED, (b) CID, and (c) DTW.

Illumination sensor clusters based on (a) ED, (b) CID, and (c) DTW.
4.3. Evaluation
In order to show the feasibility of our proposed sensor selection method, we performed a classification analysis of building environment based on temperature and humidity data sets. One advantage of our sensor selection method is that the data set collected from the reduced number of sensors could still preserve the dominant information enough to categorize it into clusters, for example, personal comfort level (comfortable, neutral, uncomfortable). Assessing comfort level is a subjective evaluation, so we decided to choose another criterion to show the feasibility of our sensor selection method. In the classification study, as shown in Figure 11, the input attributes are temperature and humidity time series over an hour collected from (a) all 12 sensor nodes and (b) the selected 6 sensor nodes (we exclude the broken 11th sensor node in both analysis), and the target attributes were set to which day of the week. Given a 1 hour temperature and humidity data set collected on an unknown day, the machine learning classifier will predict on which day of the week the temperature and humidity data set was collected. Note that the amount of data used for training and classifying decreases by half; that is, the computational and memory requirement for training and classifying data would significantly reduce by more than half. Accordingly, the remaining task is to show the recognition accuracy with the data sets collected from the reduced number of sensors in comparison with the result with the original data sets.

Classification analysis using temperature and humidity data sets collected from (a) all 12 sensors and (b) the selected 6 sensors.
We first performed the classification with the temperature and humidity data set collected from 12 sensor nodes and compared the result with the one with the data set collected from the selected 6 sensor nodes. Among various available machine learning algorithms, we chose seven classification methods: Bayes net, decision tree (C4.5), decision table, instance-based learning (k-nearest neighbor algorithm), multilayer perceptron, Naïve Bayes, and support vector machine. Support vector machine is chosen as one of the state-of-the-art discriminative methods with a good performance in many applications. We chose the simple k-nearest neighbor algorithm from instance-based learning algorithms and decision tree and decision table from rule-based learning algorithms. In addition, Bayes net is chosen as one of generative models to show its performance in our experiments. We also used Naïve Bayes and multilayer perceptron as classifiers. All the experiments based on these classifiers were carried out using Weka developed by the Machine Learning Group at University of Waikato [25].
Table 1 summarizes mean and standard deviation for classification accuracy over the selected classification methods based on temperature and humidity we have collected. We used 10 times 10-fold cross-validation, in other words, 10 different 10-fold cross-validation experiments with the same learning method and data set, averaging the 100 experimental results. In Table 1, we can know that support vector machine algorithm shows the best classification performance in both analysis. This result is not very surprising because the past work in [7] performed automatic recognition of the subject's comfort with support vector machine classifier and shows a good recognition accuracy. Accordingly, we can know that support vector machine algorithms will be able to be widely deployed for automatic recognition in building environment analysis based on data sets collected.
Summary of classifier results (mean ± standard deviation). Comparison of recognition accuracy (%) of 1 hour and 1 day classification by temperature and humidity time series.

We next show the comparison of recognition accuracy between (a) all 12 nodes and (b) the selected 6 nodes. Note that the recognition accuracy of support vector machine classifier decreases by about 13 percent with the 6 selected sensor nodes (75.24%). This is probably because the data set from the selected nodes might lose some information affecting the recognition accuracy. Therefore, it is a tradeoff between overall cost reduction due to the selected sensor nodes and the amount of information affecting building environment analysis. Of course, for example, selecting more than one representative sensor node for each cluster in sensor clustering will be able to increase the recognition accuracy, though this means the larger number of sensor nodes deployed, increasing the cost for sensor network deployment and the amount of computational resources required. As a result, we can conclude with confidence that the data sets collected from the sensor nodes selected by the proposed method could include the building environment discriminatory information enough to perform building environment analysis for smart energy systems.
5. Conclusion
We have presented deployment support for sensor network in which the data set collected from sensor network could have as much of building environment discriminatory information as possible for smart energy systems. We have collected temperature, humidity, and illumination data set from 13-ZigBee-based wireless sensor nodes for one week in a laboratory environment. We next grouped the wireless sensor nodes into coherent sensors with hierarchical clustering based on three similarity measures: Euclidean distance, complexity invariance distance, and dynamic time warping distance. By selecting a representative sensor with the maximum value of RSSI for each cluster and removing the other redundant sensors, we could reduce the number of sensor nodes deployed for indoor climate monitoring while preserving the class discriminatory information with the reduced number of sensor nodes.
Footnotes
Acknowledgments
This work was supported by the IT R&D program of MKE/KEIT. 10041262, Open IoT Software Platform Development for Internet of Things Services and Global Ecosystem.