
Abstract
For long-span bridges located in wind-prone regions, it is a trend to install in situ Wind and Structural Health Monitoring System (WASHMS) for long-term real-time performance assessment. One of the functions of the WASHMS is to provide information for the assessment of wind-induced fatigue damage. Considering the randomness of wind, it is more reasonable to describe wind-induced fatigue damage of bridge in a probabilistic way. This paper aims to establish a probabilistic fatigue model of fatigue damage based on Bayesian learning, and it is applied to a wind-excited long-span bridge installed with a WASHMS. Wind information recorded by the WASHMS is utilized to come up with the joint probability density function of wind speed and direction. A stochastic wind field and subsequently wind-induced forces are introduced into the health monitoring oriented finite element model (FEM) of the bridge to predict the statistics of stress responses in local bridge components. Bayesian learning approach is then applied to determine the probabilistic fatigue damage model. The Tsing Ma suspension bridge in Hong Kong and its WASHMS are finally utilized as a case study. It shows that the proposed approach is applicable for the probabilistic fatigue assessment of long-span bridges under random wind loadings.
1. Introduction
To meet social and economic needs of the community for efficient and convenient transportation systems, many long-span bridges have been built throughout the world, and the super long suspension bridges with main span length beyond 3000 meters are also under consideration. They become more flexible and susceptible to strong winds as their span length increases. Long-span bridges in wind-prone regions suffer considerable buffeting-induced vibration, which appears within a wide range of wind speeds and lasts for almost the whole design life of the bridge. Frequent occurrence of the buffeting may cause fatigue damage of steel girders or other structural members of the long-span bridge.
To protect such immense capital investments and ensure user comfort and bridge safety during the serviceability stage, structural health monitoring systems (SHMSs) have been installed on bridges to monitor their integrity, durability, and reliability. According to Ko and Ni [1], the main objectives of long-term SHMSs are (i) the validation of design assumptions and parameters and the potential improvement of design specifications and guidelines for future similar structures; (ii) the detection of anomalies in loading and responses and possible damage or deterioration at an early stage to ensure structural and operational safety; (iii) the provision of real-time information for safety assessments immediately after disasters and extreme events; (iv) the provision of evidence and instructions for planning and prioritizing bridge inspection, rehabilitation, maintenance, and repair; (v) the monitoring of repairs and reconstruction with the view of evaluating the effectiveness of maintenance, retrofit, and repair works; and (vi) the generation of large amounts of in situ data for cutting-edge bridge engineering research, such as wind- and earthquake-resistant designs, new types of structures, and smart material applications.
Nowadays, many countries around the world have recognized the significance of implementing long-term SHMSs for long-span bridges. Many long-span bridges with spans of 100 m or longer in Europe [2, 3], the United States [4, 5], Canada [6, 7], Japan [8], South Korea [9, 10], China [11–15], and other countries have been instrumented with long-term monitoring systems. In the past decade, significant progress has been made in sensing technology, and kinds of innovative sensing systems such as fiber optic sensors, wireless sensors, and global positioning system (GPS) are now becoming commercially available [16–20]. A sensing system is essential for realizing structural health monitoring of bridges. Given that there are tens of thousands of components in a large-scale civil structure, determination of critical locations to damage [21, 22] and optimal sensor placement [23–25] are vital for an effective structural health monitoring system.
Currently, many works have been carried out in regard to traffic-induced fatigue damage of steel bridges [26], but there has been very limited research on buffeting-induced fatigue damage of long-span bridges [21, 27, 28]. Li et al. [29] used the strain data recorded by the wind and structural health monitoring system (WASHMS) installed on the Tsing Ma Bridge to assess fatigue damage of the structural members at the strain gauge points for a single typhoon. Liu et al. [30] analyzed the buffeting-induced stresses in a long suspension bridge based on a structural health monitoring oriented FEM of the Tsing Ma Bridge. Subsequently, Xu et al. [21] assessed the long-term buffeting-induced fatigue damage in a long suspension bridge. However, most of them use the deterministic methods without considering the effects of uncertainties in both external loadings and structural parameters. In reality, uncertainties exist in external loadings, structural modeling, and structural parameter in fatigue assessment. Furthermore, few literatures use probabilistic approaches to assess fatigue damage of long-span bridges under stochastic wind loading. To investigate the failure probability of wind-induced fatigue damage for a given time epoch at a typical location, it is necessary to develop probabilistic approach for fatigue assessment of wind-excited long-span bridges.
This paper aims to establish a probabilistic fatigue model of fatigue damage based on Bayesian learning, and it is applied to a wind-excited long-span bridge with multiple types of sensors installed on it. Wind information recorded by the WASHMS is utilized to come up with the joint probability density function of wind speed and direction. A stochastic wind field and subsequently wind-induced forces are introduced into the health monitoring oriented-FEM of the bridge to predict the statistics of stress responses in bridge structural members. Bayesian learning approach is then applied to determine the probabilistic fatigue model. The Tsing Ma suspension Bridge in Hong Kong and the data recorded by the WASHMS installed in the bridge are finally utilized as a case study.
2. Wind-Induced Critical Stress Analysis
2.1. Long-Span Bridges and WASHMS
For long-span bridges located in wind-prone regions, it is a trend to install WASHMS on the bridge for long-term real-time bridge performance assessment. The Tsing Ma suspension Bridge in Hong Kong is an example among these bridges. It is a suspension bridge with an overall length of 2,160 m and a main span of 1,377 m between the Tsing Yi Tower in the east and the Ma Wan tower in the west (see Figure 1(a)). The bridge deck carries a dual three-lane highway on the top deck and two railway tracks and two carriageways on a lower level within the bridge deck. The alignment of bridge deck deviates for 17° counterclockwise from the east-west axis (see Figure 1(b)).

Tsing Ma Bridge in Hong Kong.
To monitor the functionality, safety, and integrity of the bridge, the WASHMS was installed in 1997 and is operated by the Highways Department of the Government of the Hong Kong Special Administrative Region [31]. Its integrated architecture is composed of five systems: (1) sensory, (2) data acquisition and transmission, (3) data processing and control, (4) bridge health evaluation, and (5) inspection and maintenance systems [31]. The sensory system comprises 300 sensors installed in the bridge, which include anemometers, temperature sensors, corrosion cells, hygrometers, barometers, rainfall gauges, weigh-in-motion stations, digital video cameras, weldable foil-type strain gauges, servo-type accelerometers, level sensing stations, displacement transducers, tiltmeters, buffer sensors, bearing sensors, and tension magnetic gauges. The layout of the sensory and data acquisition systems on the Tsing Ma Bridge is illustrated in Figure 2. The sensors are grouped into four categories to monitor the environmental, traffic, global, and local conditions of the bridge.

Layout of the sensory and data acquisition systems [32].
2.2. Joint Probability Density Function of Wind Speed and Direction
Compared with the approach which considers the mean wind speed only, it is better to establish a joint probability distribution function of wind speed and wind direction in the assessment of wind-induced fatigue damage. Wind speed and wind direction are chosen as two coefficients considered in the probabilistic model of wind loading. To build the model, it requires a great mount of field measurement wind data collected at the bridge site. In this study, 19,775 hourly monsoon wind records of hourly mean wind speed and direction within the period between January, 1, 2000 and December, 31, 2005 from the anemometer installed on the top of the Ma Wan tower are used to find the joint probability density function of hourly mean wind speed and direction [21] It was assumed that (1) the distribution of the component of wind speed for any given wind direction follows the Weibull distribution and (2) the interdependence of wind distribution in different wind directions can be reflected by the relative frequency of occurrence of wind. Consider

in which ϕ is the wind direction (
The 19,775 hourly monsoon records were classified into 16 sectors of the compass with an interval of
2.3. Wind-Induced Critical Stress Analysis
Strain gauges for strain measurements in the WASHMS installed on a long span bridge are always limited. Not all stress responses of local structural components can be directly monitored. To facilitate the complete assessment of bridge safety, a structural health monitoring oriented FEM is required for a long span bridge so that stresses/strains in all important bridge components can be directly estimated. In this regard, Liu et al. [30] established a complex structural health monitoring (SHM) oriented-FEM for the Tsing Ma Bridge with significant modeling features of the bridge deck included for the good replication of geometric details of the as-built decks (see Figure 3). The proposed SHM oriented FEM was also updated using the measured first 18 natural frequencies and mode shapes of the bridge. It turned out that the updated FEM could provide comparable and reliable structural dynamic modal characteristics.

3D finite element model of Tsing Ma Bridge.
Based on the established structural health monitoring oriented FEM, Liu et al. [30] further proposed a numerical simulation for wind-induced stress analysis of long-span bridges. Significant improvements were demonstrated with the fact that the effects of the spatial distribution of both buffeting forces and self-excited forces on a bridge deck structure were taken into account, and the local strain/stress, which is prone to cause local damage, was able to be directly estimated. The field measurement data including wind, acceleration, and stress recorded by the WASHMS installed on the Tsing Ma Bridge during Typhoon York were analyzed and compared with the numerical results to verify, to some extent, the proposed procedure. This procedure will be used to find out wind-induced critical stress responses as the first step in the probabilistic wind-induced fatigue damage model proposed in this study.
There are a total of 15,904 beam elements used to model the Tsing Ma Bridge deck. Wind-induced critical stress analysis is carried out by considering a 15 m/s mean wind speed perpendicular to the bridge axis from the south for one hour. By comparing the maximum values and the standard deviations of all stress time histories, the cross sections of the bridge deck at the Tsing Yi Tower and Ma Wan tower are identified as the most critical sections. The six elements of no. 34417 and 38417, 40903 and 48917, 58417, and 59417 in the cross section of the bridge deck at the Tsing Yi Tower (CH25000 in Figure 1(a)) are critical members (see Figure 4). Figure 5 shows one-hour stress time history of the element 40903 under a 15 m/s mean wind speed perpendicular to the bridge axis from the south.

Critical deck section and critical elements identified.
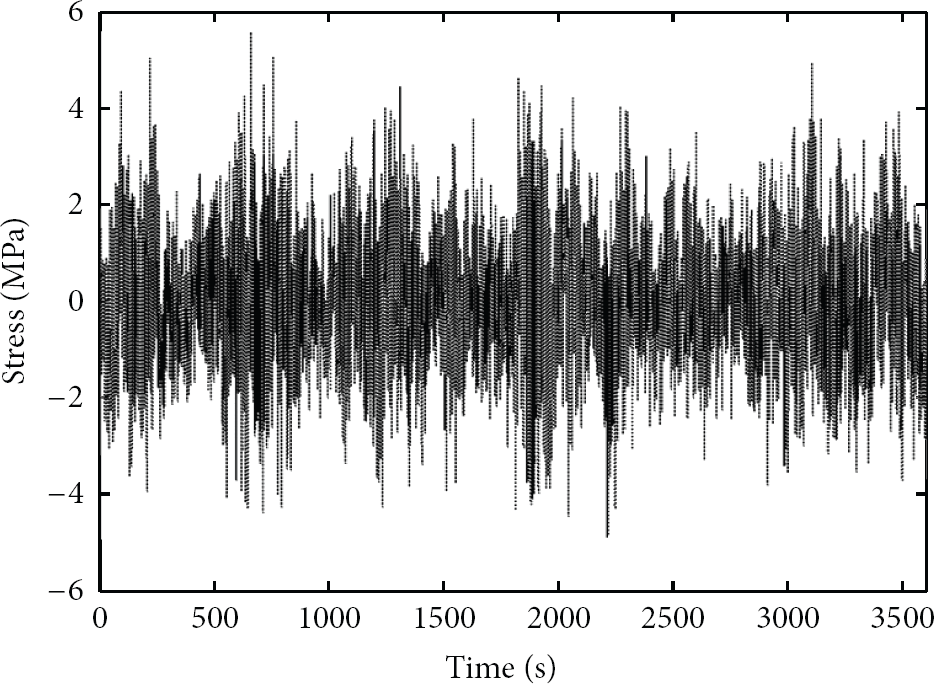
Hourly stress time history of element 40903.
3. Probabilistic Cumulative Fatigue Damage Model
Considering the randomness of wind speed and direction, it is more reasonable to describe wind-induced fatigue damage of a large-scale bridge in a probabilistic way. To establish a probabilistic cumulative fatigue damage model, several steps of work should be carried out. In the first step, the hourly mean wind in a given returned period is drawn out to compose a stochastic process using the Monte Carlo simulation method based on the joint probabilistic distribution of mean wind speed and direction. Then, the stochastic process of hourly wind-induced fatigue damage is developed based on the stochastic process of hourly mean wind and the hourly fatigue damage database. Finally, the probabilistic cumulative fatigue damage model is established using the Bayesian learning method.
3.1. Stochastic Process of Hourly Normal Mean Wind Speed
The wind return period is selected as 120 years in this study. The hourly mean wind speed and direction in 120 years are considered to be stochastic processes, which are composed of
After the hourly mean wind speed and direction are generated at the average bridge deck level in 120 years, the hourly normal mean wind speed (mean wind component perpendicular to bridge axis) could be calculated based on the fact that the alignment of bridge deck deviates for 17° in counterclockwise from the east-west axis (see Figure 1(b)). As a result, the stochastic processes of hourly normal mean wind speed can be determined. A total of 200 samples of hourly normal mean wind speeds are general for a return period of 120 years, and two of them are plotted in Figure 6.

Two samples of hourly normal mean wind speed in 120 years.
3.2. Stochastic Process of Hourly Wind-Induced Fatigue Damage
Based on the simulated hourly wind-induced stress responses of critical members, wind-induced hourly fatigue damages could be estimated according to the recommended methods in the British Standard BS5400 [33]. The type of welded connection for the elements 34417, 38417, 40903, and 48917 are classified as F2, and the type of welded connection for the elements 58417 and 59417 is classified as F. In the following, the wind-induced hourly fatigue damage and cumulative fatigue damage are presented for the element 40903 only.
The hourly wind-induced fatigue damage mentioned above is estimated for different normal mean wind speeds ranging from 5 m/s to 30 m/s with an interval of 5 m/s in this study. The linear interpolation is used for other wind speeds to form an hourly fatigue damage database. To consider the effect of wind terrain, wind over the overland fetch and the open-sea fetch on the bridge site are respectively assessed to have two hourly fatigue damage databases. To obtain the stochastic process of hourly wind-induced fatigue damage, the hourly fatigue damage databases are applied to each sample of hourly normal mean wind speed (see Figure 6) to have the corresponding sample of hourly wind-induced fatigue damage as depicted in Figure 7. Fatigue damage induced in the each hourly stress time history is calculated using Miner's rule and British S-N curves in BS [33]. Fatigue damage is a nondimensional parameter, which begins with zero and accumulates along with each load cycle applied to bridge structures, and fatigue failure occurs when cumulative fatigue damage is equal to one. It can be seen that the samples of hourly wind-induced fatigue damage are different from each other owing to the random nature of wind speed and direction. A probabilistic model of cumulative fatigue damage is therefore required for structural reliability analysis.
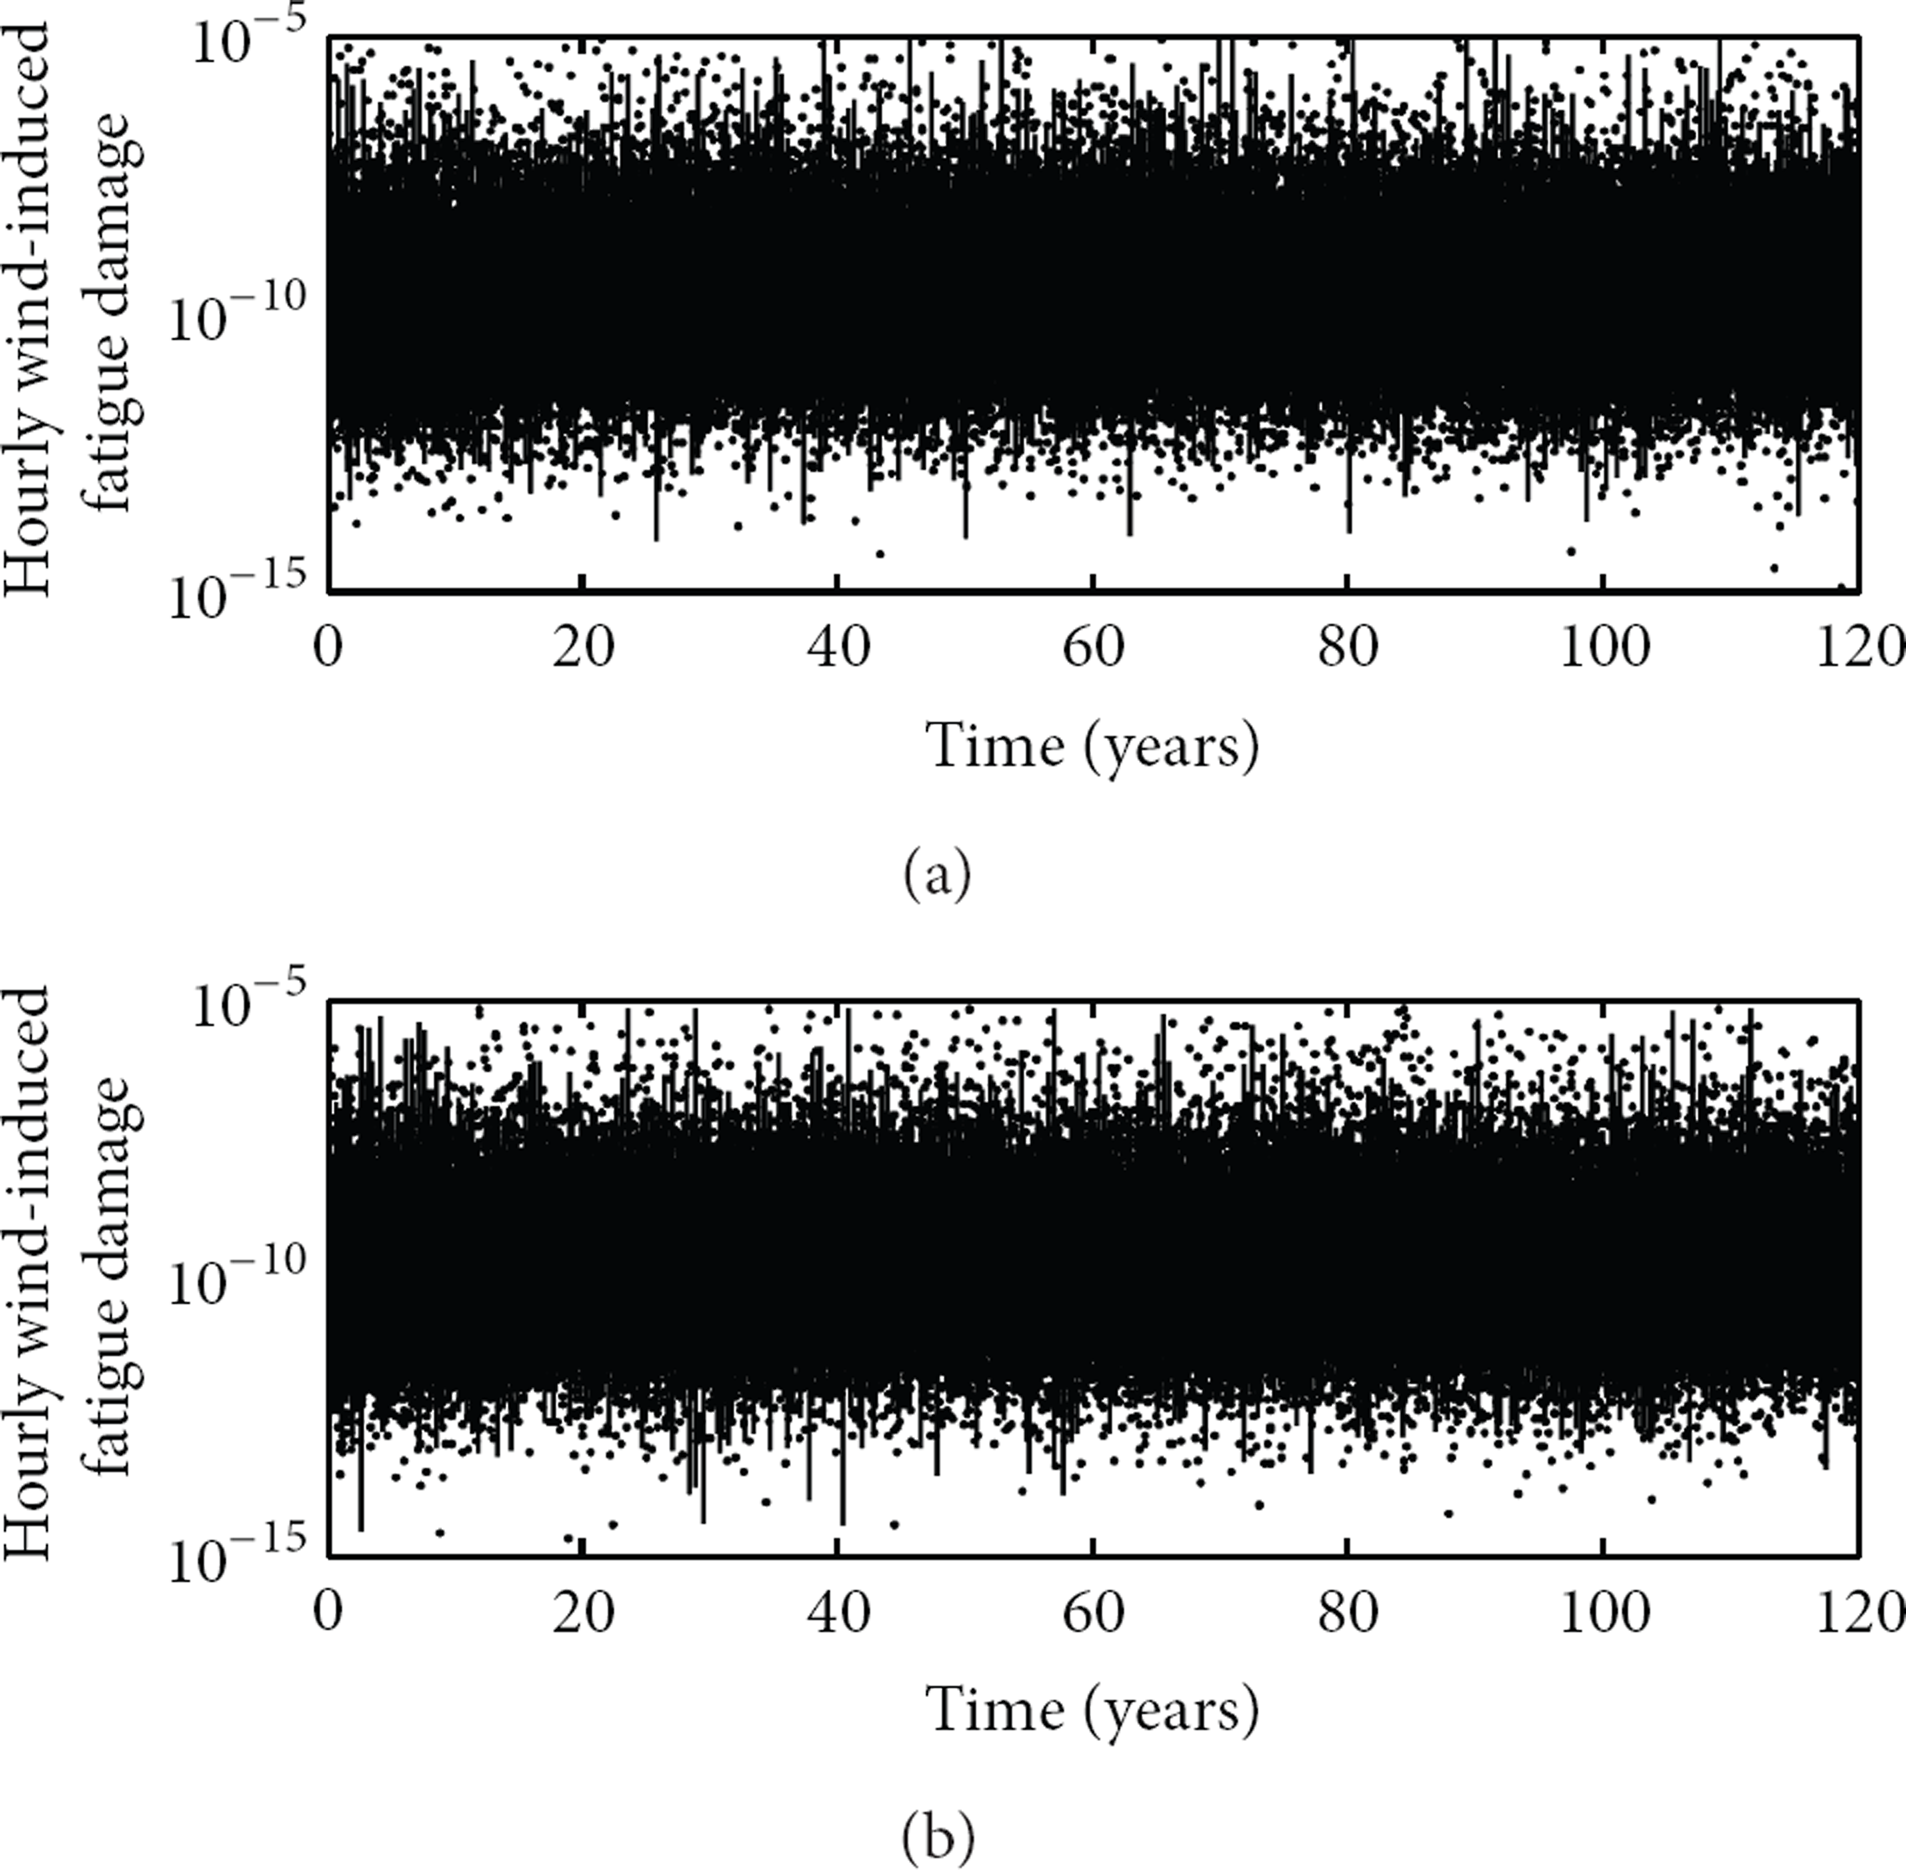
Two samples of hourly wind-induced fatigue damage in 120 years.
3.3. Probabilistic Cumulative Fatigue Damage Model
Based on the linear fatigue damage cumulative rule, each sample of hourly wind-induced fatigue damage yields a damage index for a given time period such as 120 years. Such a damage index is a random variable. To determine its probabilistic distribution or probabilistic model of cumulative fatigue damage, the model parameters should be estimated from samples. The traditional model parameter estimation methods assume model parameters to be deterministic and all samples come from the same probabilistic model. This is not definitely suitable for the current study because the WASHMS provides new measurement data year after year. The probabilistic cumulative fatigue damage model should be updatable. In this regard, Bayesian parameter learning approach is adopted for the parameter estimation in this study. Bayesian parameter learning has its advantages over traditional methods, allowing the model parameters considered to be random variables following probability distributions, facilitating the updating process as new samples introduced to modify the prior model, and offering the estimation of the sample size in a statistical view for reliable parameters estimation.
Neapolitan [34] presented the Bayesian parameter learning method for one random variable with a normal distribution. The initial parameters of the distribution include the mean value μ and the absolute variance

where

It is important to know how many samples are required to have reasonably accurate parameter estimation. Another parameter r, (
It can be seen that the ratio S depends on the size of sample
The 200 samples are used in this study for estimating the parameters in the probabilistic cumulative fatigue damage model. In consideration of the nonnegative character of cumulative fatigue damage, the cumulative fatigue damage index
The resulting mean and standard deviation of the cumulative fatigue damage index for 120 years are displayed in Figure 8 against the size of the samples. It can be seen that when the size of samples is increased to 150, the two parameters become stable already.
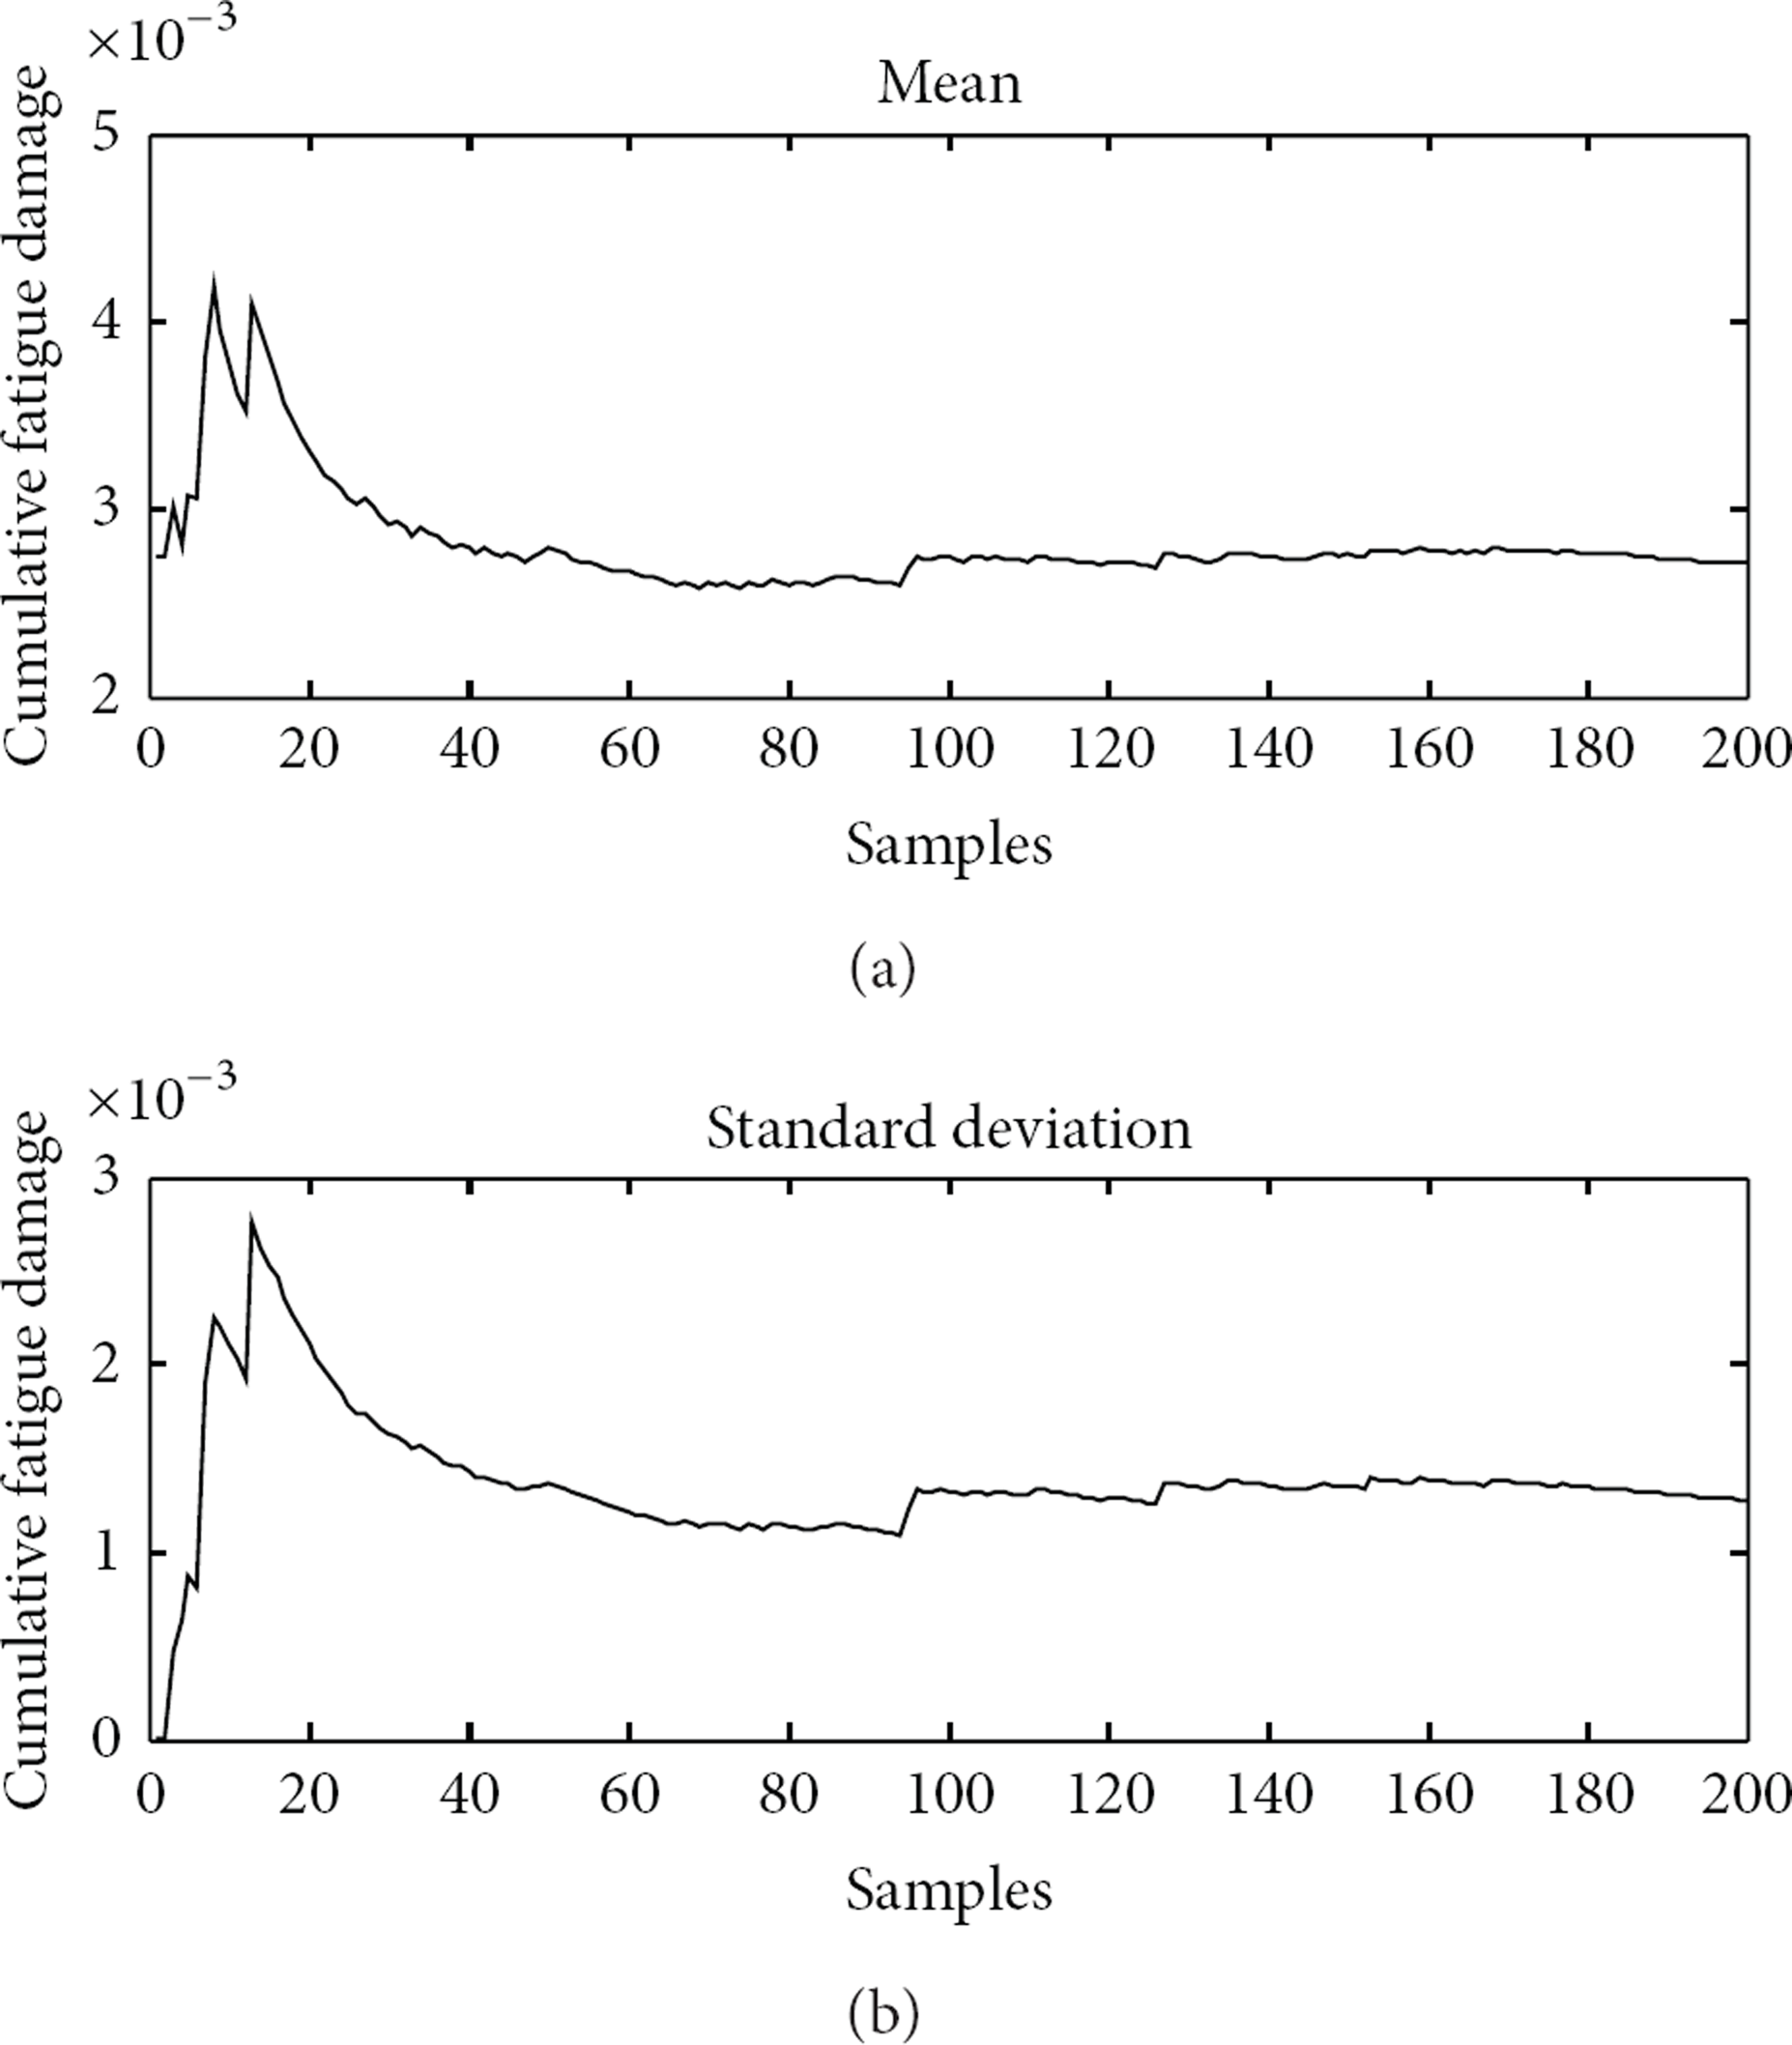
Mean and standard deviation of cumulative fatigue damage index.
To check if the assumption of lognormal distribution is reasonable for cumulative fatigue damage index, the probability distribution function of cumulative fatigue damage index for different time periods, such as 40 years, 80 years, and 120 years, is calculated using the proposed model with updated parameters, and the results are plotted in Figure 9. Meanwhile, the 200 samples are sorted in ascending order, and the probability distribution function is then directly obtained from these samples using the following equation:

where n is the sequence number of samples in ascending order and N is the size of samples. It can be seen from Figure 9 that the samples follow the proposal model well. The probability density function of cumulative fatigue damage index is also calculated using the proposed model with the updated parameters. The resulting density functions are plotted in Figure 10 for different time periods. The updated mean parameters are also plotted in Figure 10 to provide some indication of the fatigue damage index distribution. Both probability distribution functions and the probability density functions indicate that monsoon wind-induced bridge fatigue damage indices are far less than one. The monsoon wind-induced fatigue damage to the bridge is not significant. However, it should be pointed out that the fatigue damage to the bridge caused by typhoon and traffic loading is not considered in this study. It is being proposed to apply the similar procedure to consider typhoon and traffic loading-induced fatigue damage.

Probability distribution function of cumulative fatigue damage.

Probability density function of cumulative fatigue damage.
4. Conclusions
A probabilistic cumulative fatigue damage model has been established based on the Bayesian learning approach for wind-excited long-span bridges installed with multiple types of sensors for long-term health monitoring. The Tsing Ma Bridge in Hong Kong and the measurement data from its WASHMS have been used as a case study. The results from the case study show that the proposed approach is applicable for the probabilistic fatigue life assessment of large-scale bridges under random wind loadings. The results also show that monsoon wind-induced fatigue damage to the bridge is not significant because the fatigue damage to the bridge caused by typhoon and traffic loading is not considered in this study. It is being proposed to apply the similar procedure to consider the total fatigue damage caused by a combination of monsoon wind, typhoon wind, and traffic loading.
Footnotes
Acknowledgments
The authors wish to acknowledge the financial supports from the National Natural Science Foundation of China (NSFC-51108395) and the Fundamental Research Funds for the Central Universities (2012121032). Sincere thanks should go to the Highways Department of Hong Kong for providing the authors with the field measurement data. Any opinions and concluding remarks presented in this paper are entirely those of the authors.