
Abstract
A bridge is a critical edge whose fault disables the data delivery of a WSN component. Because of this, it is important to detect bridges and take preventions before they are corrupted. Since WSNs are battery powered, protocols running on WSN should be energy efficient. In this paper, we propose two distributed energy-efficient bridge detection algorithms for WSNs. The first algorithm is the improved version of Pritchard's algorithm where two phases are merged into a single phase and radio broadcast communication is used instead of unicast in order to remove a downcast operation and remove extra message headers. The second algorithm runs proposed rules on 2-hop neighborhoods of each node and tries to detect all bridges in a breadth-first search (BFS) execution session using O(N) messages with O
1. Introduction
Rapid developments in the last decade in wireless and hardware technologies have created low-cost, low-power multifunctional miniature wireless devices. These devices have enabled the use of wireless sensor networks (WSNs) [1]. WSNs do not have any fixed infrastructure where hundreds even thousands of sensor nodes cooperate to implement a distributed application. WSNs can be used in various applications including habitat monitoring [1], military [2], and smart home applications [3]. Energy consumption of a WSN should be reduced to maximize the application lifetime since sensor nodes are battery powered. The radio component of a sensor node is the dominant energy consumer part.
WSNs are increasingly being used in challenged environments such as underground mines, tunnels, oceans, and the outer space. Wireless communication in challenged environments have channel (edge) failures, mainly as a consequence of direct impact of physical world. In addition to energy constraints and wireless communication problems, tiny sensor motes are prone to failures. In both type of these failures, sensor network can continue its operation without a serious bad effect. On the other side, some edges can have critical tasks in routing operation. These edges are called bridges (cut edges) which its removal breaks connectivity of the network. Bridge detection is an important research area for different types of networks [4–9]. After bridges are detected, various solutions can be applied [10] in order to neutralize bridges.
A WSN can be modeled with an undirected graph
Distributed bridge detection algorithms proposed so far have some important disadvantages. Although distributed DFS based algorithms [8, 17–20] are simple and efficient for bridge detection, DFS based applications for WSN are rare in practice. Since then, DFS should be implemented as a separate service where this would be an extra load for battery-powered sensor nodes. Although BFS provides an efficient routing infrastructure for sensor networks, BFS based bridge detection algorithms lack some important design criterions. The message size of the Milic's BFS based algorithm [9] can be as large as O(E We propose an improved version of Pritchard's algorithm (I-PRITCHARD). In I-PRITCHARD algorithm, radio broadcast communication is used instead of unicast communication, and a downcast operation in Pritchard's algorithm is removed. I-PRITCHARD can be completed within 2 phases; on the other hand, Pritchard's algorithm needs 3 phases. Because of these reasons, I-PRITCHARD consumes less energy than the Pritchard's algorithm. We propose the energy-efficient bridge detection algorithm (ENBRIDGE) by using 2-hop neighborhood knowledge and radio broadcast communication. The algorithm uses O(N) messages with O(
The rest of this paper is organized as follows. In Section 2, the network model and bridge detection problem are described, and the related work is surveyed in Section 3. The proposed algorithms are described in Section 4. The detailed analysis of the algorithms are given in Section 5, and the results of performance tests are presented in Section 6. Conclusions are given in Section 7.
2. Background
In this section, we introduce the network model and the bridge detection problem.
2.1. Network Model
The following assumptions are made about the network as in [8, 22].
Each node has distinct node_id. The nodes are stationary. Links between nodes are symmetric. Thus, if there is a link from u to v, there exists a reverse link from v to u. Nodes do not know their positions. They are not equipped with a position tracker like a GPS receiver. All nodes are equal in terms of processing capabilities, radio, battery, and memory. Each node can send radio broadcast messages to its immediate neighbors in its transmission range. Nodes are time synchronized. This can be achieved by implementing a time synchronization protocol as proposed in [23].
Based on these assumptions, the network may be modeled as an undirected graph G(V, E), where V is the set of vertices and E is the set of the edges. An example of undirected graph model is depicted in Figure 1(a), where the transmission ranges of the nodes are shown with dashed circles.

(a) Undirected graph model. (b) The bridge problem.
2.2. The Bridge Detection Problem
Bridges can connect any two nodes on the network. A bridge can connect a leaf node to its parent or connect a whole component to lower layers. An example of sensor network is depicted in Figure 1(b). There are 10 nodes, where node ids are written inside of each node, and the communication edges are shown with the solid lines in this Figure. The edges ( Since message transmission is the dominant factor of energy consumption, the bridge detection algorithm should be efficient in terms of message complexity and message size. Routing is a fundamental operation for sensor networks. It is crucial for data delivery and data aggregation [24]. If the bridge detection can be integrated with the routing operation, it can introduce a less total cost to the network. Sink node may initiate the bridge detection algorithm locally. Hence, these operations should be distributed. Bridge detection algorithm should be independent from the underlying protocols as much as possible to interface to various MAC and physical layer standards such as in [25–30]. The algorithm should not be dependent on localization information.
3. Related Work
DFS algorithm can be centrally executed by the sink node in order to detect bridges [4, 9]. Since collecting the whole network information is expensive and not always possible, various distributed implementations are proposed for DFS algorithm [17, 20, 31–36]. Most of these algorithms can be modified to detect bridge in sensor networks by using the rules proposed by Tarjan [4]. Cidon [17], Hohberg [18], Chaudhuri [19], Tsin [20], and Turau [8] proposed distributed DFS algorithms for bridge and cut vertex (a vertex whose removal breaks the connectivity of a graph) detection algorithms. Turau's algorithm [8] is an extended and sensor network adopted version of Cidon's [17] and Tsin's [20] algorithms. At the worst case, Turau's algorithm transmits 4E messages with O(
Like DFS, BFS can be centrally executed to detect bridges [9]. Although this algorithm is simple to implement, execution of central BFS is an expensive operation in terms of energy consumption caused by message transfers, and it is not suitable for large scale self-organizing distributed sensor networks. Because of these reasons, distributed BFS algorithms are proposed [12–16]. For synchronous networks, a well-known greedy algorithm is applied to construct BFS [14]. This algorithm consumes O(N) messages and O(D) time, where D is the diameter of the network. Although this algorithm is very effective for constructing routing infrastructure, it is not adequate to find bridges without any extension. Liang proposed a BFS algorithm for biconnectivity testing algorithm which runs on permutation graphs and which cannot be generalized [5]. Thurimella proposed a BFS biconnectivity testing algorithm in which each processor is assumed to know the whole topology [6]. Because of this property, algorithm is not suitable for WSNs.
Milic proposed a bridge detection for wireless ad hoc networks [9]. The algorithm uses broadcast communication of wireless nodes, and it is integrated with the BFS operation. The forward phase of the algorithm is nearly the same with the standard BFS operation. In the backward phase of the algorithm, the nodes store a list of cross edges that they found or received, append cross edges to the messages, and send to their parents. Although the algorithm completes its operation within a BFS execution interval, the message size can be very large since it is dependent on the number of cross edges. The message size can be as large as O(E
Pritchard proposed a three-phased algorithm for the distributed bridge detection [21]. In the first step, the algorithm finds a spanning tree by implementing distributed greedy BFS tree algorithm. In the second step, the algorithm computes subtree sizes and preorder labels. In the last step, bridges are detected. The time complexity of the algorithm is O(D), the message complexity is O(E), and the message size is O(
4. Proposed Algorithms
4.1. Improved PRITCHARD Algorithm
PRITCHARD algorithm effectively detects bridges of an undirected graph by applying a 3 phase method. Although the algorithm is well designed, it can be further improved for battery-powered sensor nodes. To achieve this, we propose the I-PRITCHARD algorithm which includes the following list of modifications in order to reduce transmitted message counts and transmitted bit counts.
Phase 1 and Phase 2 can be merged into a single phase. When the nodes are executing backward operation during BFS execution in Phase 1, each node may calculate its subtree size ( Preorder messages in Phase 2 and announcement messages in Phase 3 are sent as broadcast messages instead of unicast. In this case, although the message size increases to O(
An example operation is given in Figure 2. Since BFS execution is integrated with the preorder labeling in I-PRITCHARD, the algorithm is executed in 2 phases. The first phase is depicted in Figure 2(a). In this figure, ID of the nodes is written inside of each node,

(a) I-PRITCHARD Phase 1 (b) I-PRITCHARD Phase 2.
4.2. ENBRIDGE Algorithm
The algorithms covered so far have below listed deficiencies which motivate us to design ENBRIDGE algorithm.
Even though the design of an energy-efficient DFS based bridge detection algorithm is possible, DFS applications are rare in real-world applications. Because of that, the DFS based bridge detection module may not be integrated to the other applications. Although MILIC may be easily integrated to the BFS, transmitted bit count is proportional to the network diameter and cross edge count. PRITCHARD and I-PRITCHARD are BFS based algorithms, transmitted bit counts are proportional to the average neighbor degree. Although these algorithms are energy-efficient, extra phases are executed after the BFS algorithm.
We propose ENBRIDGE algorithm for detecting bridges in WSN in an energy-efficient manner. The algorithm has two phases. In the first phase, an extended BFS algorithm is executed. The forward phase of the BFS algorithm is the same. At the backward phase of the BFS algorithm, each node broadcasts its edge states to its neighbors where a state of an edge can be one of
and id of one of node n's children
After executing these rules at the backwards stage of the first phase, each node notifies whether it is able to classify its parent link. To achieve this notification, a 1-bit classified field is transmitted during convergecast operation in backwards stage. If the node n or one of descendants cannot classify its parent link, classified field gets 0, otherwise it gets 1. Inductively, sink node finds whether one of the BFS edges is left unclassified. If the node n sends classified as false, then its parent node p does not execute ENBRIDGE_Classify as given in Algorithm 2 in order to save CPU power. If all BFS edges are classified, then sink node stops the execution of the algorithm. Otherwise, the sink node starts the second phase of the ENBRIDGE algorithm.
Although the second phase of the ENBRIDGE algorithm is not always executed, it should be energy-efficient as the first phase. For the second phase, we propose an improved version of the TURAU's DFS based algorithm (I-TURAU). In this improved version,
Example operations of ENBRIDGE are depicted in Figure 3. In the first example shown in Figure 3(a), all edges can be classified by the first phase of the algorithm. Edges (10, 12) and (6, 11) are classified as bridges by executing Rule 1. Edges (1, 3), (2, 4), (4, 6), (5, 7), (5, 8), and (5, 9) are classified as nonbridges by executing Rule 2. Edge (6, 10) is classified as bridge by executing Rule 3. Edges (1,

(a) ENBRIDGE Phase 1 classifies all edges and (b) ENBRIDGE Phase 2 is necessary.
5. Analysis
In this section, we will analyze proof of correctness, message, time, space, and computational complexities of the I-PRITCHARD and ENBRIDGE algorithms.
5.1. Proof of Correctness
Theorem 1.
Nodes executing I-PRITCHARD detect bridges and terminate the execution correctly.
Proof.
Correctness of merging Phase 1 and Phase 2 into a single phase can be proved by induction. Since the BFS execution is synchronous, each leaf node can calculate its
Theorem 2.
Each node detects its parent link state correctly after executing the ENBRIDGE algorithm.
Proof.
We first prove the correctness of the ENBRIDGE_Classify algorithm. To prove the correctness of Rule 1, we assume that the node n has only 1 incident edge. In this case, the node n is a leaf; thus, ( The edge e equals ( The edge e equals (
To prove the correctness of Rule 3, we assume that the node n does not have any cross edge; the edge (
If all of these rules are not applicable, ENBRIDGE uses broadcast-based TURAU to find bridges. Thus, ENBRIDGE detects bridges, and execution of the ENBRIDGE terminates in all nodes.

(a) Example for ENBRIDGE Rule 4. (b) Example for ENBRIDGE Rule 5.
5.2. Message Complexity
Theorem 3.
The count of sent messages in I-PRITCHARD is 3N-1 at the best case and 4N-3 at the worst case.
Proof.
At the best case, the nodes are arranged as a star topology, where 2N-1 messages are sent at the first phase, 1 message is sent by the center node at the beginning of the second phase, and N-1 messages are sent by the other nodes at the end of the second phase. Thus, 3N-1 total messages are sent at the best case. At the worst case, 2N-1 messages are sent at the first phase, N-1 announcement messages are sent at the beginning of the second phase, and N-1 at the end of the second phase; thus, 4N-3 messages are sent.
Theorem 4.
The count of sent messages in ENBRIDGE is 2N-1 at the best case and 4N-3 at the worst case.
Proof.
At the best case, only BFS is executed on the star topology, so 2N-1 messages are sent. At the worst case, an extra DFS is executed, where each node uses broadcast instead of unicast, so 2N-2 messages are sent. Hence, 4N-3 total messages are sent at the worst case.
Theorem 5.
The count of received and overheard messages of I-PRITCHARD is O(
Proof.
At the worst case, each node receives and overhears
Theorem 6.
The count of received and overheard messages of ENBRIDGE is O(
Proof.
Each node receives and overhears
Theorem 7.
The message size of I-PRITCHARD is O((
Proof.
In I-PRITCHARD, each parent node announces preorder label of its children by broadcasting a single message. Thus, the message size of the I-PRITCHARD is O(
Theorem 8.
The message size of ENBRIDGE is O(
Proof.
At the backwards stage of ENBRIDGE, each node broadcasts its incident edge states to its neighbors. Because of this, the message size of the ENBRIDGE is O(
5.3. Time, Space, and Computational Complexities
Theorem 9.
The time complexity of I-PRITCHARD is O(D).
Proof.
Since proposed improvements do no effect on time complexity, time complexity of I-PRITCHARD algorithm depends on the network diameter. Because of this, the time complexity of I-PRITCHARD is O(D).
Theorem 10.
ENBRIDGE takes Ω(D) time at the best case and O(N) time at the worst case.
Proof.
At the best case, only Phase 1 is executed, so that the time complexity of the ENBRIDGE algorithm is equal to the time complexity of the BFS operation, so that the lower bound of the time complexity is Ω(D). At the worst case, Phase 2 is executed with phase 1. In this case, the time complexity is equal to the worst case time of the DFS operation, so that the upper bound of the time complexity is O(N).
Theorem 11.
The space and computational complexities of the I-PRITCHARD algorithm is O(
Proof.
Each node should store its neighbor's state where this table can be at most O(
Theorem 12.
The space complexity of ENBRIDGE is O(
Proof.
Each node should store its 2-hop neighbor's state, so that this table can be at most O(
Theorem 13.
The computational complexity of the ENBRIDGE algorithm is O(
Proof.
At the best case, one of Rule 1, Rule 2, and Rule 3 is executed which results in the Ω(
A summary and analytical comparison of central algorithm (CENTRAL), Milic's Algorithm (MILIC), Turau's Algorithm (TURAU), Pritchard's Algorithm (PRITCHARD), I-PRITCHARD, and ENBRIDGE algorithms are given in Table 1. MILIC, I-PRITCHARD, and ENBRIDGE are asymptotically better algorithms in terms of sent and received messages. The message sizes of I-PRITCHARD and ENBRIDGE are O(
Analytical comparison of algorithms.

6. Performance Evaluations
We implemented I-PRITCHARD and ENBRIDGE algorithms in TOSSIM simulator [37] to evaluate their performance. TOSSIM simulator is developed by the researchers from University of California Berkeley, Intel Research Berkeley, and Harvard University. TOSSIM inherits the TinyOS's structure and provides a simulation environment that is close to the real world. The nesC compiler which is also currently used for the TinyOS applications is modified in order to use the same compiler for both simulation and implementation. A discrete event queue is used in the execution model. By using this queue, all simulator events are timestamped and processed in order. The hardware parts of the real-world implementations are emulated in TOSSIM. Two radio models are simulated. In the first model, the developers use error-free transmission to test the correctness of their protocols. The second model provides the developers to test the multihop transmissions.
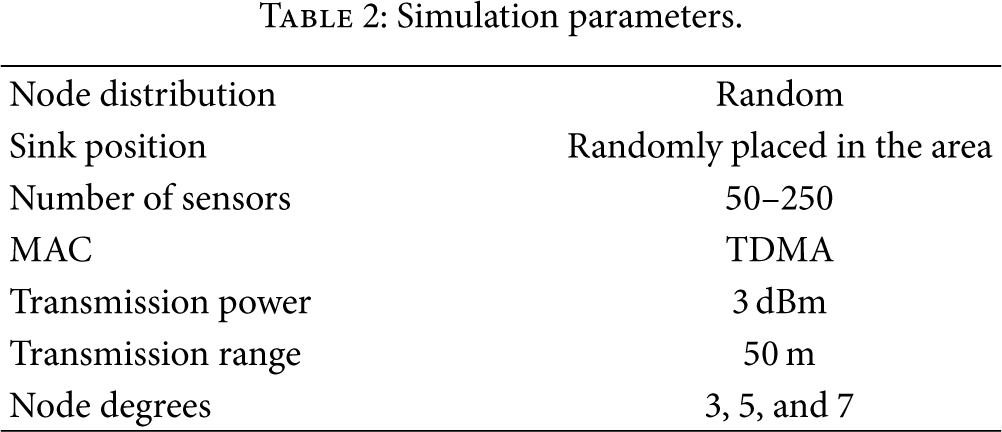
We implemented CENTRAL, MILIC, TURAU, and PRITCHARD algorithms in order to compare them with the proposed algorithms. We generated randomly connected networks varying from 50 to 250 nodes that are uniformly distributed over the sensing area. For the lower layers, we implemented a TDMA based MAC protocol, and we used the IEEE 802.15.4 physical layer. The transmission power is 3 dBm. The average degrees of the nodes in generated networks are varying between 3, 5, and 7. We measured total received bytes, total sent bytes, energy consumption, and wallclock times. Each measurement is the average of 10 repeated simulations. In each simulation, nodes are randomly placed in the area. Table 2 summarizes the simulation parameters.
Simulation parameters.
6.1. Received Byte Counts
Since radio transmitter is the dominant energy consumer of the component of the sensor node, received byte counts are important evaluation criterions. Until otherwise stated, the default node degree is 5, and the node count is 150. Total received byte counts of I-PRITCHARD and ENBRIDGE against node count and node degree are shown in Figures 5(a) and 5(b), respectively. When the node degree and node count are increased, total received byte count of both algorithms increase linearly. These results conform with theoretical analysis where the complexity of received and overheard messages is O(

(a) Received bytes of I-PRITCHARD against node degree and node count. (b) received bytes of ENBRIDGE against node degree and node count.
Performance comparisons of I-PRITCHARD, ENBRIDGE, and their counterparts are given in Figures 6(a) and 6(b). The received byte count of ENBRIDGE is the smallest, and I-PRITCHARD is the second smallest among the other algorithms. The received byte count performance order of algorithms is ENBRIDGE, I-PRITCHARD, TURAU, PRITCHARD, MILIC, and CENTRAL. These results show that BFS based approaches other than I-PRITCHARD and I-MILIC are worse than Turau's DFS based approach. I-PRITCHARD is approximately 1.7 times better than PRITCHARD on the average. ENBRIDGE is approximately 2 times better than TURAU, 3 times better than PRITCHARD, 4.5 times better than MILIC, and 6 times better than CENTRAL algorithm on the average. The reasons of this significant performance of proposed algorithms are using broadcast messages with at most O(

(a) Received bytes of algorithms against node degree. (b) Received bytes of algorithms against node count.
6.2. Sent Byte Counts
Secondly, we measured the sent byte counts to evaluate the energy consumption of the algorithms. Total sent byte counts of I-PRITCHARD and ENBRIDGE against node count and node degree are shown in Figures 7(a) and 7(b), respectively. Total received byte count values fluctuate between similar values when the node degree and node count are increased. These results show that I-PRITCHARD and ENBRIDGE are stable and scalable against varying node degrees and node counts.

(a) Sent bytes of I-PRITCHARD against node degree and node count. (b) Sent bytes of ENBRIDGE against node degree and node count.
Total sent byte counts of I-PRITCHARD, ENBRIDGE, and their counterparts are given in Figures 8(a) and 8(b). The sent byte counts of ENBRIDGE are the smallest, and those of I-PRITCHARD are the second smallest among the other algorithms similar to the received byte count performance. The sent byte count performance order of algorithms is ENBRIDGE, I-PRITCHARD, TURAU, PRITCHARD, MILIC, and CENTRAL. The sent byte count of I-PRITCHARD approximately is 1.7 times smaller than PRITCHARD on the average. ENBRIDGE is approximately 1.8 times better than PRITCHARD, 3.6 times better than MILIC, 4.5 times better than MILIC, and 8 times better than CENTRAL algorithm on the average.

(a) Sent bytes of algorithms against node degree. (b) Sent bytes of algorithms against node count.
6.3. Energy Consumption
Energy efficiency is one of the most important objective for WSN. We measured the energy consumption of the distributed bridge detection algorithms. We assumed that the energy consumption occur mostly by message transfers. Energy consumptions of I-PRITCHARD and ENBRIDGE against node count and node degree are shown in Figures 9(a) and 9(b), respectively. Energy consumptions increase linearly when the node degree and node count are increased. These results show that the energy consumption of I-PRITCHARD and ENBRIDGE are stable and scalable against varying node degrees and node counts.
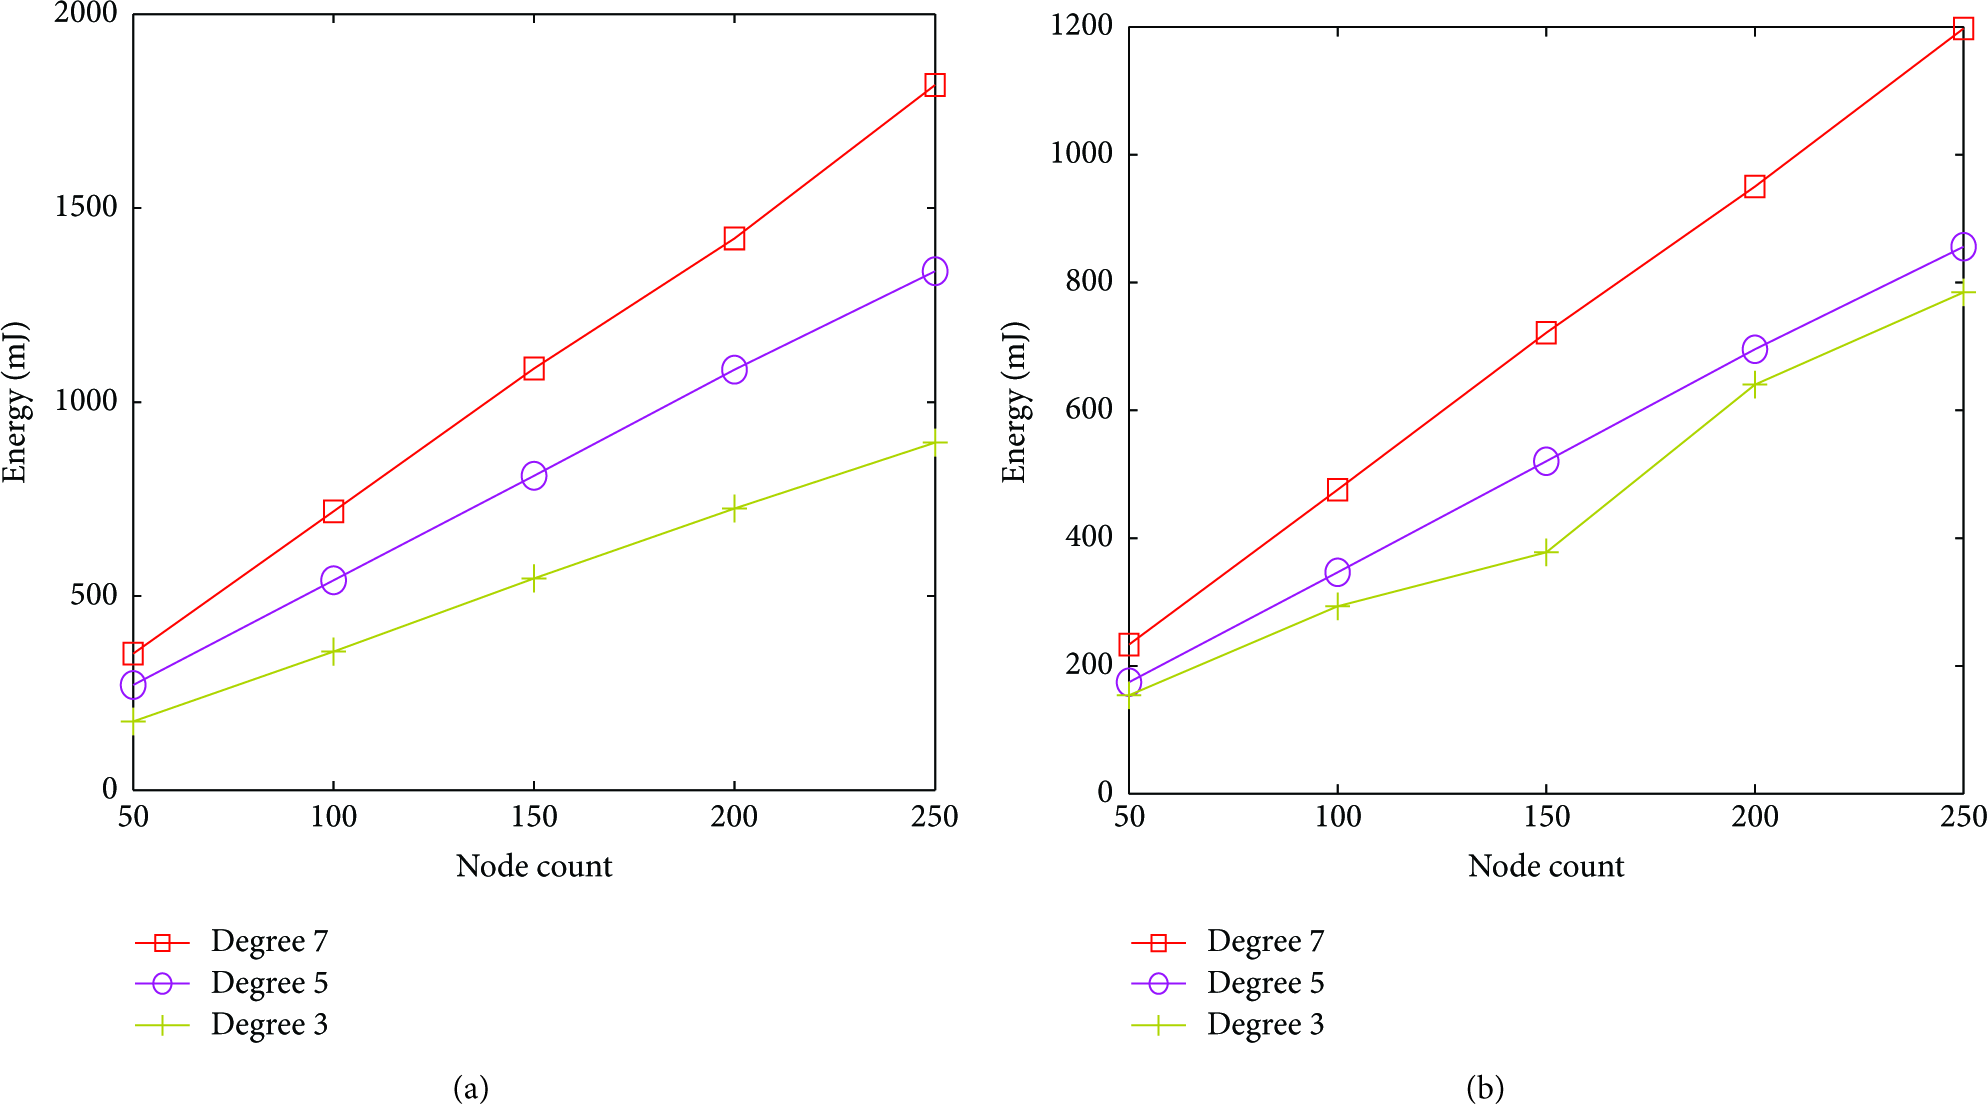
(a) Energy consumption of I-PRITCHARD against node degree and node count. (b) Energy consumption of ENBRIDGE against node degree and node count.
Performance comparisons of I-PRITCHARD, ENBRIDGE, and their counterparts are given in Figures 10(a) and 10(b). The ENBRIDGE algorithm consumes 3.4 mJ per node, and it has the best performance. The I-PRITCHARD algorithm consumes 5.3 mJ per node, and it has the second performance among the other algorithms. I-PRITCHARD consumes 1.7 times less energy than PRITCHARD algorithm. The energy consumption performance order of algorithms is ENBRIDGE, I-PRITCHARD, TURAU, PRITCHARD, MILIC, and CENTRAL. The energy consumption of ENBRIDGE is approximately 1.6 times better than TURAU, 2.6 times better than PRITCHARD, 4.3 times better than MILIC, and 6.5 times better than CENTRAL algorithm. This is a significant improvement over battery-powered sensor nodes in order to maximize the network lifetime.
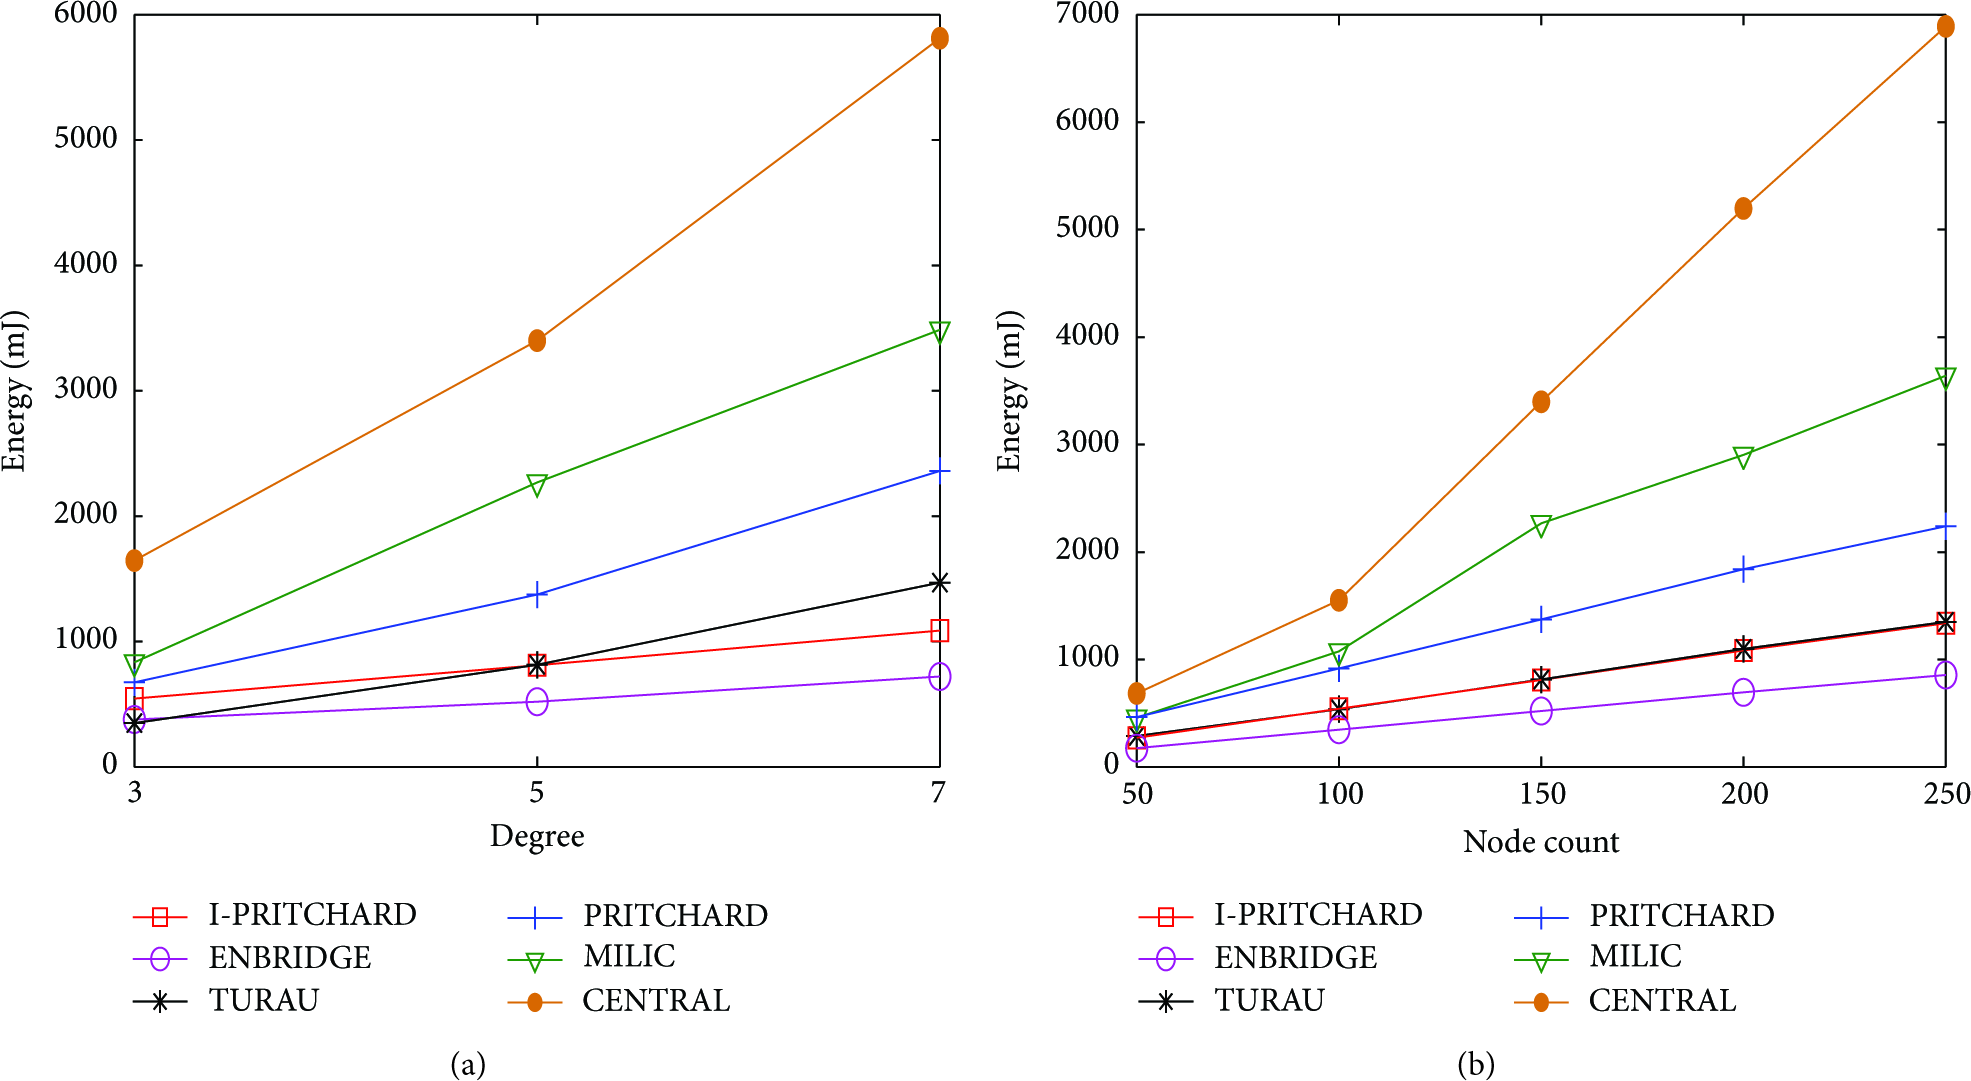
(a) Energy consumption of algorithms against node degree. (b) Energy consumption of algorithms against node count.
6.4. Wallclock Times
Lastly, we measured the wallclock times of the distributed bridge detection algorithms. Firstly, we measured the wallclock times of I-PRITCHARD and ENBRIDGE algorithms against node count and node degree which are shown in Figures 11(a) and 11(b), respectively. Since the network diameter decreases when the degree increases, the wallclock times of both algorithms decrease. A sharp increase in the wallclock time of ENBRIDGE algorithm can be observed in Figure 11(b) when the node count is 150 and the degree is 3. The reason of this sharp increase is the fact that for especially sparse networks, ENBRIDGE runs both of the phases. Since the second phase is improved DFS based cut bridge detection, time consumption increases.

(a) Wallclock times of I-PRITCHARD against node degree and node count. (b) Wallclock times of ENBRIDGE against node degree and node count.
Wallclock times of I-PRITCHARD, ENBRIDGE, and their counterparts are given in Figures 12(a) and 12(a). The wallclock times of ENBRIDGE are the smallest, and those of I-PRITCHARD are the second smallest among the other algorithms. TURAU has the worst performance since it is DFS based and uses unicast for the message transmission. I-PRITCHARD is better than PRITCHARD in all cases since its phase count is 1 less. MILIC algorithm performs well for most of the cases. Although the performance of the ENBRIDGE is not good for some cases as explained in the previous paragraph, the algorithm performs best among other algorithms on the average since it completes its operation within a BFS session in most of the simulations.

Wallclock times of algorithms against node degree. (b) Wallclock times of algorithms against node count.
In this section, we showed that our analytical results given in Section 5 conform with the simulations results that ENBRIDGE and I-PRITCHARD outperform the previously proposed approaches in terms of energy and time consumptions.
7. Conclusions
We proposed two distributed energy-efficient bridge detection algorithms I-PRITCHARD and ENBRIDGE. Our first algorithm, is the improved version of the Pritchard's algorithm. In this algorithm, we merged two phases into a single phase which leads to the removal of a downcast operation. Besides, we used radio broadcast communication instead of unicast message transfer that leads to the reduction of message header transmissions. The original idea of the second algorithm is to process proposed rules on 2-hop neighborhood information during a BFS session in order to detect bridges and classify all edges. With the help of these methods, our algorithms have O(N) sent message complexity, O(
We showed the detailed design of the proposed algorithms with example operations. We analyzed the proof of correctness, message complexity, time complexity, space complexity, and computational complexity and compared them with the previous work. We implemented the algorithm on TOSSIM environment with its counterparts. From our extensive simulations, we showed that the received and sent byte counts of I-PRITCHARD are always less than PRITCHARD. Besides, I-PRITCHARD consumes less energy and time than PRITCHARD in all simulation steps. These simulation results conform with the theoretical analysis and show that I-PRITCHARD improves PRITCHARD both theoretically and practically. Our second designed algorithm, ENBRIDGE, has the best simulation performance in terms of received byte count, sent byte count, energy consumption, and wallclock times. The energy savings of ENBRIDGE algorithm when compared to the other approaches are between 1.6 and 4.3. This is a significant improvement for energy-efficient bridge detection in sensor networks in order to detect weak points of the network and to prevent possible faults.