
Abstract
The effects of the codeposition ions on structural and tribological properties of electro-brush plated coatings were investigated. The microstructure and phase structure were studied with scanning electron microscope (SEM), X-ray photoelectron spectroscopy (XPS), and X-ray diffraction (XRD). The hardness and tribological properties of several coatings with different kind of codeposition ions were studied. Results show that among the coatings with different FeCl2 contents in electrolyte, the Fe400 coating has the best surface property. When proper chemical ion W codeposited with iron ion is added, the hardness of the coatings is improved obviously and the Fe-WII coating has the best properties. When proper element of Cu is added, the hardness and tribological properties of the Fe-W-Cu coatings are also improved. Besides, the interface bond strength between the coating and the substrate is improved obviously, and the Fe-W-CuII coating has the best properties.
1. Introduction
Various surface techniques are applied on different alloys to improve the wear resistance of the appearance [1–5]. Among them, the electro-brush plating technology is an important issue of surface engineering [6–11]. However, the application of iron-based brush plating is limited for its disadvantages, such as high residual stress and brittleness of the coatings, which should be further improved [10–13].
In this paper, based upon the iron-based electro-brush plating technology, different kinds of codeposition ions were added in the bath, and the effects of the codeposition ions on structural and tribological properties of electro-brush plated coating on steel GCr15 were investigated.
2. Experimental
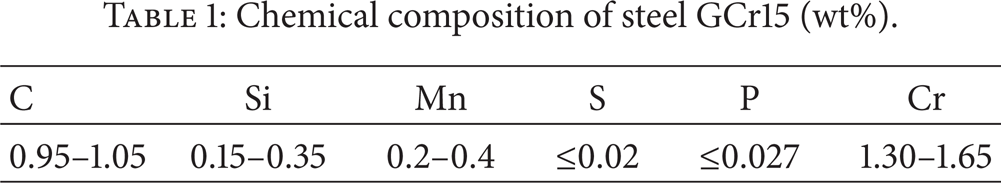
The chemical composition of steel GCr15 used in the present investigation is shown in Table 1. Test specimen (Φ18 × 8 mm) surfaces were successively polished by using waterproof abrasive paper 80#, 320#, 1000#, 2000#, and then immersed in acetone solution, and cleaned in the SK3300H ultrasonic cleaner for 5 minutes. Electro-brush plating was then carried out at ambient temperature (about 25°C) and velocity of 6 m/min~12 m/min for 10 min. The electro-brush plating was conducted in the following steps: electrical cleaning → activation → preplating → plating, and the potentials for the above four steps of the electro-brush plating were about +12 V, −12 V, +18 V, and +10 V, respectively. The current density for plating was about 10 A.
Chemical composition of steel GCr15 (wt%).
Surface micrographs, compositions, and microstructures of the test specimens were observed by scanning electron microscopy (SEM, FEI Quant200), electron energy dispersive spectroscopy (EDS, EDAX), X-ray photoelectron spectroscopy (XPS, K-Alpha), and X-ray diffraction (XRD, X-Pert-Pro). The microhardness of coating was examined by HVS 1000 sclerometer with load fixed at 25 g and load time fixed at 10 s, and the average value of five test data was adopted. Friction and wear tests were measured in a block-on-ring test (M-2000 A) with coated blocks (40 × 40 × 10 mm) and SiC cement ring (Φ50 × 10 mm) under the applied loads of 100 N at room temperature. The lubrication oil was liquid paraffin, and the rotate speed was 200 rpm during the test. The wear time was 10 min, and the variation of friction coefficient with sliding time was recorded automatically.
3. Results and Discussions
The SEM photographs of coatings electro-brush plated with different FeCl2 contents in electrolyte are given in Figure 1. It can be seen that coatings are all showing the typical cluster crystal with cauliflower shape, where every cluster crystal is composed of many small crystal cells. Figure 1(a) shows that when the content of FeCl2 in electrolyte is 250 g/L (namely, the coating is of Fe250), the cluster crystals are uneven and there are some air hole can be seen. Figure 1(b) shows that when the content of FeCl2 in electrolyte is 400 g/L (namely, the coating is of Fe400), the cluster crystals are fine and compact; no air hole can be seen. When the content of FeCl2 is 550 g/L (namely, the coating is of Fe550), the cluster crystals become very rough (Figure 1(c)). It is concluded that the Fe400 coating has the best surface property. So the content of FeCl2 in electrolyte as 400 g/L was chosen in the further studies.
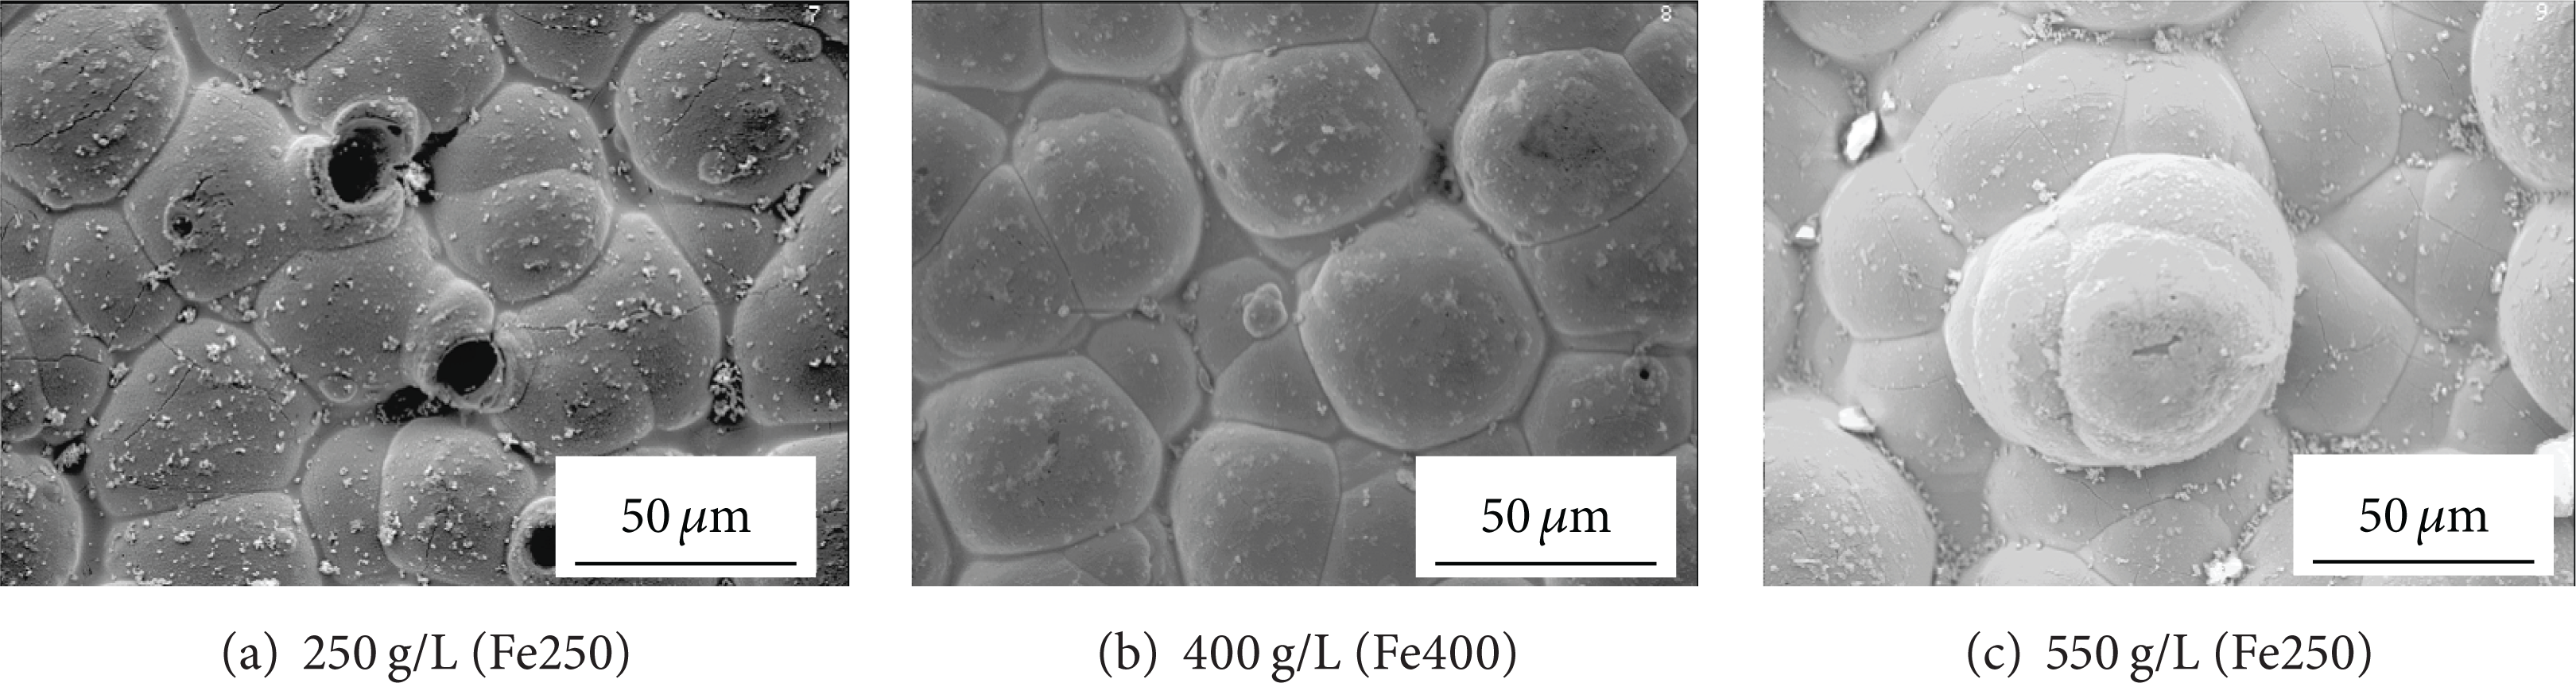
SEM photographs of coatings with different FeCl2 contents in electrolyte.
Three Fe-W coatings were made by adding different contents of W ion codeposited with iron ion in the 400 g/L FeCl2 electrolyte, where different content of Na2WO4 was used. The SEM photographs of Fe-W coatings with different W ion contents are given in Figure 2. The EDS results of Fe-W coatings are shown in Table 2. The XRD patterns of specimens with different Fe-W coatings are shown in Figure 3. The microhardness of Fe-W coatings is given in Figure 4.
W contents for Fe-W coatings (wt%).


SEM photographs of Fe-W coatings with different W ion contents in electrolyte.

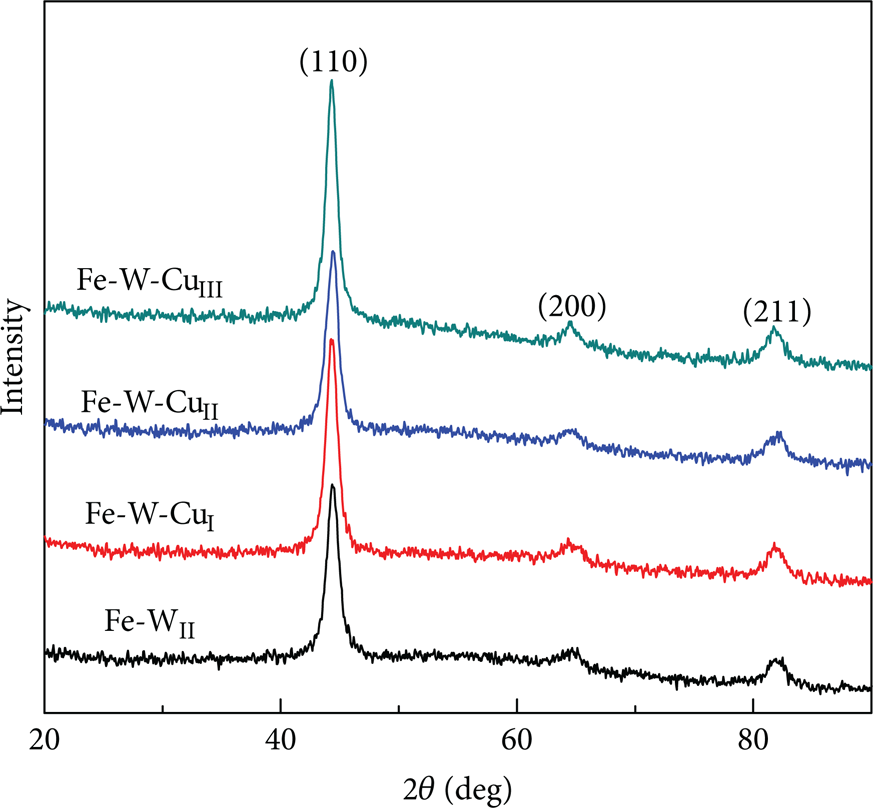
XRD of Fe-W coatings.

Microhardness of Fe-W coatings.
Figure 2 shows that Fe-W coatings are also showing cluster crystal with cauliflower shape; however, the cluster crystals are small and there is much clearance between the crystals. For Fe-WIII coating, more clearance between the crystals and the coating is very loose. The EDS tests show that the W contents for the Fe-WI, Fe-WII, and Fe-WIII coatings are about 5.85%, 6.98%, and 8.73%, respectively.
From the results of XRD (Figure 3), it can be seen that only the diffract peak of α-Fe appeared for the four coatings. It suggests that the metallography structure of Fe-W alloy coatings is of α-Fe.
From Figure 4, it can be seen that the microhardness of Fe-W coatings are all above 600 HV, obviously higher than the one of Fe400 coating which is about 577 HV, and that the best one is the Fe-WII coating, which reaches up to 663 HV, indicating that the hardness of the coatings was improved obviously when the chemical ion W codeposited with iron ion was added.
The Fe-W-Cu coatings were made by adding the CuCl2·4H2O in the Fe-W electrolyte. The SEM photographs of Fe-W-Cu coatings with different Cu ion contents in electrolyte are given in Figure 5. The EDS results of Fe-W-Cu coatings are shown in Table 3. Results of XRD for the Fe-W-Cu coatings with different contents of Cu ion are shown in Figure 6. To further indicate the existing states of W and Cu in the coatings, the XPS tests were carried out and the results are shown in Figure 7. Microhardness and friction coefficient of Fe-W-Cu coatings are given in Figures 8 and 9, respectively.
Cu contents for Fe-W-Cu coatings (wt%).


SEM photographs of Fe-W-Cu coatings with different Cu ion contents in electrolyte.
XRD of Fe-W-Cu coatings.

XPS high-resolution spectra of W and Cu in Fe-W-Cu coating.
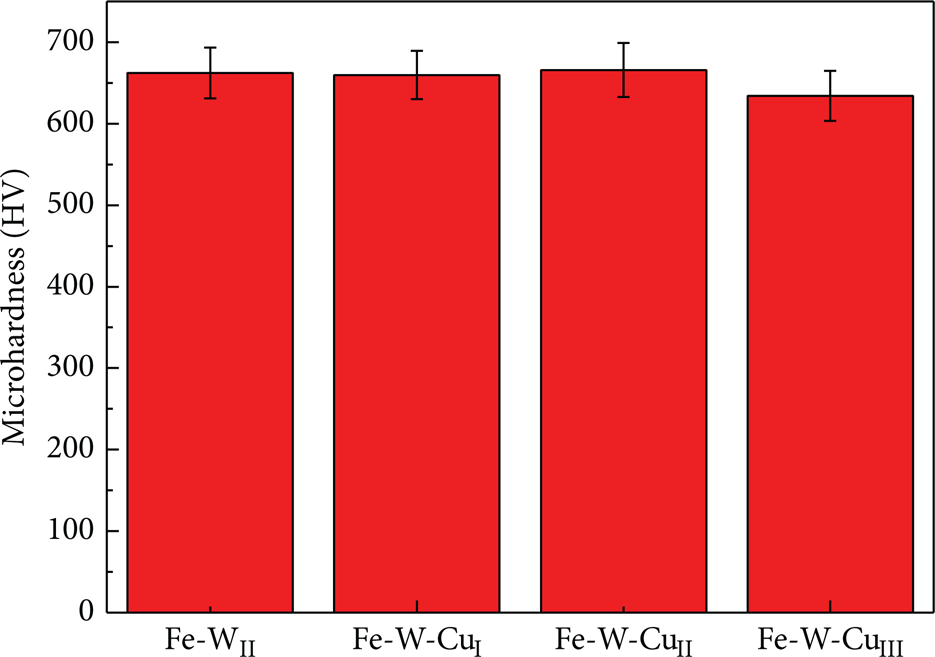
Microhardness of Fe-W-Cu coatings.

Friction coefficient of Fe-W-Cu coatings.
Figure 5(a) shows that the surface of structural and abrasion properties of Fe-W-CuI coating is uneven, and there are some lacunas that can be found. Figure 5(b) shows that the surface of Fe-W-CuII coating is fine and compact; there are few lacunas that can be seen. From Figure 5(c), it can be seen that the Fe-W-CuIII coating is composed of many small granules and the granules are uniform and even. Table 3 shows that the Cu contents for the Fe-W-CuI, Fe-W-CuII, and Fe-W-CuIII coatings are about 4.20%, 5.12%, and 10.16%, respectively.
From the results of XRD (Figure 6), it can be seen that only the diffract peak of α-Fe appeared for the four coatings. It suggests that the metallography structure of Fe-W-Cu coatings is also of α-Fe.
The XPS results (Figure 7) indicate constituent peaks of the Fe-W-Cu coating. As shown in Figure 7(a), the W 4f peaks are measured elaborately. It is corresponding to W4+ and W indicating that the coating consisted of WO2 and elementary W. In Figure 7(b), it can be seen that the Cu 2p peaks are measured. The binding energy of these peaks is corresponding to Cu2+, Cu1+, and Cu indicating that the coating consisted of CuO, CuO2, and elementary Cu.
From Figure 8, it can be seen that the microhardness of Fe-WII and all the Fe-W-Cu coatings is above 600 HV. It indicates that the hardness of the Fe-W-Cu coatings was also improved.
In Figure 9, it can be seen that the friction coefficients of Fe-W-Cu coatings are all lower than the one of the Fe-WII coating which indicates that the Cu element is helpful to reduce the friction coefficient of the coating and the Fe-W-CuII coating has the lowest friction coefficient. The EDS results show that the Cu content increases on the worn surface. It can be concluded that the antifriction mechanism is the segregation of Cu element at the interface between the friction pair during the friction process.
The SEM photographs of coating sections after corrosion are given in Figure 10. It is seen that the thickness of Fe-W-coating layers is about 120 μm (Figures 10(a)–10(c)). There are some air holes in Fe-WI and Fe-WIII coatings whereas the Fe-WII coating is fine and compact, and the border between the coating and the substance is good showing a nice link between them. It indicates that the Fe-WII coating has the best properties. The thickness of Fe-W-Cu-coating layers is about 100 μm (Figures 10(d)–10(f)), and there are also some lacunas in the Fe-W-CuI and Fe-W-CuIII coatings; however, they are much better than the Fe-WI and Fe-WIII coatings. As for the Fe-W-CuII coating, it is very fine and compact, and the border between the coating and the substance is perfect, showing a very good link of them. From the results, we may conclude that the interface bond strength between the coating and the substrate is improved obviously when the element of Cu was added.

SEM photographs of coating sections.
4. Conclusions
The Fe400 coating has the best surface property among the coatings with different FeCl2 contents in electrolyte. The hardness of the coatings is improved obviously when proper chemical ion W codeposited with iron ion is added. When proper element of Cu is added, the hardness and tribological properties of the coatings are also improved, and the interface bond strength between the coating and the substrate is improved obviously for the Fe-W-Cu coatings.
Footnotes
Acknowledgments
This work is financially supported by the National Basic Research Program of China (973 Program) (no. 2011CB013404), the National Natural Science Foundation of China (nos. 51275105, 51375106), and the Foundation of Heilongjiang (nos. QC2010108, E201026).