
Abstract
A numerical code with an elastic-brittle failure model has been developed to simulate the seismic activities in rock failure problems. The feasibility in principle of monitoring and prediction of rock failure was numerically simulated. The heterogeneity was considered to be the main reason for the existence of slope failure precursors. Seismic events could be observed in heterogeneous rock, whereas the homogeneous rocks showed an abrupt fracture mode without any early seismic precursors. The failure process of a slope was numerically investigated by using a gravity increase method (centrifugal loading method), and the application of the microseismic monitoring system in the slope was introduced. The numerical results showed that the fracture of the main faults caused the slope slide, and the microcracking caused by the heterogeneity in the faults prior to the landslide could be considered as the precursors of the slope failure, which were captured by the microseismic monitoring system. The microseismic monitoring technique was proved to be successful in predicting the failure in the slope, and the numerical results will be helpful in interpreting the microseismic monitoring results.
1. Introduction
Microseismic monitoring technique has been used to predict rock burst in mining engineering for many years. Rock burst is a catastrophic phenomenon triggered by a progressive failure process of rocks, which has extremely complex mechanical mechanisms. The present studies are mostly based on hypotheses or experiences. Hoek and Brown also pointed out that this type of progressive failure process was still not clearly understood up to now [1]. At present, many rock burst theories were proposed, using mainly the strength theory, the energy theory, the burst liability theory, the stiffness theory, and the instability theory. Unfortunately, although all of these methods have been used, none is proved to be adequately reliable, and almost no successful application has been reported.
In recent years, many monitoring sensors have been widely used in civil engineering [2, 3] and microseismic monitoring technique has been developed rapidly and widely used to capture the microcracking in underground tunnel engineering and mining engineering [4–6]. The microseismic monitoring technique can be used to obtain the time, location, and magnitude by acoustic analysis. Currently, advanced rock burst monitoring network systems have been established for many deep mines in Canada, the United States, South Africa, and Australia. In China, many sets of monitoring equipment were imported by a few large coal mines and metal mines to monitor rock burst hazards.
Similar to rock burst problems, slope instability and landslides have always been one of the most significant subjects of slope engineering. How to monitor and predict rock slope failure hazards has been one of the hottest topics in rock engineering in recent years. Successful application of microseismic monitoring on rock slope failure prediction has not been found up to now.
With the rapid development of the deep mines and particularly large hydroelectric projects in southwest China, rock slope failure seems to be the most challenging problem. In these large hydroelectric projects, the rock slopes are often characterized by deep cracks and faults, high stress levels, intense weathering, unloading fractures, and so forth. Extensive use of the new measurement techniques and the traditional techniques, such as Global Positioning System (GPS), Synthetic Aperture Radar (SAR) Interferometry, Time Domain Reflect meter (TDR), multiple position extensometers, convergence meters, and surface subsidence monitoring, is currently found to be very useful in surface deformation monitoring of civil engineering [7–12]. However, it is unrealistic for them to effectively monitor the occurrence of microcracking in deep rock masses prior to the formation of a macroscopic rock fracture outside slope surface [13–16].
It is well known that rock slopes have smaller deformation before slip failure than soil slopes. Rock slope failure often happens in a more abrupt way, which is hard to be captured by surface deformation monitoring techniques. Microseismic monitoring technique seems to be a better way to capture the internal microcracking, which may often cause macroslide of rock slopes gradually.
Rocks loaded in testing machine and rock masses that are stressed near underground excavations emit detectable acoustic or seismic signals. If these signals can be captured sufficiently clearly as seismograms by a number of sensors nearby, the origin time of seismic events, their location, and other source parameters such as source radius, static stress drop, dynamic stress drop, and apparent stress can be estimated. In rock engineering practice, the microcracking or microfracturing can be located by microseismic monitoring system, and the local damage can be determined by analyzing the time of seismic events, magnitude of energy release, and the stress drop. The damage zone and the parameters of seismic events can be employed to predict rock slope failure.
However, the results of microseismic monitoring can only provide information of stress drop and seismic energy. How to utilize this seismic information becomes much significant in rock slope failure analysis. Therefore, a proper model revealing the relation between damage evolution and stress variation, such as the phenomena of stress buildup, stress shadow, and stress transfer, is helpful for rock slope failure prediction.
In order to understand the failure mechanism of rock engineering structures, numerical methods, such as the FEM, boundary element method (BEM), and discrete element method (DEM), have been developed, and they have become increasingly popular for the stability analysis of the structures. It has been shown that the numerical methods have a number of advantages over the traditional limit equilibrium approaches for stability analysis of rock engineering. Most importantly, the critical failure surface can be found automatically. Nevertheless, the currently widely accepted numerical methods do not take into account the heterogeneity of rock masses at macroscopic levels under complicated geological conditions. The heterogeneity plays an important role in determining the fracture paths and fracture patterns of rock masses [13].
In this study, the microseismic monitoring technique and a numerical code RFPA3D with an elastic-brittle constitutive law were applied to the right slope stability analysis of Dagangshan Hydropower Station. The influence of the heterogeneity on seismic events was simulated by a numerical model to discuss the feasibility of slope failure prediction by using microseismic monitoring.
2. Numerical Modelling
2.1. Mesh Generation and the Heterogeneity Index
As shown in Figure 1, the model in RFPA3D is meshed into brick elements with randomly distributed mechanical properties. When a heterogeneous material is simulated, disorder should be implemented. In the lattice model, all elements of the mesh have different lengths and different stiffness. In order to deal with real random microstructures in numerical simulation, rock heterogeneity can be characterized better with statistical approaches. In RFPA3D, since the numerical specimens consist of the elements of the same shape and size, there is no priority geometrically in any orientation in the specimen. Disorder can be obtained by means of random distributions of the mechanical properties of the elements. The statistical distribution of elastic modulus can be described by Weibull distribution function (1), even distribution function (2), or normal distribution function (3) as follows:


Mesh generation in RFPA3D. Heterogeneity is introduced into the numerical specimen by following a statistical distribution. However, the mechanical properties in each element are homogeneous.
In these equations, x can be the elemental mechanical parameter, such as uniaxial compressive strength, elastic modulus, Poisson's ratio, or specific weight. The parameters a and b in (1) are the minimal value and the maximal value of x, respectively, and in (3),
In Figure 1, the gray color represents the value of the parameters relatively. Even though mechanical parameters in each element are different from each other, which make the specimen heterogeneous, the mechanical properties throughout a single element are assumed to be homogeneously distributed. It should be noted that the elemental mechanical parameters, such as uniaxial compressive strength, elastic modulus, Poisson's ratio, and weight, are distributed throughout the specimen independently.
2.2. Constitutive Law
The elastic modulus of the damaged element is defined as follows:

It was assumed that each element may fail in either tensile failure mode or shear failure mode. If the elemental stress state satisfies both the tensile failure criterion and shear failure criterion, the tensile failure mode takes the higher priority. Figure 2 shows the elemental stress-strain relation for the two failure modes. If the element is subjected to uniaxial tensile stress, before the tensile stress (the minimal principal stress) of the element reaches its tensile strength, the element keeps linear elastic. When the minimal principal stress increases beyond the tensile strength, the element fails and the elastic modulus changes to a small value and its strength falls to residual tensile strength. When the tensile strain increases to a more large value, the strength of the element falls to a much smaller value that can be ignored approximately, which we can call the ultimate tensile strength, and the element loses its capability of loading. Accordingly, the element keeps linear elastic before the uniaxial compressive stress reaches the uniaxial compressive strength. When the elemental stress meets the shear failure criterion, the element will damage gradually.

The stress-strain relation of the element for two different failure modes.
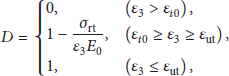
The damage variable D can be described as follows when the element is subjected to uniaxial tension:
The damage evolution function mentioned above only considers the tensile failure mode of the mesoscopic elements. Compressive softening induced by shear damage at mesoscopic level is also assumed to exist when the mesoscopic element is under compressive and shear stress. In shear failure mode, the damage variable D can be described as follows:

2.3. Failure Criterion
One of the basic goals of rock mechanics has been to provide useful methods for predicting failure strength and associated parameters. In three-dimensional studies, the traditional Mohr-Coulomb strength criterion or Hoek-Brown strength criterion is not valid any longer since the effect of intermediate principal stress is not taken into consideration. The strength increases considerably in excess of its corresponding value for standard triaxial tests with an increasing value of the intermediate principal stress. The Drucker-Prager strength criterion and unified strength criterion proposed by Yu [17], which consider all of the three principal stresses, are also provided in RFPA3D. The criterions mentioned above are all of shear failure criterions, and the tensile failure is not considered. As we know, many fractures are induced by tensile stress and even some shear failures are found in shear zones. Therefore, the maximal tension strength criterion is introduced into the shear failure criterions in RFPA3D. The Mohr-Coulomb strength criterion with tension cutoff is incorporated into the model as follows:

The Drucker-Prager strength criterion with tension cutoff can be described as follows:


2.4. Microseismic Events and Energy
It is assumed that the number of microseismic events or acoustic emission (AE) is proportional to the number of failure elements. Thus, by recording the counts of failed elements, the microseismic events associated with the progressive failure process can be simulated. Therefore, as an approximation, it is assumed that the strain energy released by damaged elements is all in the form of the microseismic events:


By using a three-dimensional graphic library, OpenGL, each microseismic event can be presented as a 3D ball in the postprocessing picture. Two different colors are selected to draw the balls to distinguish the failure modes of each element subjected to stresses.
2.5. Gravity Increase Method
In order to solve the stability problem related to rock engineering structures, the fundamental principle of gravity increase method (GIM) is introduced into the RFPA. The code considers the deformation of a heterogeneous material containing randomly distributed microfractures. As loads are applied, the fractures will grow, interact, and coalesce, resulting in nonlinear rock behavior and formation of macroscopic fractures. The codes not only satisfy the global equilibrium, strain-consistent, and nonlinear constitutive relationship of rock and soil materials but also take into account the heterogeneous characteristics of materials at microscopic and macroscopic levels. The code has been successfully applied in failure process analysis of rock material. For the RFPA-GIM, the critical failure surface of slopes is obtained by gradually increasing the gravity while keeping material properties constant. In the RFPA-GIM, the gravitation of the elements increases linearly. For each loading step, there is a corresponding trial gravitational acceleration. Referring to the definition of factor of safety in the finite element strength reduction technique, the safety repertory factor F is defined as the ratio of the element gravitation in the failure state to the initial element gravitation, which can be written as follows:

In the RFPA-GIM, slope stability analysis is run with the trial gravitational acceleration until the critical failure surface in the slope is determined. Several possible techniques can be used to define slope failure, including the formation of critical failure surface and nonconvergence of the finite element solution. In the RFPA-GIM, the maximum microseismic event rate is used as the criterion of slope failure.
Monitoring microseismic event rates seems to be a good way of identifying the initiation and propagation of cracks and fractures in rocks. In quasi-brittle materials, such as rocks, the microseismic events are predominantly related to the release of elastic energy. It is assumed that if the microseismic event rate reaches the maximum value, a macroscopic failure surface forms and slope failure occurs. More details about RFPA3D can be found in [16, 18].
3. Microseismic Activity Modes
According to the homogenous degree, three basic modes of seismic activities are found: swarm shocks, fore-main-after shocks, and main shock. Figure 3 shows the microseismic events that occurred in the heterogeneous rock specimen

Plots of the microseismic events occurred in the heterogeneous rock specimen
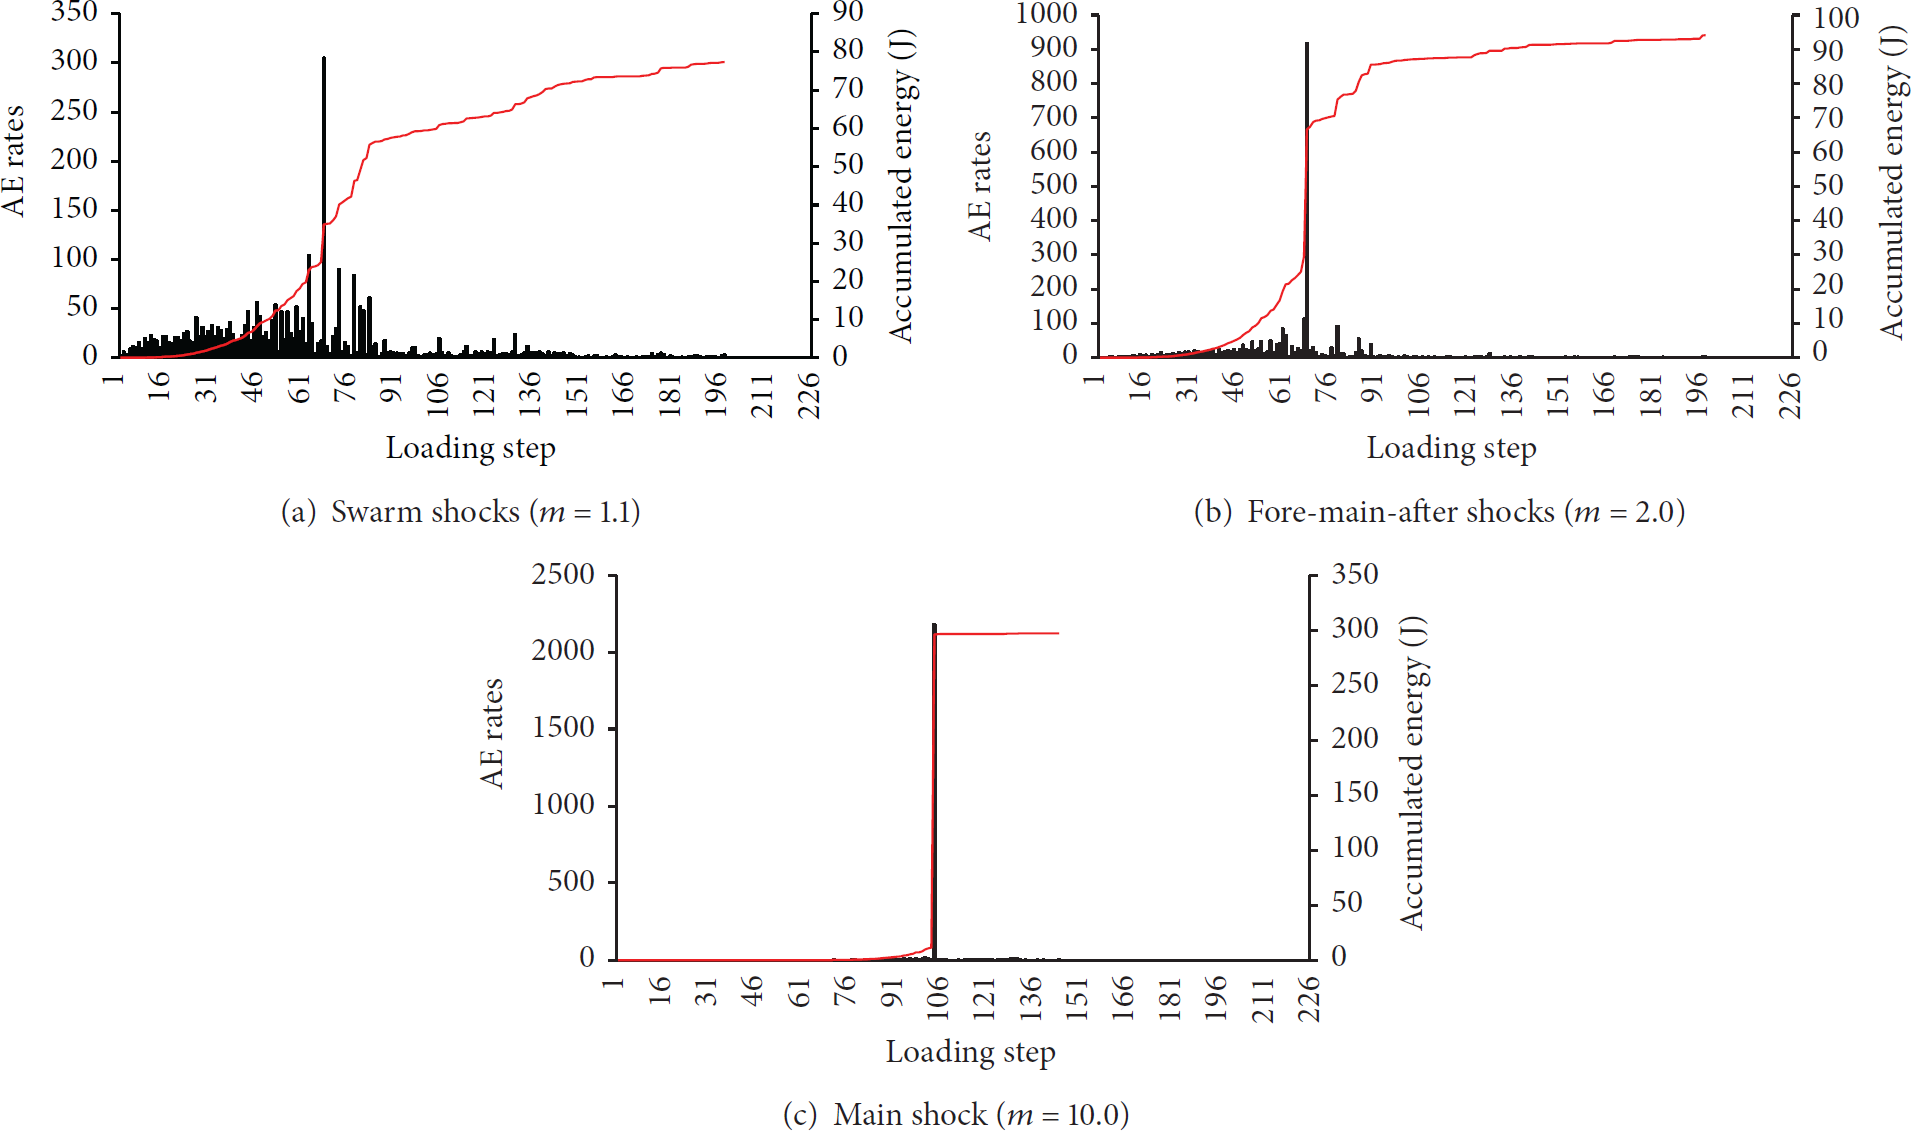
Three modes of microseismic activities in rock failure process.
4. Seismic Events Monitoring of the Right Bank Slope at Dagangshan Hydroelectric Station
Dagangshan Hydropower Station is located at Dadu River in Sichuan province in southwestern China. It is one of the largest hydroelectric power stations which are currently developed in China. It has a double-curvature dam with a maximum height of 210 m and a total installed capacity of 2,600 MW. The maximal water head is 178.0 m, the minimal water head is 156.8 m, and the standard rated water head is 160 m. The slopes at the two sides of the mountain are very high and steep with exposed bedrocks. The inclination of the right bank slope is about 40 degrees to 65 degrees, and the relative height is above 600 m. The right bank has complicated geological conditions such as faults, unloading cracks zones, and joints with cracks development. In particular, faults X316-1 and f231 are the most significant to influence the stability of the rock slope. A microseismic monitoring system was applied to capture microseismic events for slope stability analysis in June, 2010.
The microseismic monitoring systems are manufactured by the Engineering Seismology Group (ESG) in Canada. The seismic monitoring network consists of Hyperion digital signal processing system, Paladin digital signal acquisition system, and a number of uniaxial/triaxial acceleration transducers deployed in boreholes drilled from rock mass in rock slopes or tunnels. Accelerometers are connected to the Paladins acquisition system using copper twisted-pair cables. The Paladins acquisition system is connected in series to the central system using optical fiber cables and network cables. Paladin units rely on a pulse-per-second (PPS) signal that originated from the Paladin Timing Source over the network. The seismic data recorded are transmitted from the on-site center to the office by GPRS for further analysis.
The spatial layout of sensors at eleven elevations is shown in Figure 5. Totally, 22 channels and 22 sensors were distributed in the slope and an area of 600 m × 400 m × 600 m was monitored. The sensors were connected to the data acquisition units by electric cable, and the seismic events were collected and uploaded to the acquisition data server when converted to digital format by optical fiber. The digital data were transmitted to the computing center and the clients in 3D figures. The topological diagram of the ESG monitoring system is shown in Figure 6.

The layout of the sensor location in the slope.

The topological graph of the microseismic monitoring system.
The microseismic events were increased gradually when the rock slope was excavated continuously from the level 1070 m to 980 m. Figure 7 shows the evolution of the microseismic events during this period. Due to the excavation induced unloading, some microseismic events with small energy release appeared randomly distributed in the slope. More microseismic events were observed when the excavation proceeded. It could be found that the color of the balls changed from green to orange and red, which represented greater energy. When the excavation moved to 980 m, the microseismic events were distributed in a larger zone. However, most of the events were captured along the main faults (X316-1 and f231) that developed along the slope surface. The compressive stress on the faults was reduced due to the excavation upside. The tensile stress concentrated along the faults. The microseismic event locations show that hypocenters are concentrated on these excavation zones. The hypocenters follow the working faces and they are located where the excavation is carried out.

The distribution of the microseismic events in the slope during the excavation.
With the process of the shear elevation tunnel excavation, backfilling, and grouting at 1135~1240 m level, the microseismic events gradually reduced and the slope still remained stable. Actually, slope slip plane will be formed with the development of microfractures within rock mass, and the microseismic monitoring results can indicate the damage zones and then predict the potential slip plane. The monitoring results of the right bank slope, including the microseismic events and the energy loss density, showed the slope was much stable. Large external excavation, which would lead to the increase of the microseismic events and energy loss, may cause slope instability and failure.
5. Rock Slope Failure Process Analysis
The failure process of the right bank slope of Dagangshan Hydroelectric Station was simulated by the RFPA3D code. The elastic-brittle model was considered for modeling the slope failure by using the centrifuge loading method. The homogeneity index for the rock mass was set 2.0.
When the acceleration of gravity increased from 1.0 g to 1.25 g, microseismic events were observed randomly distributed in the slope. The released energy of the microseismic events at this stage was much relatively smaller. When the gravity acceleration increased to 1.50 g, more microcracking events concentrated along the fault zone. The slip plane was formed when the acceleration increased to 1.75 g. A large number of microseismic events appeared around the slip plane and deep into the slope under the left side of the slip plane. The spatial distribution of the microseismic events was shown in Figure 8.

The simulated distribution of the microseismic events by RFPA3D code.
The simulated results also revealed that most of the microcracking existed close to the faults (X316-1 and f231). The minimal principal stress, the minimal principal strain, and the damage distribution were shown in Figures 9(a), 9(b), and 9(c), respectively. When the acceleration coefficient was 1.0, the minimal principal stress (tensile stress) was observed on the upper side of the two faults where microseismic events occurred. The slip plane was formed gradually with the acceleration coefficient increasing step by step. The concentrated tensile stress along the slip plane was released when the gravity acceleration coefficient increased to 1.5. However, the compressive stress concentrated at the bottom of the slope where the stress transformation led to a great number of microseismic events. The final gravity acceleration is 1.75 g, so the safety factor of the slope is 1.75. It should be noted that the numerical model only considered the natural slope without excavation.
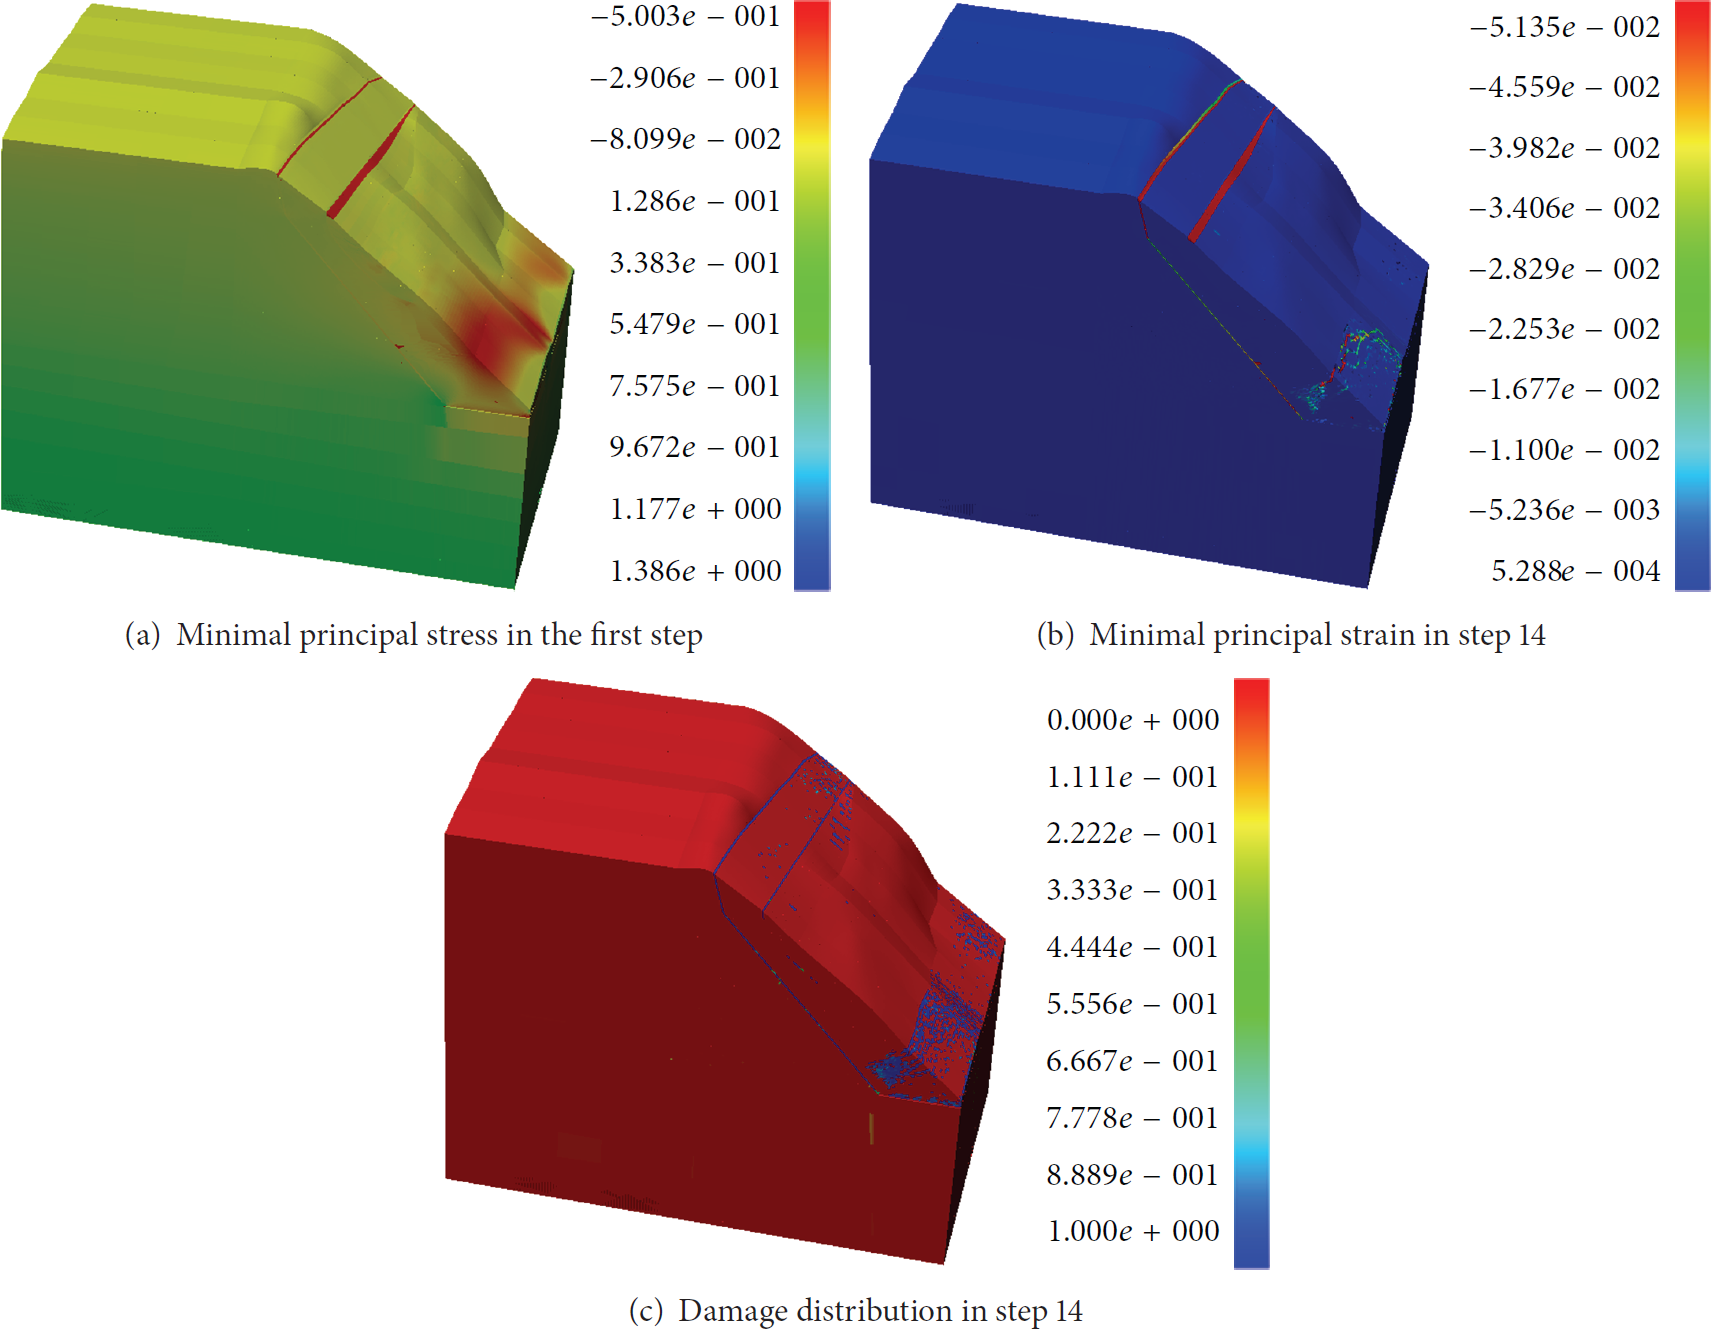
The distribution of the minimal principal stress, minimal principal strain, and the damage.
The released energy density obtained from the microseismic monitoring system was shown in Figure 10. The red zone indicated the highest energy density. It was obvious that the red zones were located near the faults and merged with each other to form a possible slip plane. The numerical results agreed well with the monitoring results.

The microseismic energy density in the slope. The red color represented the highest energy zone.
By comparison with the elastic-brittle model, an ideal elastic-plastic model was also applied in the simulation. In RFPA3D code, the residual strength coefficient was set 1.0. Because the stress would never decrease when the stresses of the elements satisfied the failure criterion, the failure of elements would never release any energy. From this point of view, the ideal elastic-plastic model in the numerical code was not reasonable for microseismic activity modelling.
6. Conclusions
The microseismic monitoring system was set up to predict the failure of the right bank slope of Dagangshan Hydroelectric Power Station, and the numerical code RFPA3D with an elastic-plastic model was applied to simulate failure process of the slope. The following conclusions can be drawn.
The heterogeneity in rocks provides the feasibility to predict the failure of rock slope. The numerical results showed that the homogeneous rock specimen demonstrated an abrupt failure mode, and no microseismic events prior to the failure could be observed. However, in the heterogeneous rock specimens, a great number of microseismic events provided the damage information, including the stress concentration and failure location. This will be helpful in predicting rock slope failure. Ideal elastic-plastic model is not reasonable for microseismic problem modelling. The stress will never be released in ideal elastic-plastic model, and no energy will be released. The application of the microseismic monitoring technique on the right bank slope of Dagangshan Hydroelectric Power Station was successful in analyzing slope stability and in predicting the failure in the slope. Rock slope failure often happens in an abrupt manner, which is hard to be captured by surface deformation monitoring techniques. Microseismic monitoring technique seems to be a better way to capture the internal microcracking, which may often result in macroslide of rock slopes gradually. The numerical results, including the stress concentration, stress release, and microfailure location in numerical model, will be helpful in explaining the microseismic monitoring results.
Footnotes
Acknowledgments
This work was supported by the National Program on Key Basic Research Project of China (973 Program) (Grant no. 2014CB047100), the National Natural Science Foundation of China (Grant nos. 51121005, 51079017, and 51274053), the Open Research Fund Program of the Key Laboratory of Safety for Geotechnical and Structural Engineering of Hubei Province, the Foundation for the Author of National Excellent Doctoral Dissertation of China (no. 200960), and the Program for New Century Excellent Talents in University (NECT-09-0253).