
Abstract
To improve the bidirectional power performance of a tidal unit, two designs were investigated. The use of unilateral or double guide vanes in a tubular tidal unit influences the performance of the hydraulic unit. Based on the N-S equations and the RNG k-ε turbulence model, the SIMPLEC algorithm was used for 3D steady-state numerical simulation of the entire turbine flow passage with unilateral and double guide vanes. The internal flow condition under positive and reverse power generation conditions was also analyzed. At the same time, the turbine, with a runner 1.6 m in diameter, was scaled down to 0.35 m diameter for model tests. The model tests were based on a multifunction hydromechanical test bench at Hohai University. The water head, discharge, and torque of the tubular turbine were, respectively, tested using a pressure difference sensor, electromagnetic flow meter, and torque meter under different guide-vane openings. The results show that turbine efficiency in the model test is slightly lower than that predicted by numerical simulation under the same conditions. However, the difference is not large. With double side guide vanes, although the efficiency of positive power generation decreased, the efficiency of reverse power generation is greatly improved.
1. Introduction
Acknowledging the looming energy crisis and global climate warming, more and more countries around the world start to invest much time and money on the clean and renewable energy [1–3]. Oceans cover approximately 71% of Earth's surface and hold a large amount of energy more than 2 × 10³ TW [4–6], which is the largest untapped renewable energy resource on the planet. The development and utilization of the usable capacity, 800 million kilowatts, would provide one-fifth the capacity of all the hydropower stations which can be developed. Therefore, the development potential of tidal power is tremendous. As renewable energy, tidal power is clean and generates no pollution. Compared with conventional hydropower stations, tidal power causes no flood losses or soil erosion, as hydroelectric power does. Construction of a tidal power station does not require immigrant workers or occupy much land. The development of tidal power shows obvious advantages, combined with comprehensive utilization projects such as enclosing tideland, aquatic breeding, and marine chemical production. At present, countries with rich tidal energy resources perform almost all the research into their development and use, including Cook's Cove in Alaska (United States), Bay of Fundy (Canada), Severn River (United Kingdom), Inchon Harbor (Korea), and others.
The tubular turbine is one of the most economical and appropriate turbine types to develop a water resource with low head, such as the tidal resource, because of its advantages of large discharge, high speed, high efficiency, wide area of high efficiency, compact structure, and simple arrangement. In the head range of H > 4 m the tubular or bulb turbines are used as commercially based type. Even in the range of about H > 1.5–2 m, the same type of turbine is applied as the extension [7]. The tubular turbine developed by Wang Zhengwei of Tsinghua University was the bulb tubular type installed in the Jiang Xia tidal power station [8, 9]. Shuhong et al. [10] modified the runner of the tubular turbine of FuJian DaGan water power station. Amelioration of the turbine was taken from the point of increasing the discharge, which increased the output of the power station. Li et al. [11] used the boundary vorticity dynamics (BVD) method to optimize the runner blade shape of a tubular turbine. The distribution of the boundary vorticity flux (BVF) [12, 13] on the runner blade surfaces was then analyzed to find where the flow behavior was defective. Compared with the bulb tubular turbine, the pit turbine shows advantages such as simple structure, convenient maintenance, and less investment. Therefore, research into new bidirectional tidal unit-pit turbines with low head, large discharge, and high efficiency is of great significance.
This paper describes the development of a new bidirectional pit turbine installed in a tidal power station with low head and large discharge. The required output is 150 kW per unit under a head of 2.5 m. The main working parameters of the prototype turbine are runner diameter 1.6 m, 3 runner blades, 15 guide-vane blades, rated head 2.5 m, highest head 3.65 m, lowest head 2.0 m, average head 2.5 m, and design flow rate 8.0 m3/s.
The flow field was calculated by CFD theory [14–16] to analyze the influence on turbine performance of unilateral and double guide vanes. Using a 1: 8 ratio, the prototype turbine was scaled down to build a model turbine for model tests. The head, discharge, and torque of the tubular turbine were tested under different guide-vane openings. Then the efficiency and output of the turbine were calculated. The results of the model tests were compared with those from numerical simulation.
2. Numerical Simulation
2.1. Geometric Model
Figure 1 shows a schematic diagram of the entire flow passage of the pit turbine with low head, large discharge, and double guide vanes. Guide vanes 1 and 2 are located on either side of the runner. Guide vane 2 was fully open in the positive power condition, and the opening of guide vane 1 was controlled to regulate the flow through the turbine. Face A was the inlet, and face B was the outlet. In the reverse power condition, guide vane 1 was fully open, and the opening of guide vane 2 was controlled to regulate the flow through the turbine. Face B was the inlet, and face A was the outlet. The calculation region for numerical simulation was the entire flow passage of the turbine, as shown in Figure 1.

Schematic diagram of the entire flow passage of a pit turbine with double guide vanes.
2.2. Turbulence Model
Assuming three-dimensional viscous flow through the turbine, the continuity equation and the Navier-Stokes [17–19] equations were used for numerical simulation as follows:

where U, p, ν, and ρ are velocity, pressure, kinematic viscosity, and density, respectively. Numerical predictions were carried out using a RNG k-ε model for turbulence [20–22]. The simulation type was steady state.
Turbulent kinetic energy equation is:
Dissipation equation is:

Eddy viscosity coefficient is:

where P k is the pressure generated caused by velocity gradient as follows:

After modeling for incompressible turbulent flow we have:
The main difference between RNG k-ε model and standard k-ε model is the correction of Cε2 of dissipation equation as follows:

where

Empirical constant values of the above formula are σ k = 0.72, σ e = 0.75, Cε1 = 1.42,Cε2 = 1.68, and Cμ1 = 0.0845.
The RNG k-ε turbulence model can obtain a more accurate description of turbulent transfer relationships with Reynolds number or vortex scale changes. Such a model can better deal with the low Reynolds-number zone near the wall.
2.3. Algorithm and Boundary Conditions
The calculation region contains the inlet passage, the guide vane parts, the runner part, and the outlet passage, in which runner is rotating domain and others are stationary domains. In this study, three-dimensional discretization was used with the finite volume method (FVM) provided by the FLUENT6.3 software. The finite volume method argued by some scientists to be the preferred numerical approach in CFD involves complex geometries [23]. For the computational domain, unstructured 3D tetrahedral meshing was employed, due to its flexibility when solving complex geometries. In order to accurately simulate the flow in a turbine passage, further mesh refinement around the blades' edges was required.
Grid-independency studies were done to prove that results do not change any further with different sizes of grids. Three sizes of grids were used for calculation as shown in Table 1. The smaller the grid size is, the larger the number of grid is. Figures 2 (a), 2 (b), and 2 (c) show the velocity contours of face x = 0 with three different grid scales. It can be seen that velocities were almost the same at a physical location x = 0 as predicted by 3 different grids. The grid-independency was verified. The grid scale 2 was chosen here. Typical CPU time required to reach the steady state for the above grid system scale 2 is about 3 hours on a 4 GB RAM, 1.6 GHz machine.
Elements' number of three grids scales.

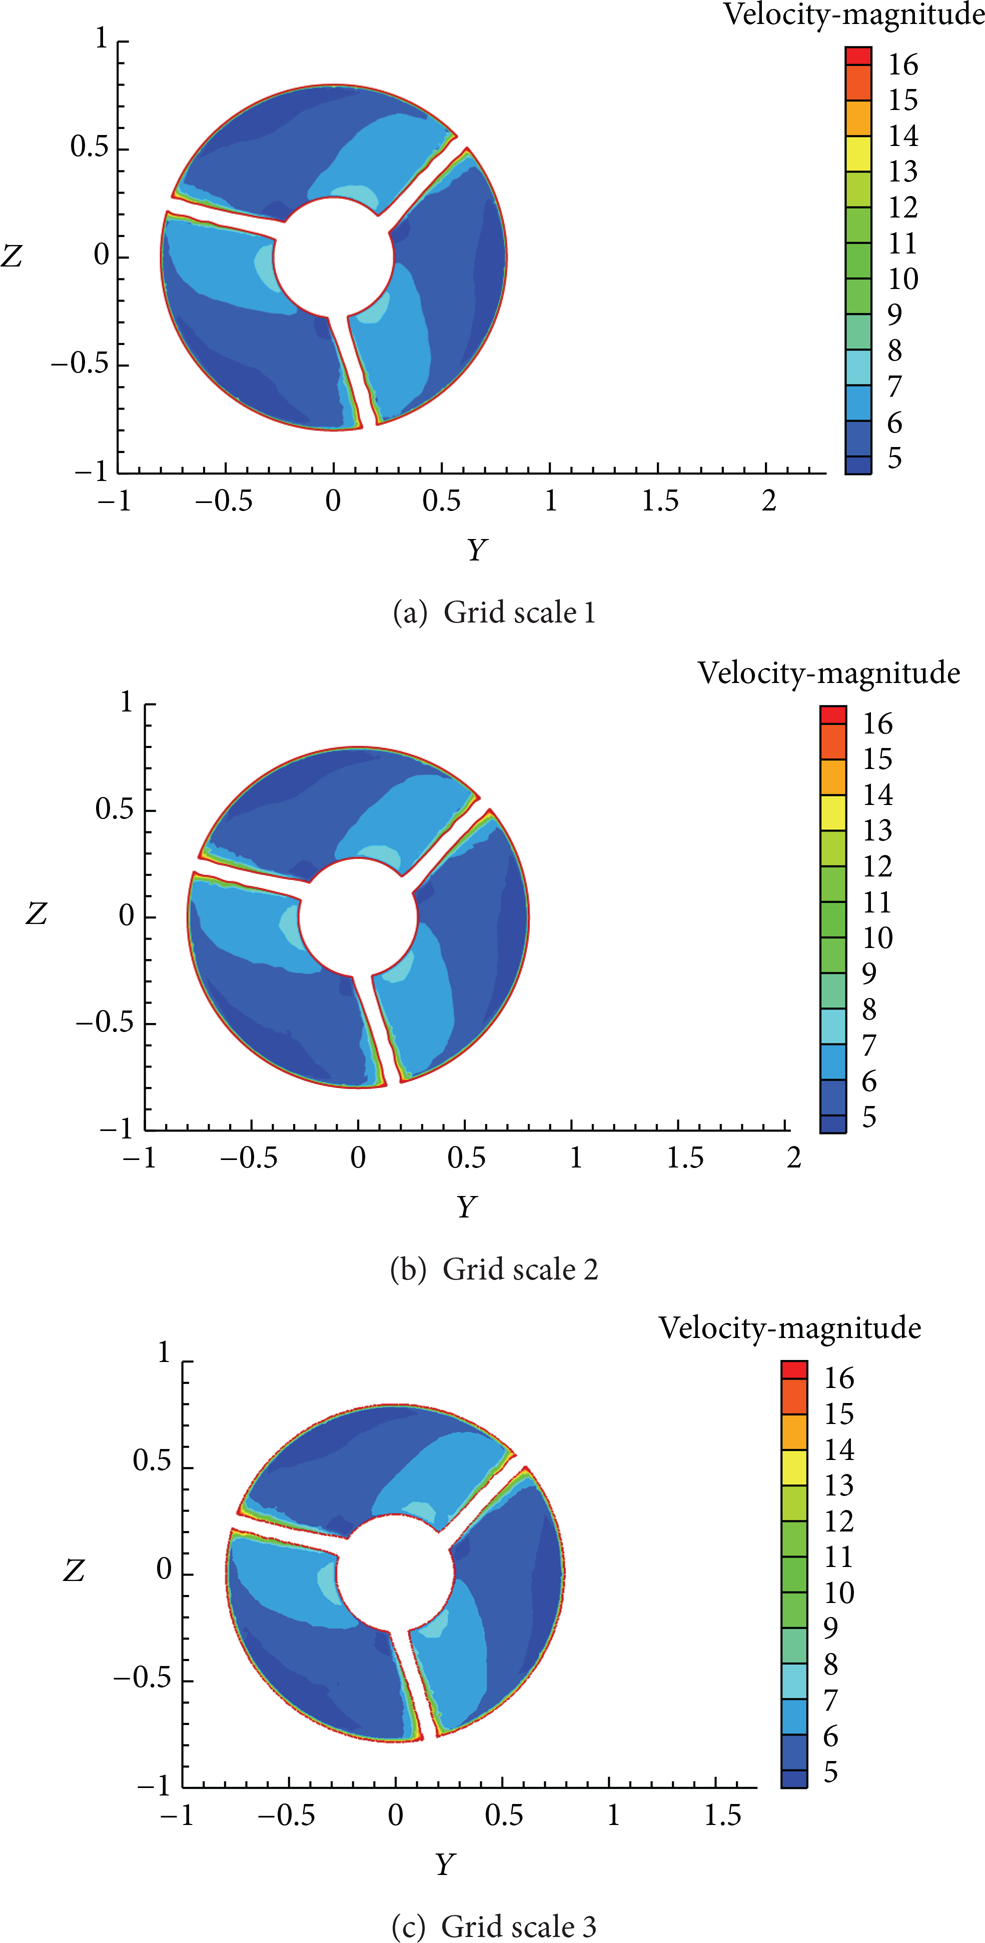
Velocity contours of face x = 0.
The numerical calculations used the segregated method with the SIMPLEC [24–26] pressure-velocity coupling algorithm. The velocity correction is entirely due to the pressure differential item of SIMPLE method. The corrected SIMPLEC algorithm shows better accuracy.
A second-order upwind [27, 28] scheme for momentum and a second-order scheme for pressure were used. For the interface unknowns, first-order upwind scheme takes values of upstream node, meaning that the ϕ of interface is considered equal to the ϕ value of a node upstream because of convection. This discrete scheme takes into account the impact of the flow direction. From the physical sense, always having a reasonable solution under any conditions will not cause oscillation solution. The discrete scheme is not limited by Pe < 2, long been widely used. A single second-order upwind equation contains not only unknown of neighbouring nodes, but also includes the unknown of other nodes next to the neighbouring nodes. Discrete equations are no longer the original tridiagonal equations. Second-order upwind scheme can be seen as a first-order upwind scheme, based on the consideration of the physical distribution curve between nodes curvature effects. In the second-order upwind scheme, in fact, just the convection term uses a second-order upwind format, while the diffusion term still uses central difference scheme. Second-order upwind scheme shows second-order accuracy. When the flow is aligned with the grid the first-order upwind discretization may be acceptable. For triangular and tetrahedral grids, since the flow is never aligned with the grid, generally more accurate results will be obtained by using the second-order discretization.
The relaxation factor was reduced for the calculation process. The relaxation factors were pressure 0.2, momentum 0.5, and turbulent viscosity 0.8. Other relaxation factors keep unchanged.
On the inlet boundary, the total pressure was specified according to the averaged water head.
Consider
in which P o is the total pressure, P s is the static pressure, ρ is the density, and V is the averaged velocity of the turbulent flow.
For turbulent flow, based on the empirical formulae,

hold in which D is the inlet hydraulic diameter.
Assuming that the flow field was fully developed at the outlet of calculation domain, there is no backflow on the outlet boundary. The boundary flow parameters do not influence the upstream. The outlet velocity was obtained according to continuous conditions. Turbulent kinetic energy and dissipation rate were obtained by the node's linear extrapolation as

in which n is the tangential direction of the main streamline on the outlet boundary.
The average static pressure was specified on the outlet boundary, assuming it to be zero. The nonslip wall boundary condition was applied, and standard wall functions for the near-wall region. If the wall was rotating then the circumferential velocity was considered to be the boundary velocity [29, 30].
3. Numerical Simulation of Bidirectional Performance
Figure 3 shows the relative velocity distribution on the front and back of runner with unilateral and double guide vanes. Seen from the figures, water flows in from inlet of blade, flowing along the blade's surface and the flowing out from the outlet of blade. The water flows smoothly. There is no vortex, and the flow pattern is good.

Relative velocity distribution on the front and back of blade.
3.1. Positive Power Performance of Unilateral and Double Guide Vanes
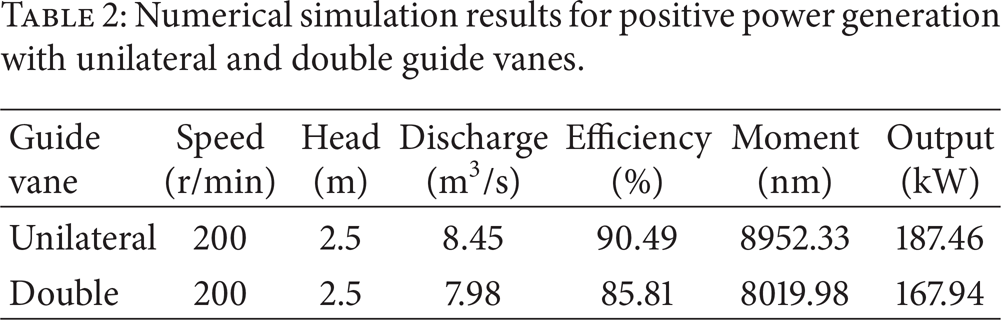
Figure 4 shows the schematic diagram of the entire flow passage of a pit turbine with a unilateral guide vane. The guide mechanism is one of the most important parts of a turbine. The guide vane is a main component of the flow parts. Circulation is formed after water flows through the guide vane and distributes itself uniformly at the same time. Finally, the water flows axisymmetrically into the runner. Table 2 gives the calculation results for positive power performance with unilateral and double guide vanes. It is apparent that positive power generation with a unilateral guide vane located at the end of the shaft shows higher efficiency and better performance than that with double guide vanes. With double side guide vanes, discharge through the turbine is reduced, and efficiency and output are decreased. With adding guide vane 2, because of the increased amount of crowding water, the discharge through the turbine is decreased. With the turbine's spatial oblique guide vanes, the water is blocked from the outlet of runner under the positive power generation, even though guide vane 2 is fully open. Using the unilateral guide vane 1, the head loss from face C to face B is 0.085 m, and the head loss is 0.195 m with double guide vanes. The head loss is obviously increased, and it has influence on the decreased efficiency of turbine. This means that the turbine with unilateral guide vane shows good performance for positive power generation.
Numerical simulation results for positive power generation with unilateral and double guide vanes.

Schematic diagram of the entire flow passage of a pit turbine with unilateral guide vane.
Figures 5 and 6 show the velocity profile for positive power generation on the axial plane with unilateral and double guide vanes. The inlet flow pattern can be seen to be symmetrically distributed along the shaft under both conditions. The water is not affected by the disturbance and circulation generated by the guide vanes and runner, but it maintains a steady flow. The velocity distribution is uniform on the runner, and the streamlines are smooth. No undesirable flow patterns such as partial vortices are observed.

Velocity profile of positive power generation for a turbine with unilateral guide vane.
Velocity profile of positive power generation for a turbine with double guide vanes.
3.2. Reverse Power Generation Performance of Unilateral and Double Guide Vanes
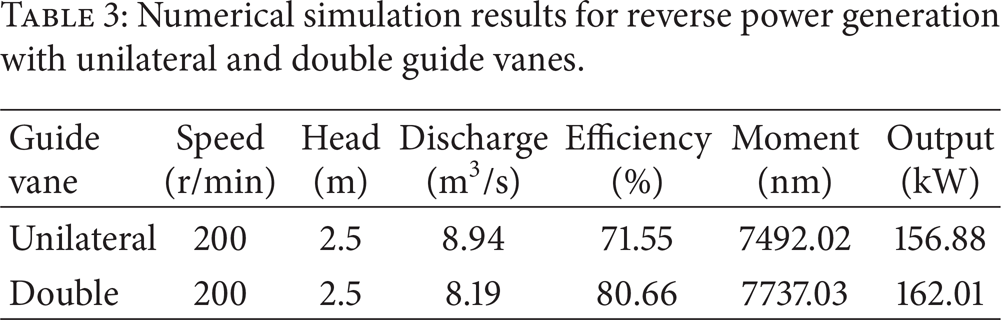
Under the reverse-generation condition, the passage with shaft is the outlet conduit. Table 3 gives the reverse-generation calculation results for turbines with unilateral and double guide vanes. The efficiency of reverse generation is low (only 71.55%) with a unilateral guide vane located at the end of the shaft. The discharge through the turbine is slightly reduced with double guide vanes, but the efficiency of reverse power generation is greatly improved, reaching 80.66%, and the output is also improved. With adding guide vane 2, the amount of crowding water increased and the discharge through the turbine is decreased. But at the same time, under the reverse power generation, certain circulation is formed before entering the runner with guide vane 2. So, the efficiency of runner is improved, leading to the improvement of turbine's efficiency. This means that, for reverse power generation, the turbine with double guide vanes shows better performance.
Numerical simulation results for reverse power generation with unilateral and double guide vanes.
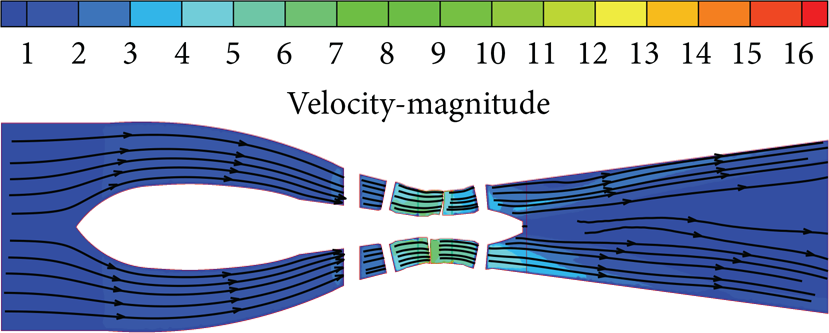
Figures 7 and 8 show the velocity profile of reverse power generation on the axial plane with unilateral and double guide vanes. The streamlines are smooth under the reverse power-generation condition with unilateral and double guide vanes. The flow pattern is generally good, but there are vortices at the outlet and the end of the shaft, where the flow pattern is undesirable. The hydraulic losses are large, leading to low efficiency in reverse power generation.

Velocity profile of reverse power generation for a turbine with unilateral guide vane.

Velocity profile of reverse power generation for a turbine with double guide vanes.
3.3. Static Pressure Distribution and Vector Profile on Near Outer Edge of the Guide Vane Blade
Figure 9 shows the static pressure distribution on the near outer edge of guide vane blade under the four modes above. At the positive condition, the static pressure of guide vane 1 is almost the same with unilateral guide vane and double guide vanes. That means, adding guide vane 2 almost has no influence on the passage before water flows into guide vane 1. The pressure of guide vane 2 greatly reduces after the working runner. At the reverse condition, the local pressure on the back of the guide vane 1 with unilateral guide vane is lower than that with double guide vanes. Comparing Figures 9 (a) and 9 (f), the static pressure of guide vane 2 is lower at the reverse-double mode than that of guide vane 1 at the positive-unilateral mode. The difference is mainly caused by different inlet passage. And local high pressure occurred on the head of both guide vanes above, because of the water flow impaction.

Static pressure distribution on the near outer edge of guide vane blade.
Figure 10 shows the vector profile of the near outer edge of guide vane blade. The water flows along the wall of guide vane at every mode. And the velocity is small near the guide vane wall because of the viscosity. The guide vane 1 at reverse-unilateral mode shows the largest velocity, which leads to the high local loss of guide vane.

Vector profile of the near outer edge of guide vane blade.
4. Model Test
4.1. Parameters of Model Turbine and Test Instrument
The prototype turbine was scaled down to a model turbine with a 0.35 m diameter runner for the model test. The performances of positive and reverse power generation were tested using unilateral and double guide vanes. The main working parameters were rated head 2.5 m, highest head 4.2 m, lowest head 1.0 m, rated discharge 0.383 m3/s, and rated speed 914.29 r/min.
The model test was based on a multifunction hydro-mechanical experimental bench at Hohai University. The measuring instruments were (1) head measurement: EJA110A pressure difference sensor made by CYS, precision of ±0.1%; (2) discharge measurement: RFM4110-500 electromagnetic flow meter made by SGAIC, precision of ±0.2%; (3) torque and speed measurement: JCZ-200 torque meter made by XYDC, precision of ±0.1%; (4) vacuum, atmospheric pressure, and temperature measurement: EJA430A pressure transmitter made by CYS for measuring vacuum, precision of ±0.075%; level 0.5 aneroid barometer for measuring atmospheric pressure; and mercury thermometer for measuring temperature.
4.2. Results of Model Test
Table 4 presents the bidirectional power generation data from the model test and the data for the switched prototype turbine with unilateral and double guide vanes under the design conditions, head 2.5 m and speed 200 r/min. These results reveal that positive power generation shows high efficiency and large output with a unilateral guide vane. The efficiency and output of positive power generation slightly decreases with double guide vanes. However, the efficiency of reverse power generation is improved greatly with double guide vanes. The efficiency of reverse power generation is improved from 69.64% to 80.12% when converted into prototype turbine data. The output is improved from 148.42 kW to 156.80 kW, which meets the design requirements.
Bidirectional power generation data from the model test and data from the switched prototype turbine with unilateral and double guide vanes under design conditions.

5. Comparison of Numerical Simulation with Model Test
Figure 11 presents a comparison of numerical simulation and model test results for positive power generation with unilateral and double guide vanes. The efficiency-discharge curve reveals that, both in the numerical simulation and in the model test, the efficiency varies with discharge for the unilateral guide vane. The highest efficiency for positive power generation, both in the model test and in the numerical simulation, is greater than 85%. With double guide vanes, the efficiency, according to both numerical simulation and model test, also varies with discharge. The highest efficiency for positive power generation, according to both the model test and the numerical simulation, is greater than 80%. As the output-discharge curve shows, the output curve follows the discharge trends with a unilateral guide vane. The largest output is greater than 150 kW. The output curve also follows the discharge trends with double guide vanes. The largest output for positive generation is greater than 150 kW according to both the model test and the numerical simulation. The error between the model test and the numerical simulation is small for both unilateral and double guide vanes at the optimum operating condition. The large difference between test data and numerical data at large flow rate was caused by the more complex flow deviation from the optimum operating condition. The difference also increased of numerical simulation without considering the clearance and frictional force between the runner and runner chamber. The clearance between the guide vane and stay ring was not taken into account either.

Comparison of numerical simulation and model test results for positive power generation with unilateral and double guide vanes.
Figure 12 presents a comparison of numerical simulation and model test results for reverse power generation with unilateral and double guide vanes. The efficiency-discharge curve shows that efficiency, according to both the numerical simulation and the model test, follows the trends in discharge with a unilateral guide vane. The highest efficiency for reverse power generation, according to both the model test and the numerical simulation, is less than 75%. Efficiency also follows discharge trends with double guide vanes, according to both the numerical simulation and the model test. The highest efficiency for reverse power generation in both the model test and the numerical simulation is greater than 80%. The output-discharge curve shows that the output curve follows discharge trends with a unilateral guide vane. The output from the model test is lower than that from the numerical simulation, and the largest output is less than 150 kW. The output curve also follows discharge trends with double guide vanes. The largest output from reverse generation is greater than 150 kW according to both the model test and the numerical simulation. The error between the model test and the numerical simulation is small for both unilateral and double guide vanes. In the model test results, the points of maximum efficiency and maximum output move to the bottom left compared to the simulation results. However, the difference becomes relatively large in the small-discharge and large-discharge parts of the curve. This is mainly because, as conditions deviate from the optimum, the turbine flow movement becomes more complex. The difference also increased of numerical simulation without considering the clearance and frictional force between the runner and runner chamber. The clearance between the guide vane and stay ring was not taken into account either.

Comparison of numerical simulation and model test results for reverse power generation with unilateral and double guide vanes.
6. Conclusions
Numerical simulations and model tests were done of a new bidirectional pit turbine for tidal power stations with low head and large discharge under different guide-vane openings, especially with unilateral or double guide vanes.
The results of numerical simulation show that under positive power generation, the unit exhibits high efficiency, 90.49%, with a unilateral guide vane and a discharge of 8.45 m3/s. The output, 187.46 kW, is large. However, the unit's reverse power-generation efficiency is low. The highest efficiency is only 71.55%, and the output is 156.88 kW. The unit's highest efficiency was reduced to 85.81% in positive generation with double guide vanes, with a discharge of 7.98 m3/s and an output of 167.94 kW. However, the efficiency of reverse generation is significantly improved with double guide vanes, with a highest efficiency of 80.66%, a discharge of 8.19 m3/s, and an output of 162.01 kW.
The model test results under corresponding conditions converted to prototype data show that the unit's highest efficiency in positive power generation is 89.36% with a unilateral guide vane, with a discharge of 8.40 m3/s and an output of 180.36 kW. The unit's highest efficiency in reverse power generation is 69.64%, with a discharge of 8.69 m3/s and an output of 148.42 kW. The unit's highest efficiency in positive power generation with double guide vanes is 84.03%, with a discharge of 7.84 m3/s and an output of 161.57 kW. The unit's highest efficiency in reverse power generation is 80.12%, with a discharge of 7.96 m3/s and an output of 156.80 kW.
Considering the positive and reverse power-generation performance, the turbine with double guide vanes shows better performance. The efficiency of reverse-double mode is greatly improved mainly because of the formed circulation before water flows into the runner. The results for discharge, output, and efficiency for the model test were lower than those from the numerical simulation under the same conditions, but the deviation was small. The difference was caused by numerical simulation without considering the clearance and frictional force between the runner and runner chamber and the clearance between the guide vane and stay ring. On the whole, the results of the model test thus verified the reliability of the numerical calculation.
Conflict of Interests
All the authors declare that there is no conflict of interests regarding the publication of this paper. All the authors do not have a direct financial relation with the commercial identities mentioned in their paper that might lead to a conflict of interests for any of the authors.
Footnotes
Acknowledgments
The work is financially supported by the project Special Founds for MRE: GHME2011CX02.