
Abstract
The precipitation of wax/solid paraffin during production, transportation, and processing of crude oil is a serious problem. It is essential to have a reliable model to predict the wax appearance temperature and the amount of solid precipitated at different conditions. This paper presents a work to predict the solid precipitation based on solid-liquid equilibrium with regular solution-molecular thermodynamic theory and characterization of the crude oil plus fraction. Due to the differences of solubility characteristics between solid and liquid phase, the solubility parameters of liquid and solid phase are calculated by a modified model. The heat capacity change between solid and liquid phase is considered and estimated in the thermodynamic model. An activity coefficient based thermodynamic method combined with two characteristic methods to calculate wax precipitation in crude oil, especially heavy oil, has been tested with experimental data. The results show that the wax appearance temperature and the amount of weight precipitated can be predicted well with the experimental data.
1. Introduction
Wax precipitation is a serious problem in the petroleum industry because it may result in the plugging of well bores, production facilities, and transportation pipelines during oil/gas production. The change of temperatures, pressures, and oil/gas compositions may cause wax precipitation. To design oil/gas production process efficiently, it is of great importance to predict wax appearance temperatures (WAT) and the amount of precipitated wax using a thermodynamic wax model.
Several thermodynamic models for wax precipitation have been published in the literature. Wax precipitation models can be divided into two categories: an equation of state plus activity coefficient (EOS + GE) approach and an EOS approach. In the former approach, a cubic EOS is applied for vapor-liquid equilibrium (VLE) and an activity coefficient model (based on either regular solution theory or polymer solution theory) for solid-liquid equilibrium (SLE). At equilibrium, it is necessary that, for every component i

where f is the fugacity and i is the number of component.
Researchers use a cubic EOS for vapor-liquid equilibrium and an activity coefficient model for solid-liquid equilibrium [1–6]. These models are based on solid solution theory which assumes that all the components in the solid phase are miscible in all proportions.
Proper characterization of the heavy end hydrocarbons has an important effect on thermodynamic modelling of wax precipitation. The thermophysical parameters of multiphase mixture and the wax deposition rate are relative to phase equilibrium. Due to its important role in predicting the phase behaviour of hydrocarbon fluids, methods of characterization have been investigated using different thermodynamic models. The constituents of a hydrocarbon system are classified in two categories: the well-defined components and the undefined petroleum fraction which are those heavy compounds lumped together and identified as the plus fraction. Characterization of plus fraction usually consists of three steps:
Estimation of the molar distribution by splitting the plus fraction into single carbon number (SCN), with known molar amount and molecular weight.
Estimation of critical properties, the melting enthalpy and the heat capacities of the resulting carbon number fractions.
Lumping of the generated SCN.
A couple of works have been done to estimate the mole distribution fraction. Katz and Firoozabadi [7] proposed a simple method for splitting the plus fraction which requires only the mole fraction of C7+. This equation is as follows:

Whitson [8] proposed a three-parameter gamma probability (TPG) distribution function to describe the relation between mole fraction and molecular weight of SCN components of the plus fraction. Pedersen et al. [2, 3] proposed a logarithmic relationship between the mole fraction and the carbon number for carbon numbers (C n ) above 6, as follows:

In the present work, a thermodynamic model based on regular solution theory is combined with improved methods for plus fraction characterization. Predictions are further compared with published precipitation data of petroleum mixtures, where a reliable prediction of solid prediction is found with the current method.
2. Thermodynamic of Wax Precipitation
A molecular thermodynamic approach is used to describe the solid-liquid phase behaviour of crude oil. The method takes into account the effects of temperature, composition, and nonideality of each phase. For each component i at thermodynamic equilibrium between solid and liquid must satisfy the following equation:

where f is the fugacity; the superscript represents the phase of the component. The solid-liquid equilibrium coefficient K i sl is given as follows:

where γ i l , T i f , ΔH i f , and ΔCp are activity coefficient, fusion temperature, heat of fusion of component i, and heat capacity change of fusion.
2.1. Theory
Won [1] used regular solution theory to get activity coefficients of the individual components in the liquid and solid phase. The activity coefficients are determined by the solubility parameters of each phase as follows:
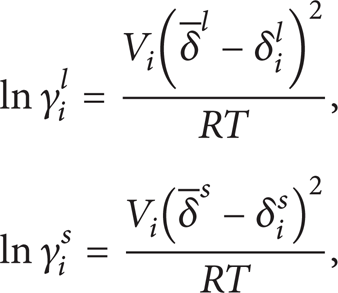
where γ
i
,
Combining equations above, the activity coefficient ratio is

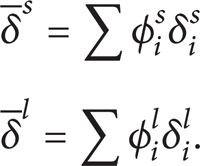
While the average solubility parameters are
It can be involved from (5) and (7) that accurate description of the above parameters as γ i l , T i f , ΔH i f , and ΔCp is crucial to the prediction method.
Thermodynamic model is established based on a modified regular solution theory. A systematic work has been carried out on the existing models, where a new method combined with existing models and correlations is found and helps to predict the precipitation of solid in crude oils.
2.2. Models of Properties
2.2.1. Solubility Parameters
The solubility parameter of component i in liquid solution of paraffin is calculated with the correlation proposed by Riazi and AL-Sahhaf [9]:

As to naphthenic, aromatic, and asphalt, the correlation proposed by Leelavanichkul [10] will be used:

The solubility parameter in solid solution can be obtained as follows:

2.2.2. Heat Capacity Change of Fusion
The relationship between the heat capacity change of fusion, temperature, and molecular weight in the process of phase transform is expressed by Pedersen [11] as follows:

where a and b are constants, approximately valued 0.3033 and – 4.635e−4.
Molecular weight is calculated by the SCN and the classes as:
paraffinic:

naphthenic:

aromatic:

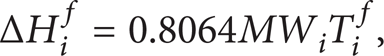
2.2.3. Fusion Temperature and Heat of Fusion
Fusion temperature can be expressed as a function of molecular weight. Won [1] proposed the following correlation for paraffin:

When the molecular weight is higher than 450, the correlation above is converted to

Correlation proposed by Lira-Galeana et al. [12] for isoparaffin is considered

A set of correlations [13] is considered for heat of fusion with differences between the odd carbon number and even carbon number:
odd (7 < C n < 21)

even (8 < C n < 22)
22 < C n < 38

C n > 38

Correlation for naphthenic and aroma is expressed separately as follows [14]:

Thermodynamic model demands an accurate characterization of the plus fraction. Insufficient description of the plus fraction will affect the prediction accuracy of wax precipitation. So, a proper description of the plus fraction is analyzed below.
3. Plus Fraction Characterization
The plus fraction, that is C7+, is a combination of the infinite number of hydrocarbon components heavier than SCN 7. It is normal that certain data would be provided by a laboratory or field for the plus fraction, such as mole percent, molecular weight, density, and the specific gravity. Though the information may be more or less different from the accurate number, the properties of plus fraction are essential for the characterization. Through two improved methods [2, 3, 8, 15], key properties of the thermodynamic model can be calculated.
3.1. Method 1
It is commonly considered that distribution of the mole fraction of components heavier than 7 is exponentially. Pedersen et al. [2, 3] proposed that reservoir fluids for carbon numbers (C n ) above 6 can be expressed with a logarithmic relationship between the mole fraction and the carbon number:

where Z i is mole fraction of the carbon number i in the SCN; C i is value of carbon number; A, B are constants.
The molecular weight can be gained from a chart of molecular weights of SCN groups proposed by Katz and Firoozabadi [7]. While the carbon number is higher than 45, molecular weight can be calculated as

Al-Meshan and McCain [16] proposed that the exponential distribution starts from C11 rather than C7 recommend by Pedersen. In the present work, neither C7 nor C11 was used. A procedure is characterized to determine the initial carbon number.
Find the carbon number, C max , with the highest mole fraction in the defined fraction.
If C max > 11, then C max is the initial number.
If 7 < C max < 11, then 11 is the initial number. If C max < 7, then 7 is the initial number.
3.2. Method 2
Whitson [8] proposed a three parameter gamma (TPG) probability distribution function to describe the relation between mole fraction and molecular weight of SCN components of the C7+ plus fraction. The Gauss-Laguerre quadrature method was used to generate the mole fraction of SCN. The probability density function p(M) is as follow:

where α, η, and β are characteristic parameters defining the distribution. η is the minimum molecular weight in C7+ fraction. The plus fraction such as C7+ is not restricted, where other plus fractions can be used. The limit η is the minimum molecular weight found in the C7+ fraction. The minimum molecular weight is not a constant. It varies with different reservoir fluids. Usually the range is from 86 to 100. α is the fitting parameter, which defines the shape of the mole fraction distribution. Reasonable limits for α are 0.5 to 3.0. β is defined as

The frequency of occurrence (normalized mole fraction) in the interval η to x is a cumulative probability function, p(X ≤ x), which is the integral of p(X) from η to x:

The mole fraction of SCN is then obtained by calculating the cumulative frequency of occurrence between the limits Mi – 1 and M i multiplied by the mole fraction of the Cn+ fraction:

where i is the SCN and M i is the molecular weight of the SCN usually defined as the molecular weight of the normal component.
The developed method here is based on the fact that SCN may represent hundreds of different compounds with the same number of carbon atoms. Uncertainty of the types and distribution of compounds present in each SCN indicate that the average value of the molecular weight of an SCN is different from one sample to another. The modification of Whitson's method includes a simple procedure to determine the value of the parameter α and the new definition of the limits used to obtain the frequency of occurrence for each SCN. According to the statistical characterization of TPG, the mean and variance can be obtained by (27) and (30).
Consider the following:

The new limits used to calculate the cumulative frequency of occurrence are defined by the best fit between TPG and the experimental mole fraction (Z iexp ). To establish the function of limiting molecular weight (LMW) to SCN, at least two previous carbon numbers and their mole fraction must be known to use this approach. Once an initial value of the parameters is calculated, the second step is to iterate with a controlled error E, expressed as follows:
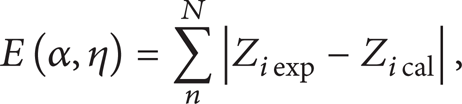
where Z iexp and Zi cal are experimental and calculated mole fractions of component i, respectively, and N is the final number of components extended. n is the initial number of component that needs to be extended.
The length between molecular weight boundaries is assumed as constant as 14. It could be achieved by minimization of E with the following iterative process.
Taking η = 86 for C7+ plus fraction. α is calculated from (27) and (30), then Zi cal and E could be calculated.
Adjusting parameter as αlower = α – 0.01, and αhigher = α + 0.01; Elower and Ehigher are calculated accordingly. If Elower < E, Δ = – 0.01; If Ehigher < E, Δ = + 0.01.
Let αtest = α + Δ and compare Etest with E; the process is repeated until Etest ≥ E.
αfinal = αtest; Efinal = Etest; then η = η + 1; repeat processes 1 to 3; if Efinal > Etest, then αfinal = αtest Efinal = Etest. This process is repeated until η > 100.
The η limits for SCN (i) is between 13i and 14i + 2. Once the parameters α, β, and η have been generated, dividing the TPG into SCN with the new definition of the limits by the LMW, (29) is then transformed to

where M wmin = η is taken as an initial value. LMW is calculated by the best fit between Z iexp and Zi cal with the following iterative.
Zi cal is calculated with the estimation of the limiting molecular weight: LMw = Mw min + dM.
If Zi cal < Z iexp , then adjust the LMw for each iteration using secant method. The process is repeated until Zi cal ≥ Z iexp .
If i ≤ N, then Mw min = LMw, i = i + 1; the processes 1 to 2 will be iterated with a new i and the LMw for each i will be stored.
A function of LMw versus SCN can be achieved. Experimental mole fractions are compared with the calculated results, with the average relative error (ARE) and the absolute average relative error (AARE):

4. Results and Discussion
For the validation of the proposed methods, 7 different experimental extended fluid compositions have been used. These fluid compositions have different plus fraction such as C20+ and C30+. The main characterization for these fluids is presented in Table 1. As shown from Table 1 this set of data covers a wide range of C7+ mole fraction of 78.32%–98.46%, that is, all heavy oil and black oil. (oil 1#–4# from [2, 3], 5#–7# from [10]).
Properties of the oil samples.

4.1. Characterization of Plus Fraction
The above two methods are used to calculate the cumulative frequency of occurrence. Figure 1 shows the comparison between experimental and predicted SCN mole fraction for selected oil samples. While Table 2 shows the AREs and AAREs that are calculated using (33) for all fluids where the experimental extended composition is grouped to C7+ and then extended to the original plus fraction.
Comparison between predicted and measured mole fractions.


Comparison between measured and predicted mole fraction using the method 1 and 2 (oil samples 1#, 3#, and 7#).
Figure 1 shows the comparison between the experimental and calculated mole fraction for fluids using methods 1 and 2. The complex and diversity of the heavy oil make the characterization of plus fraction more difficult than that of light oil or gas condenser oil. As shown in Table 2, both methods result in reasonable mole fraction for SCN, proved by the low ARE (0.01 for method 2 and 0.002 for method 1) and AARE (0.03 for method 2 and 0.02 for method 1). The LMW for each carbon number is determined to fit the mole fraction that is corresponding to the carbon number. So the calculation results of the mole fraction are well with those of experiments.
It is observed from the combination of results presented in Figure 1 and Table 2 that the prediction for all oil samples is acceptable; it is sufficient to use both methods to yield an excellent match of the complete molar distribution.
4.2. Wax Precipitation
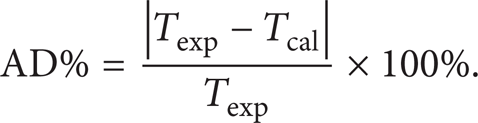
Predicted wax appearance temperature (WAT) with proposed characterization methods are compared with experimental data for all oil samples using defined C50+ plus fraction, as shown in Table 3. The absolute percentage error is calculated as (34), where a good agreement could be found.
Comparison between the predicted and measured WAT for oil 1#–7#.

Consider the following:
Further, an accurate prediction method proposed by Leelavanichkul [10] is considered and compared with our modified models, where a total of 148 components including pseudo-components are characterized. Techniques such as refraction index (RI) measurement, high performance liquid chromatography (HPLC), and Fourier transform-infrared (FT-IR) were used to divide the defined fraction up to C50 into paraffinic-naphthenic-aromatic (PNA). Molecular weight and mole fraction of C50+ plus fraction are divided into defined asphaltene and resin subfractions. Combined with regular solution method, a more accurate prediction of wax precipitation has been established and compared with predictions from the current work for oil samples 5#–7#, as shown in Table 3. The WAT and weight percentage of precipitated wax are further compared in Figure 2 with the two methods and Leelavanichkul [10] method.

Comparison between predicted and measured weight of precipitated wax (oil samples 5#–7#).
As can be seen from Figure 2 and Table 3, predictions obtained with the modified methods in the current work show an acceptable trend of fitting and agree with Leelavanichkul's accurate prediction method [10], which could be attributed to proper characterization of plus fraction proposed and a reasonable combination of correlations from the literatures.
5. Conclusions
An activity coefficient based regular solution model combined with improved methods for plus fraction characterization has been established in the present work. Predictions of the wax appearance temperature and the amount of precipitated weight are further compared with published data of petroleum mixtures. Data covers a wide range of C7+ mole fraction of 78.32%–98.46%, that is, all heavy oil and black oil, where a reliable prediction of solid prediction is found with the current method.
Future work is highly demanded to apply the proposed method in the prediction of wax precipitation at gas-liquid-solid multiphase systems. It could provide an important fundament for the precipitation prediction in multiphase system with the presence of gas phase, where the proposed liquid-solid thermodynamic equilibrium method is demanded to be further coupled with the equation of state for gas-liquid equilibrium.
Footnotes
Acknowledgments
The authors wish to thank the Program for New Century Excellent Talents in University (NCET-12-0969), Foundation for the Author of National Excellent Doctoral Dissertation of PR China (201254), National Natural Science Foundation of China (51104167), National Science & Technology Specific Program of China (2011ZX05026-004-03), and Science Foundation of China University of Petroleum, Beijing (BJ-2011-02) for providing support for this work.