
Abstract
Optimal sensor placement is an important part in the structural health monitoring of bridge structures. However, some defects are present in the existing methods, such as the focus on a single optimal index, the selection of modal order and sensor number based on experience, and the long computation time. A hybrid optimization strategy named MSE-AGA is proposed in this study to address these problems. The approach firstly selects modal order using modal participation factor. Then, the modal strain energy method is adopted to conduct the initial sensor placement. Finally, the adaptive genetic algorithm (AGA) is utilized to determine the optimal number and locations of the sensors, which uses the root mean square of off-diagonal elements in the modal assurance criterion matrix as the fitness function. A case study of sensor placement on a numerically simulated bridge structure is provided to verify the effectiveness of the MSE-AGA strategy, and the AGA method without initial placement is used as a contrast experiment. A comparison of these strategies shows that the optimal results obtained by the MSE-AGA method have a high modal strain energy index, a short computation time, and small off-diagonal elements in the modal assurance criterion matrix.
1. Introduction
Due to strong wind force, torrential rain, severe earthquake, explosion, and other abnormal loads, large scale civil infrastructures may be damaged in the long service period [1]. The traditional routine visual inspection usually ignores the tiny failures and the flaws inside the structures. Therefore, structural health monitoring (SHM) [2–4] has been an important research topic in the engineering protection field. A typical SHM system includes three subsystems: sensor subsystem, data processing subsystem, and condition evaluation subsystem. Optimal sensor placement (OSP) [5–7] is a critical issue in SHM research. Generally, the more sensors are placed, the more information could be obtained. Unfortunately, the number of sensors is strictly constrained by cost. For instance, there are only 23, 65, and 72 accelerometers instrumented in the Tsing Ma Bridge, the Ting Kau Bridge, and Jiangyin Bridge, respectively [8]. The sensor number is far less than the available positions. Therefore, how to set suitable sensor number and where to deploy the sensors become the challenging tasks.
Several methods have been developed to achieve OSP. Salama et al. [9] presented the modal kinetic energy method to choose the positions that have high modal energy. Debnath et al. [10] modified this method and used the modal contribution in output energy to evaluate sensor placement. Kammer [11] claimed that the optimal placement result was determined by minimizing the norm of the Fisher information matrix, which was obtained from the modal and measurement covariance matrices, and proposed the effective independence method. Meo and Zumpano [12] proposed the effective independence driving-point residue method. Li et al. [13] determined the existence of a relationship between the effective independence method and the modal kinetic energy method and presented a quick computation of the effective independence method through QR downdating [14]. Carne and Dohrmann [15] developed a famous method named minMAC. As known, a basic requirement in distinguishing the measured modes is that the measured modal vectors must be as linearly independent as possible. Carne considered the modal assurance criterion (MAC) matrix to be an ideal scalar constant relating the causal relationship between two modal vectors and used the minimization of the off-diagonal terms in the MAC matrix as a measure of sensor network configuration. Li et al. [16] extended this method. In recent years, computational intelligence approaches have been applied to achieve OSP, such as genetic algorithm [17, 18] and monkey algorithm [19]. A review concerning the differences and relationships of the sensor placement methods was provided by Yi and Li [20].
Although these methods made great progress, a few defects still existed. Firstly, a suitable placement result for a real civil structure often requires multiple evaluation indexes to be optimal at the same time. To the bridge structures, the noise in the sensor signal is usually very big because of strong wind and heavy rain, so it is necessary to improve the signal to noise ratio of the collected data. A good sensor placement result for bridge structures requires both a high modal energy index and a good MAC index. A high modal energy index can ensure that the measured data have a high signal to noise ratio and a high precision. A good MAC index can guarantee the orthogonality of the measured modal vectors and increase the amount of modal information obtained from the collected data. However, most of the traditional methods were proposed for a single optimal index. This shortage leads to the fact that the traditional OSP methods cannot be used in the real bridge structures without modification. Secondly, the modal shape matrix is composed of all orders of modes, and the modes can be easily attained through modal analysis. Nevertheless, in order to reduce computation complexity, only the modes that have large dynamical response are selected to compose the modal shape matrix. How to select the modal order becomes an important problem. The modal order was selected based on experience in the traditional methods. However, Yi et al. [21] discovered that modal order selection had a strong effect on the final placement result. Therefore, the selection of modal order by expert experience is subjective and imprecise. At the same time, due to special form, size, and dynamical feature, it is very hard to obtain the optimal sensor number only by experience for a specific structure. Therefore, the determination of sensor number based on experience is also not suitable. Finally, the computation speeds of the previous methods are slow, especially with respect to the large scale bridge structures.
The objective of this study is to present a new OSP method that has multiple optimal indexes and a short computation time. A new method termed MSE-AGA is proposed to achieve this goal. First, the modal participation factor (MPF) is proposed to select the modal order. Then, the initial sensor assignment is performed using the modal strain energy (MSE) method to improve the modal energy index of the selected locations. Finally, the AGA method is adopted to determine the optimal sensor number and locations, which uses root mean square of off-diagonal elements in the modal assurance criterion matrix as the fitness function. This fitness function assists in improving the MAC index of sensor placement. At the same time, the adaptive crossover and mutation factors can improve the convergence speed and the searching efficiency of the algorithm.
The remaining parts of the paper are organized as follows. Section 2 introduces the mathematical model of OSP and the evaluation criteria. The MSE-AGA strategy is described in Section 3. Section 4 provides a case study of sensor placement on a numerically simulated bridge structure to verify the effectiveness of the MSE-AGA method and discusses the limitations of using finite element (FE) model instead of the real structure. Section 5 is the conclusion and the future work.
2. Basic Theory
The OSP problem assumes that there are n locations where sensors can be deployed and s sensors should be placed on the structure. Therefore, the mathematical model of OSP can be described as the following optimal equation [22]:

Several criteria, such as MAC, modal energy criterion, Fisher information matrix criterion [23], and probability-based damage detection criterion [24], are proposed to evaluate the effect of the different sensor placement methods. Due to the requirement of mode identification and the noisy environment of bridge structures, MAC and modal energy criterion are chosen as the evaluation criteria in this study.
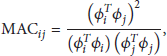
The linearly independent of the modal vector is an essential demand to identify the modes. Carne and Dohrmann [15] considered the MAC to be an ideal criterion to evaluate the relevance of the modal vectors. In the criterion, the smaller off-diagonal elements of the MAC matrix represent better independence of the modal vectors. The MAC matrix is computed as
Modal energy is an important structural feature parameter. Stubbs et al. [25, 26] determined that the MSE was an effective index to detect the structural damage. Therefore, selection of the degree of freedoms (DOFs) that have large energy is necessary to achieve condition evaluation and damage identification of the structure. The modal energy criterion selects the DOFs with high modal energy as the sensor locations. Therefore, this criterion is suitable for bridge structures with the measured data that are greatly affected by the noisy environment. The MSE matrix of the structure is defined as

3. Description of the MSE-AGA Method
MSE-AGA, a new OSP method, is presented in this section to address the existing problems in the previous methods. The method includes three strategies. First, the suitable modal order is selected using MPF on the basis of modal analysis. Second, the initial sensor assignment is performed using the MSE method. Finally, the optimal number and locations of sensors are determined using the AGA method. The main steps of the MSE-AGA method are shown in Figure 1.

Steps of the MSE-AGA method.
3.1. Modal Order Selection and Initial Sensor Placement
3.1.1. Modal Order Selection
Different choices of modal order result in various placement results. According to the requirement of OSP, the modal order that has a strong dynamic response should be selected. Nevertheless, modal order is selected based on experience in the traditional methods. In order to solve this problem, MPF is presented as the evaluation criterion for the modal order selection.
The equation of motion for the n DOF dynamic system is represented as
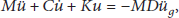
The displacement vector u can be transformed by

If M, C, and K meet the orthogonalization of the normalization modal shape, (4) can be written as

The MPF is defined as (7):

The mass normalization for the modal shape matrix ϕ is determined by

Based on (7) and (8), the MPF can be expressed as


MPF reflects the dynamic response amplitudes of all of the modes. Therefore, the modal order that has a bigger MPF value should be selected priorly.
Although all of the modes can be sorted based on their MPFs, there is still a question that how many modes should be selected. The modal participating mass ratio is presented as a criterion to determine the number of the modes. Modal participating mass is defined as

When mass normalization has been conducted for the modal shape matrix ϕ, (12) can be transformed by:

The modal participating mass ratio of the ith mode can be expressed as

Wilson [27] suggested that summation of modal participating mass ratio of the selected modes should be over 90%. This criterion is employed in this study to determine the number of modes.
3.1.2. Initial Sensor Placement Using the MSE Method
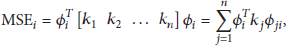
The MSE method selects the locations with large response amplitudes as sensor locations by comparing the MSE of all of the DOFs. The MSE of the ith mode can be computed as

The MSE of all of the DOFs can be computed on the basis of (15):

The main idea of initial sensor placement is to select the DOFs with large MSE as the candidate locations. Therefore, this step ensures the final placement locations having big modal energy and reduces the searching space of the optimal placement.
3.2. Final Sensor Placement Using the AGA Method
The genetic algorithm (GA) is proven to be an effective tool for OSP. However, faults that should be improved remain. For instance, two or more sensors may be placed on one location and the searching efficiency may not be good enough. The adaptive genetic algorithm (AGA) is adopted in this study to settle the issues. The flowchart of the AGA is shown in Figure 2.

Flowchart of the AGA method.
3.2.1. Coding Method
In the traditional coding method, the gene number of value 1 could be changed in the process of crossover and mutation, which may result in two or more sensors placed on one location. Therefore, the dual-structure coding method is used in this study. As shown in Table 1, the chromosome of individual is composed of two rows, where the upper row
Dual-structure coding method.

3.2.2. Selection, Crossover, and Mutation
The roulette wheel selection scheme is used to select the best individual in each generation, and an elitist strategy is employed to retain the best individual for the subsequent generation.
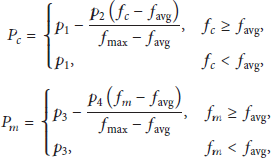
Crossover and mutation factors have a strong influence on the efficiency of GA. In the basic genetic algorithm, these factors are set by trial and error, and they keep invariant throughout the entire iteration cycle. These defects lower the evolution velocity and the optimization ability of the algorithm. Therefore, the adaptive mechanism is introduced into this algorithm. The adaptive adjustment processes of the two factors are defined as
3.2.3. Fitness Function
The off-diagonal elements in the MAC matrix express the correlation between two modal vectors. Identifying the ith mode and the jth mode is easy if the value of 
4. Simulation Verification of the MSE-AGA Method
In order to verify the effectiveness of the MSE-AGA method, a case study of sensor placement on a numerically simulated bridge structure is provided below.
4.1. Modeling and Modal Analysis
A three-span suspension bridge is selected in this demonstration case. The bridge has a main span of 128 m and two side spans of 46 m each. The FE model of the bridge is established using the commercial software ANSYS, and the model is shown in Figure 3.

FE model of the bridge.
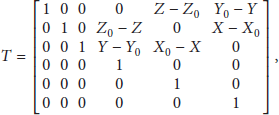
The truss girder and main towers are modeled by beam4, the main cables and suspenders are simulated by link10, and the bridge deck is built by shell63. A total of 1276 nodes and 3381 elements are generated. The natural frequency (Table 2) and modal shape (Figure 4) of the structure are received by modal analysis.
Natural frequency of the first 10 modes.

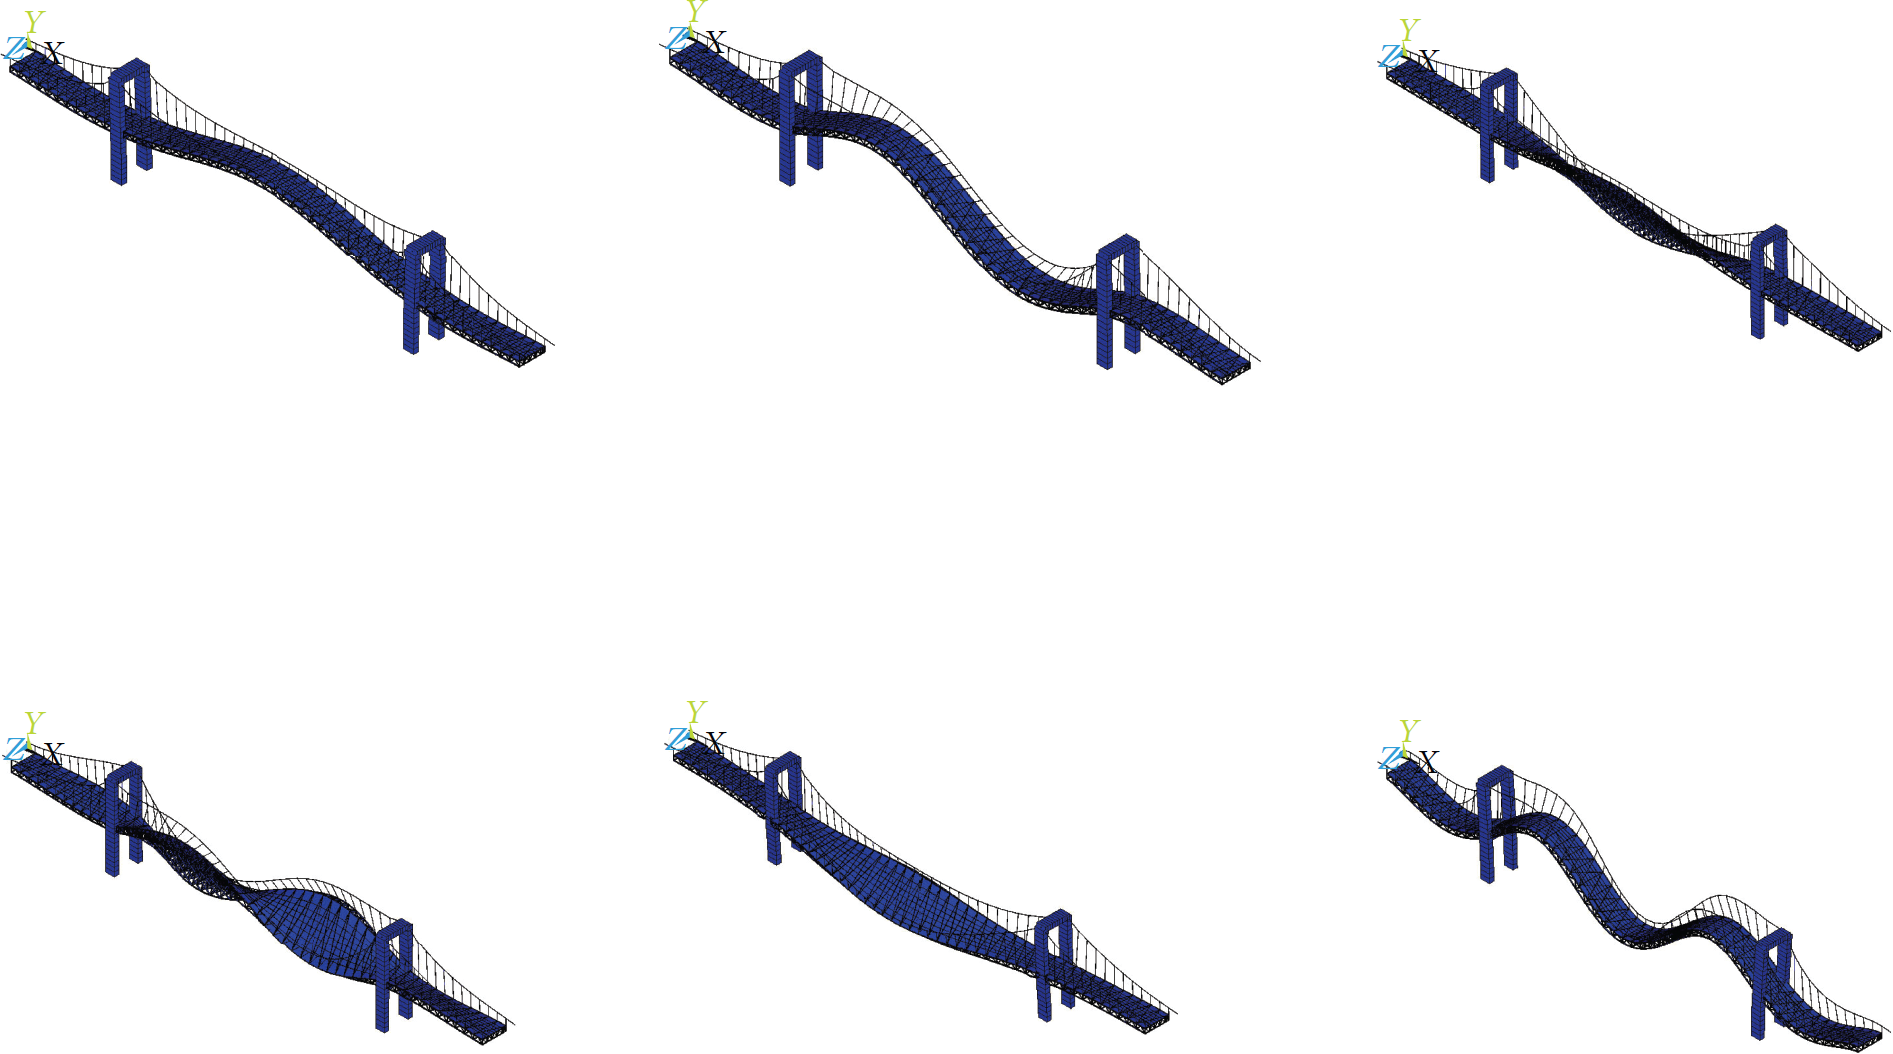
The 1st to 6th modal shapes.
4.2. Modal Order Selection Using MPF
The MPFs of the modes are computed using (9) to (11). The results of the first 30 modes are shown in Figures 5, 6, and 7.

MPF of x direction.

MPF of y direction.

MPF of z direction.
As shown in Figures 5 to 7, the 2nd, 7th, 11th, and 14th modes have large MPFs in x direction. The 1st, 9th, 13th, and 22nd modes, have large MPFs in y direction, and MPFs of the 3rd, 5th, and 10th modes are big in z direction. So the 1st, 2nd, 3rd, 5th, 7th, 9th, 10th, 11th, 13th, 14th, and 22nd modes are selected as the optimal mode combination. The modal participating mass ratio of the combination in each direction is computed using (12) to (14), and the results are presented as

The results show that
4.3. OSP Using MSE-AGA
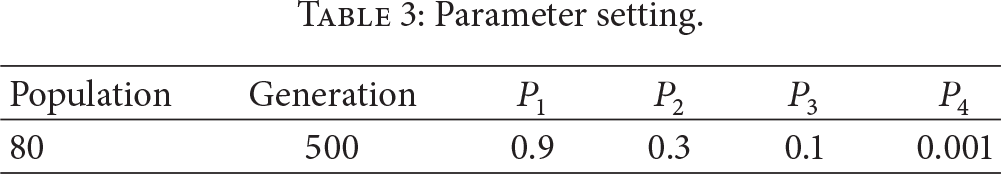
The MSE of all of the DOFs in the bridge can be computed using (15) to (17). The first 1000 DOFs are selected as the candidate locations. Then, AGA is used to optimize the placement. The parameters in AGA are set as shown in Table 3.
Parameter setting.
The optimal process of AGA is executed according to Figure 2. The fitness function values with different sensors numbers are shown in Figure 8.
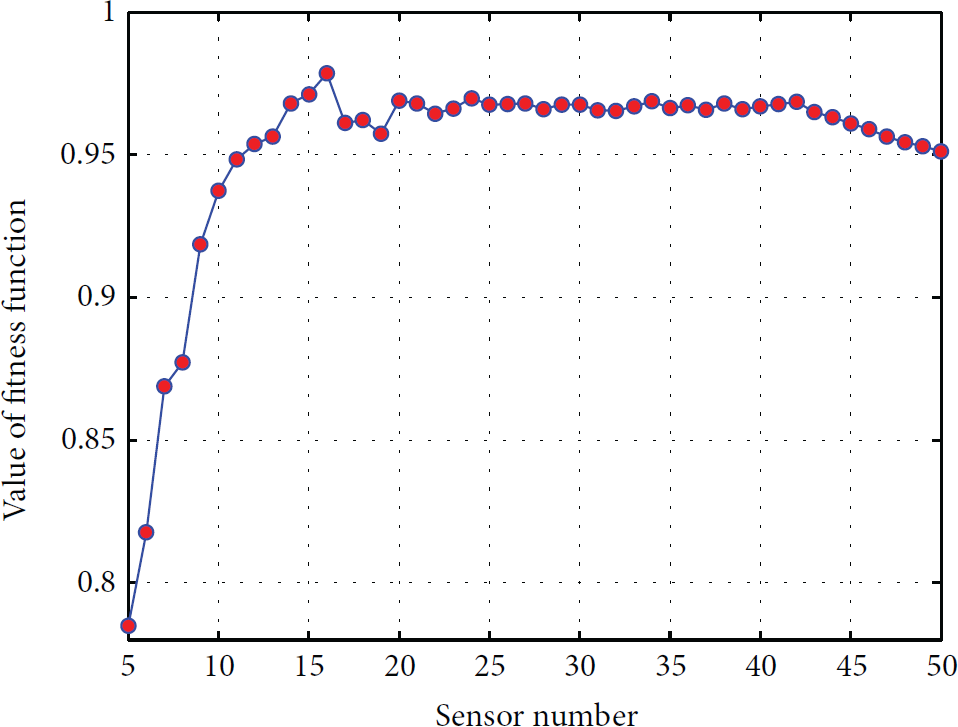
Fitness function values with different sensor numbers.
As shown in Figure 8, when the sensor number is set between 5 and 15, the fitness increases with sensor added. The fitness function reaches its maximum when the sensor number is set at 16. But, if the sensor number is more than 16, the fitness does not increase with sensor added. The reason for the contradiction is that the row vector determined at the newly included sensor location has a strong linear relationship with the entire previous sensor set. Therefore, sixteen is determined as the optimal sensor number in consideration of placement cost and efficiency.
AGA is used to optimize sensor placement on the basis of the initial deployment. The final optimal result is provided in Table 4.
Optimal sensor locations.

4.4. Contrast Experiment
AGA without initial deployment is used as a contrast experiment. The optimal placement results of the two methods are provided in Figures 9 and 10.
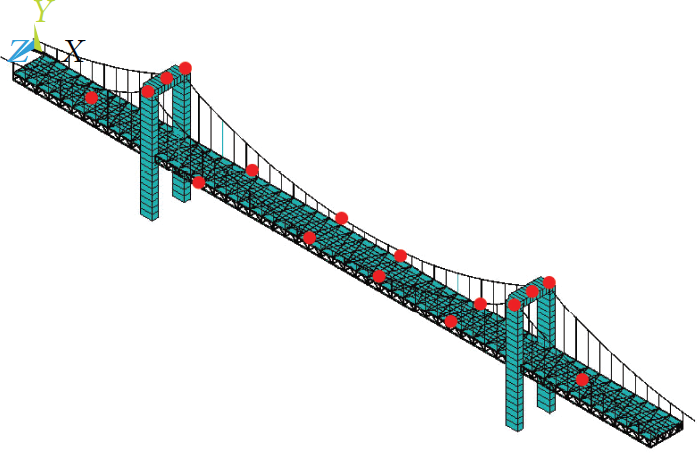
Optimal result of MSE-AGA.

Optimal result of AGA.
The modal energy index and MAC indexes are selected to evaluate the placement effect of the two methods. The summations of the MSE of the selected locations are shown in Figure 11.

MSE indexes of the two methods.
The MAC matrixes of the two methods are shown in Figures 12 and 13. The RMS and maximum value of the off-diagonal elements in the MAC matrix are provided in Table 5.
MAC indexes of the two methods.

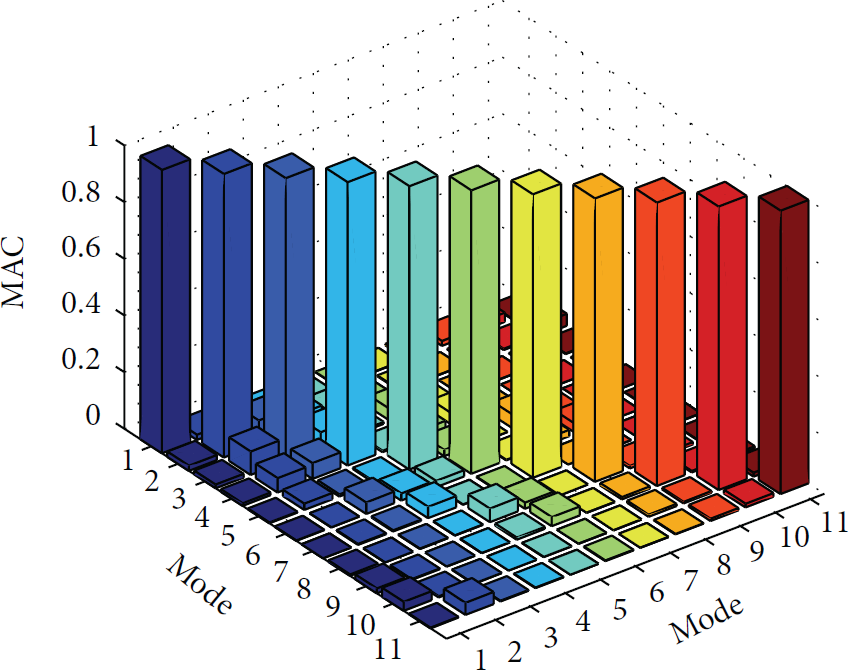
MAC matrix of MSE-AGA.

MAC matrix of AGA.
The two methods are calculated on the same computer with the CPU frequency of 2 G Hz, and Matlab 7.0 is used as the computation software. The computation time of the two methods is shown in Table 6.
Computation times of the two methods.

4.5. Result Analysis
As shown in Figure 11, the summation of MSE of the selected locations by MSE-AGA is evidently larger than that by AGA. The result implies that MSE-AGA is a better method than the AGA in terms of modal energy index. The reason for this result is that the MSE method is used for the initial sensor placement in the MSE-AGA method.
Table 5 shows that the off-diagonal elements in the MAC matrixes of the two methods are very small, thus suggesting that both methods are effective in terms of the MAC index. This is because AGA that is used for the final sensor placement in the two methods has a good searching ability. Comparing the two methods, the maximum value of the off-diagonal elements in MSE-AGA is 0.0826, which is smaller than that in the AGA. But the RMS of the off-diagonal elements as computed using the MSE-AGA is 0.0221, a little bigger than that computed by the AGA. A similar conclusion can be received from Figures 12 and 13. The slight difference is because the searching space of the AGA is composed of all of the structural DOFs, but the searching space of the MSE-AGA is composed of only the candidate locations selected by the MSE method.
Due to the smaller searching space, the computation time of MSE-AGA is 240 seconds as shown in Table 6. However, 3299 seconds are required to accomplish the comparison method on the same computer. Therefore, the MSE-AGA method is better than the AGA in terms of the computation time index.
4.6. Discussion
The demonstration case is based on a numerically simulated bridge structure. The FE model of the bridge structure is built in strict accordance with the actual structure. Therefore, the numerical simulation can verify the effectiveness of the MSE-AGA method to a certain extent. Of course, the numerical FE model remains some limitations inevitably. Firstly, noise and other environmental factors, such as temperature and wind force, may impact the dynamic feature of the real bridge structure. However, these factors are not considered in the simulation experiment. Secondly, in the real structure, there are some locations that are not available to deploy the sensors. But these nodes may be selected as the optimal sensor locations in the numerical analysis.
5. Conclusions and Future Work
The traditional OSP methods are limited by the use of a single optimal index, the selection of modal order and sensor number based on experience, and the long computation time. MSE-AGA, which is a new hybrid method based on the MSE and AGA methods, is presented in this study to address these issues. In this strategy, the modal order is selected using MPF firstly. Then, the MSE method is used for the initial sensor placement. Finally, the sensor number and locations are determined using the AGA. With the case analysis, some conclusions are summarized as follows.
Using the MSE method for the initial sensor placement ensures that the optimal locations have the large MSE. Therefore, it can make the collected data have a high precision and signal to noise ratio. AGA, which uses the MAC as the fitness function, is utilized in the final sensor placement. This step guarantees that the RMS and the maximum value of the off-diagonal elements are small. Experiment results show that the combined sensor placement strategy is good in terms of both the modal energy index and the MAC index. A new modal order selection method based on MPF is proposed as an improvement to the traditional method. MPF can reflect the dynamic response amplitudes of all modes. Therefore, it is effective to select the modes having large dynamical feature using MPF. The optimal sensor number can be determined by computing the fitness function values with different numbers of sensors. This method can help us determine the sensor number required in the SHM and reduce cost. Because of the additional process of the initial sensor placement, the searching space of MSE-AGA is smaller than that of AGA. This is the main reason that MSE-AGA has a short computation time.
The MSE-AGA method is proved to be an effective OSP method as the numerical analysis. However, there are still some works to do. An experiment of sensor placement on a real bridge structure will be conducted by our team in further research.
Footnotes
Conflict of Interests
The authors declare that there is no conflict of interests regarding the publication of this paper.