
Abstract
Wireless sensor networks provide a lot of advantages for vibration monitoring of bridges. The installation time and implementation cost of the monitoring system are greatly reduced by the adoption of this innovative technology. This paper presents a long-term vibration monitoring of the Hwamyung cable-stayed bridge in Korea using an Imote2-platformed wireless sensor network. First, the wireless vibration monitoring system of the bridge is briefly described by outlining the test history, the design of wireless sensor system, and the sensor deployment. Next, the vibration behaviors of the bridge are experimentally examined with respect to the variation of temperature, the wind loads induced by typhoons, and the change of bridge deck mass caused by pavement.
1. Introduction
Over the two past decades, the structural health monitoring has become increasingly important for the service life of civil infrastructures. In order to secure the structural integrity, many robust sensing technologies and SHM methods have been developed [1–3]. Recently, the interest in the safety assessment of cable-stayed bridges has been increasing [4]. For a cable-stayed bridge, critical damage may occur in main structural components such as a deck, cables, and pylons resulting from stiffness loss, crack growth, and concrete degradation. Critical damage in cable-anchorage subsystems may include cable force loss, anchorage damage, and anchorage force loss.
The conventional monitoring system mainly requires a number of sensors, a huge amount of signal transmitting wires, data acquisition instruments, and centralized data storage servers. Therefore, the cost associated with installation and maintenance of the monitoring system is very high. Recently, low-cost, stand-alone smart sensors have been developed by many research groups. Straser and Kiremidjian [5] proposed the design of a low-cost wireless modular monitoring system. Since then, many researchers have developed wireless sensors based on a variety of sensor platforms [6–9].
By adopting those smart sensors for monitoring in large structures, the costs are greatly reduced and the data processing and information management will be very effective by ways of sensing and onboard computation, wireless transmission, and green energy harvesting. However, there have been a few full-scale implementations of wireless sensors for bridge monitoring so far [4, 6, 10]. Also, only a few studies have been performed on long-term monitoring using wireless sensors, which should provide solid guidelines for the practical applications.
This paper presents a long-term vibration monitoring of the Hwamyung cable-stayed bridge in Korea using an Imote2-platformed wireless sensor network. First, the wireless vibration monitoring system of the bridge is briefly described by outlining the test history, the design of wireless sensor system, and the sensor deployment. Next, the vibration behaviors of the bridge are experimentally examined with respect to the variation of temperature, the wind loads induced by typhoons, and the change of bridge deck mass caused by pavement.
2. Wireless Monitoring System of Hwamyung Cable-Stayed Bridge
2.1. Test History
Field tests were conducted on Hwamyung cable-stayed bridge, as shown in Figure 1, crossing Nakdong River between Busan and Gimhae, Korea. The bridge was constructed by Hyundai Engineering & Construction Co., Ltd., from December 2004 to July 2012. The bridge consists of three spans including a 270 m central main span between two pylons and two 115 m side spans connecting east and west approaches. The clearance of the deck is 14.7 m from the water level. The height of two pylons is 65 m from the deck level. The box girder is 27.8 m in width and 4 m in height. The bridge has a total 72 cables, positioning 36 cables at each pylon. The test history on the bridge is summarized in Table 1. The research project can be outlined in four work phases: design of wireless sensor system, sensor system setup, performance evaluation, and long-term vibration monitoring.
Experiment history on the Hwamyung bridge.

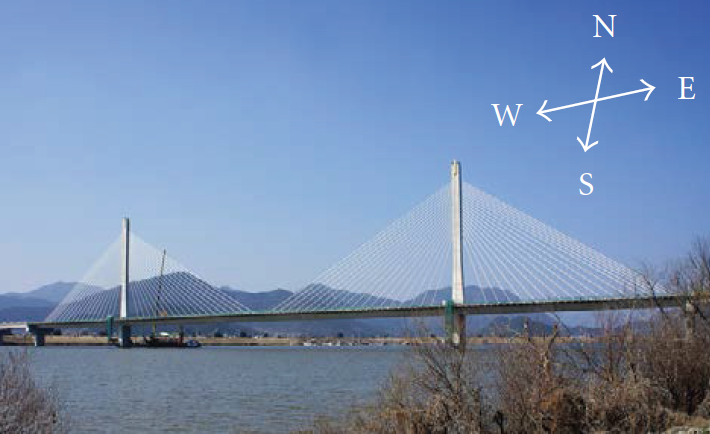
Hwamyung cable-stayed bridge.
For the design of wireless sensor system, the vibration sensor and operation software are designed during May 2011. For the sensor system setup, the location and orientation of sensor and the internet-based remote sensing schematic are designed during June 2011. For the performance evaluation, the functionality of wireless communication, the durability of solar power harvesting, the flexibility of response signal measurement, and the feasibility of modal analysis and system identification are examined during June to July 2011. For the long-term monitoring of the bridge, several tasks such as monitoring cable-anchorage motions under temperature variation and investigating bridge behaviors under several typhoon and deck-mass changes have been performed during August 2011 to June 2013. During the entire monitoring periods, the temperature has varied in a wide range of about −10°C to 45°C.
2.2. Design of Wireless Sensor Nodes
A multiscale vibration sensor node on Imote2 platform was designed as schematized in Figure 2(a). The high performance sensor platform, Imote2, provided by Memsic Co. [11], was selected to control the operation of the sensor node. For vibration monitoring, SHM-A, SHM-AS, and SHM-H sensor boards were selected. The SHM-A and SHM-H sensor boards were developed for acceleration measurement by University of Illinois at Urbana-Champaign (UIUC) [8, 12]. The SHM-AS sensor board was modified from SHM-A sensor board in order to measure PZT's dynamic strain signal. The solar-powered energy harvesting is implemented by employing solar panel and rechargeable battery. Figure 2(b) shows a prototype of the multiscale sensor node which consists of three layers as follows: (1) X-bow battery board, (2) Imote2 sensor platform, and (3) SHM-H board or SHM-A (AS) board.
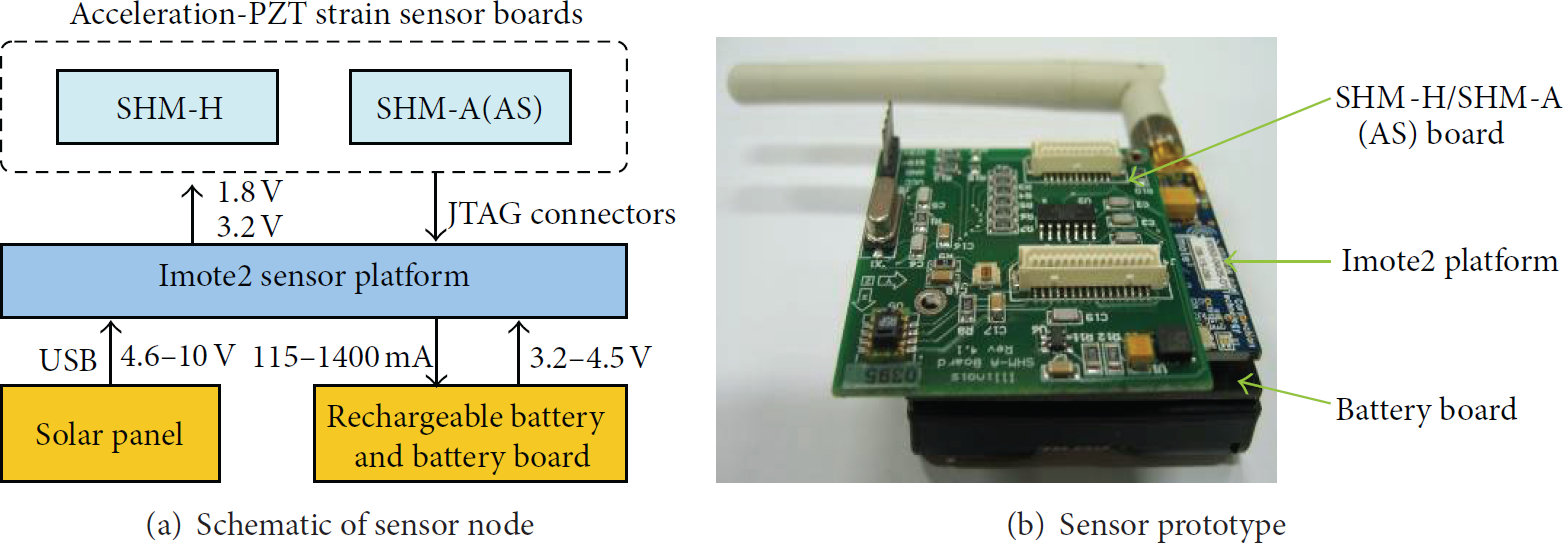
Design of wireless multiscale sensor node.
The Imote2 platform is built with 13–416 MHz PXA271 XScale processor. This processor integrates with 256 kB SRAM, 32 MB flash memory, and 32 MB SDRAM. A 2.4 GHz surface mount antenna is equipped for each Imote2 platform. For long-term operation of wireless sensor nodes, energy harvesting is employed. For powering by rechargeable battery, the hardware of X-bow battery board is modified so that a solar panel (e.g., SPE-350-6 with 9 V and 350 mA) can be integrated with the Imote2 sensor platform.
For deck's responses, SHM-H sensor board is adopted to employ a SD1221L-002 accelerometer for high-sensitivity channel, the input range ±2 g, the sensitivity 2 V/g, and the output noise 5 μg/√Hz. For cable's acceleration measurement, the SHM-A employs the triaxial LIS344ALH accelerometer whose sensitivity is relatively lower and output noise is quite higher than those of the SHM-H. In this study, a modified SHM-AS sensor board is designed to measure PZT's dynamic strain signals. The dynamic strain signal from PZT sensor is passed through a signal conditioner circuit to produce an analog signal of 0~3.3 V.
2.3. Sensor Deployment on the Bridge
As shown in Figure 3, wireless sensor networks were deployed on Hwamyung bridge. Two hardware configurations of Imote2-based smart sensor nodes which are gateway node and leaf node are designed to monitor the responses of the bridge. A gateway node consists of an Imote2 platform with a 2.4 GHz antenna and an IBB2400 interface board connected to the PC via a USB cable. A leaf node consists of an Imote2 platform with a 2.4 GHz antenna, a sensor board (e.g., SHM-AS and SHM-H), and an X-bow battery board powered by a Powerizer Li-ion polymer rechargeable battery with a solar panel.

Field sensor layout on Hwamyung cable-stayed bridge.
For vibration monitoring, twelve sensor nodes (Imote2/SHM-AS/SHM-H) including 11 leaf nodes and 1 gateway node were installed. Among the leaf nodes, 6 Imote2/SHM-H sensors were placed at five locations of the deck and at the top of the west pylon (i.e., D1~D5 and P1), and 5 Imote2/SHM-AS sensors were placed on five selected cables (i.e., C1~C5). For each sensor board (i.e., SHM-H or SHM-AS), three axes accelerations were measured. A spared channel in SHM-AS sensor board was used for measuring dynamic strain in cables. Also for dynamic strain measurement, five PZT patches were bonded on aluminum tubes covering the five selected cables. The vibration signals were measured in duration of 600 seconds with sampling rate 25 Hz. In summary, the total 33 channels of acceleration and 5 channels for dynamic strain were monitored in Hwamyung bridge.
All sensor nodes and base stations are placed in plastic boxes which have waterproof rubber gaskets to prevent them from sun heating, being absorbed and other damage caused by harsh environmental conditions such as rain, wind, and dust at the field site. Solar panels were mounted on the sensor boxes to harvest the solar energy for recharging the Li-ion polymer batteries embedded to the sensor boards.
3. Experimental Modal Identification of the Bridge
3.1. Modal Identification Method
In order to extract experimental natural frequencies and mode shapes of the deck and the pylon, the SSI method [13] was performed. The SSI method utilizes the singular value decomposition (SVD) of a block Hankel matrix with cross correlation matrix of responses as follows:


3.2. Modal Identification of the Bridge
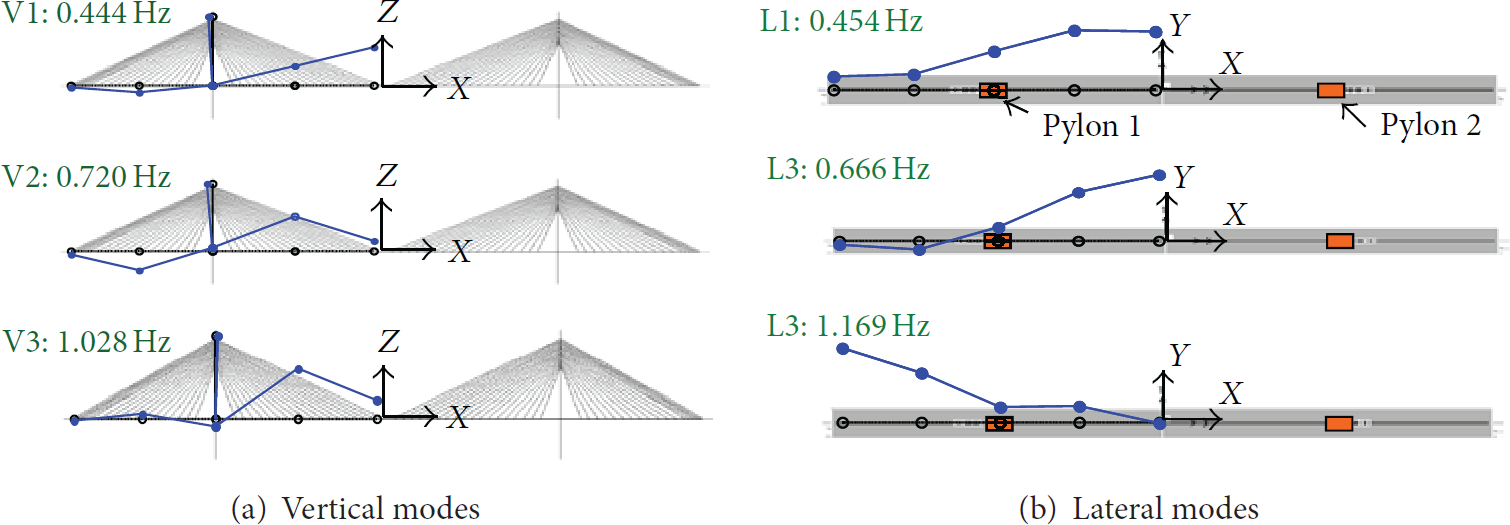
Responses of the bridge were measured in every two-hour interval under ambient vibration condition. Figures 4 and 5 show examples of acceleration responses and the corresponding power spectral densities of the deck (i.e., sensor node D2) and the cable (i.e., sensor node C4), respectively, under normal condition without vehicle traffic on the bridge. Nevertheless, of this low excitation condition, the maximum acceleration amplitudes are relatively high, such as 0.3 mg for the deck D2 and 14 mg for the cable C4. Also, natural frequencies of the bridge components can be well determined, which guarantees a reliable modal identification. Using the SSI method, modal parameters (natural frequency, damping ratio, and mode shape) for three vertical and three lateral bending modes (i.e., V1~V3 and L1~L3) were extracted as shown in Figure 6 and as listed in Table 2.
Identified natural frequencies and damping ratios.
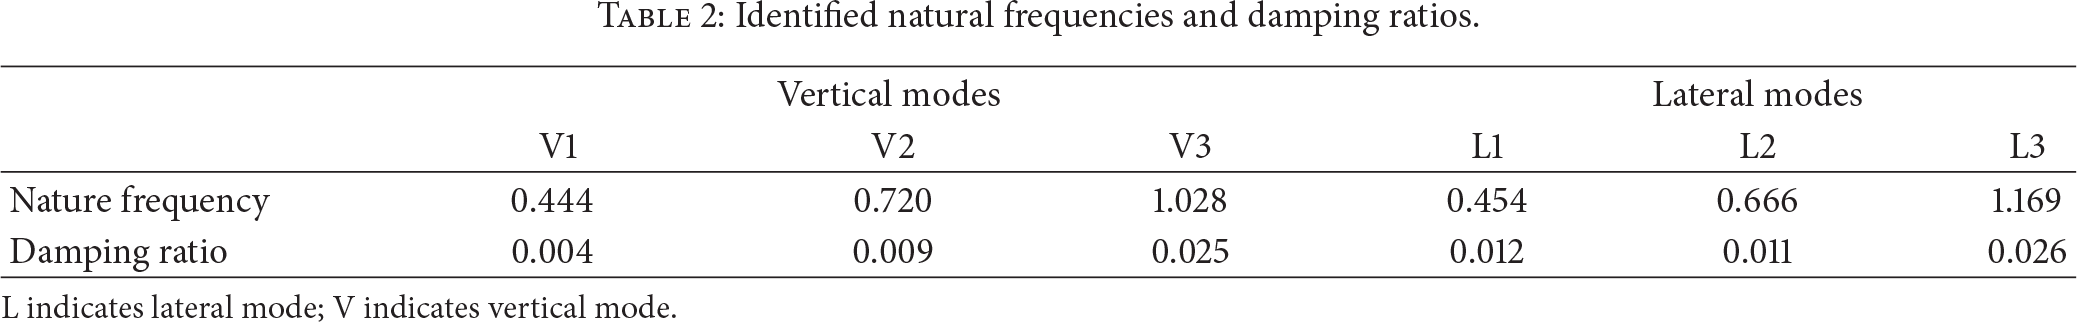
L indicates lateral mode; V indicates vertical mode.

Vibration responses of the bridge: deck D2.
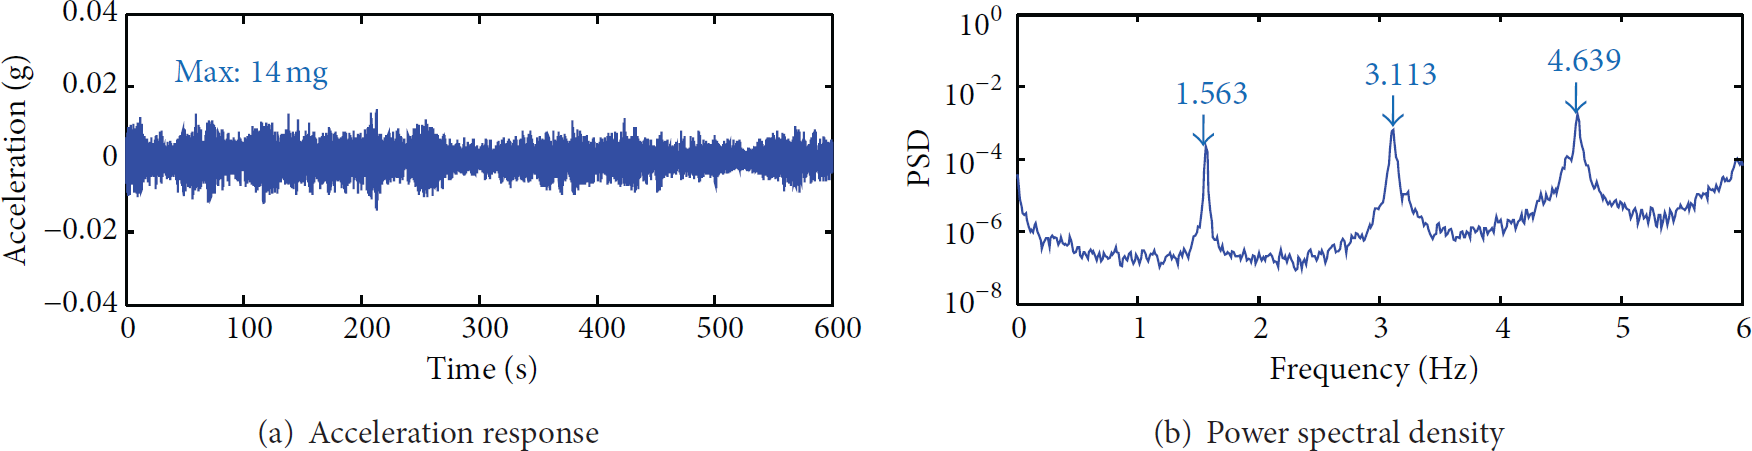
Vibration responses of the bridge: cable C4.
Modal parameters extracted by SSI method.
4. Long-Term Vibration Monitoring of the Bridge
4.1. Cable Vibration under Temperature Variation
4.1.1. Temperature Effect Estimation
For a stay cable subjected to two different temperatures, the axial extension of the cable due to temperature variation (e.g., 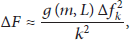

4.1.2. Natural Frequency versus Temperature Variation
The first natural frequency was monitored for the short cables C2, C3, and C4, and the second natural frequency was monitored for the long cables C1 and C5. It is worth noting that the first natural frequency can be utilized to estimate tension force of short cables, and the second one can be used to estimate tension force of long cables, according to the method proposed by Zui et al. [15]. Figures 7 and 8 show the changes in the natural frequencies (corresponding to the first or the second mode dependent on cables) versus temperature change in 5 days. It is obvious that the natural frequencies change oppositely with temperature variation. This implies that axial stress of the cable is partially released when temperature increases and vice versa. The data in a long period of one month from August to September 2011 was utilized to construct the relationship between the natural frequencies and temperature. Figures 9 and 10 illustrate the correlations between natural frequencies and temperature. It is found that the change in the cables' natural frequencies seems to be linear with temperature variation. Those monitoring results are consistent with the analytical model of temperature variation effect on change in cables' natural frequencies (4).

Monitoring results for long cables C1 and C5 in 5 days: 2nd natural frequency.

Monitoring results for short cables C2, C3, and C4 in 5 days: 1st natural frequency.

Correlation of natural frequency and temperature: long cables C1 and C5.

Correlation of natural frequency and temperature: short cables C2, C3, and C4.
4.2. Bridge Behaviors under Wind Loads Induced by Typhoons
Over 2-year monitoring, there were 4 typhoons passing the Korean peninsula and directly affected the site of Hwamyung bridge, including typhoons Meari (June 2011), Bolaven (August 2012), Tembin (August 2012), and Sanba (September 2012). During typhoon Sanba, the highest wind speed was recorded on-site as 17.9 m/s. Figure 11 shows time-frequency analysis of acceleration responses of deck D2 and cable C3 during typhoon Sanba.

Time-frequency acceleration response of deck and cable during typhoon Sanba.
It is observed that the magnitudes of all vibration modes increase significantly during the attacks of the typhoon. This implies that the typhoon gave an impact in a wide frequency range. As also shown in Figure 12, the maximum acceleration magnitude during the typhoon was much larger than that in normal wind condition. From those observations, to have a monitoring system for the internal forces of the bridge components during typhoons is found essential.

Maximum acceleration of deck and cable during typhoon Sanba.
4.3. Effect of Deck Mass Change Caused by Pavement
The effect of bridge deck mass change on the change in natural frequency was examined after the asphalt pavement was laid on the bridge in February 2012. The difference in the surface of the bridge deck can be clearly seen in Figures 13(a) and 13(b). For the fairness in weather condition, the data of two time periods (August 2011 and August 2012) with similar temperatures were selected as shown in Figure 13(c). Figure 14 shows the measured natural frequencies of the first mode of the deck and the five cables C1~C5 at the two periods. It is found that the natural frequency of deck decreased after laying the pavement, whereas the natural frequencies of the five cables increased after laying the pavement. These phenomena can be explained by the following reasons: the mass of deck was increased due to the pavement's mass, and the tension force of the cable was also increased due to the additional load from the increased weight of the deck.

Bridge conditions before and after asphalt pavement.
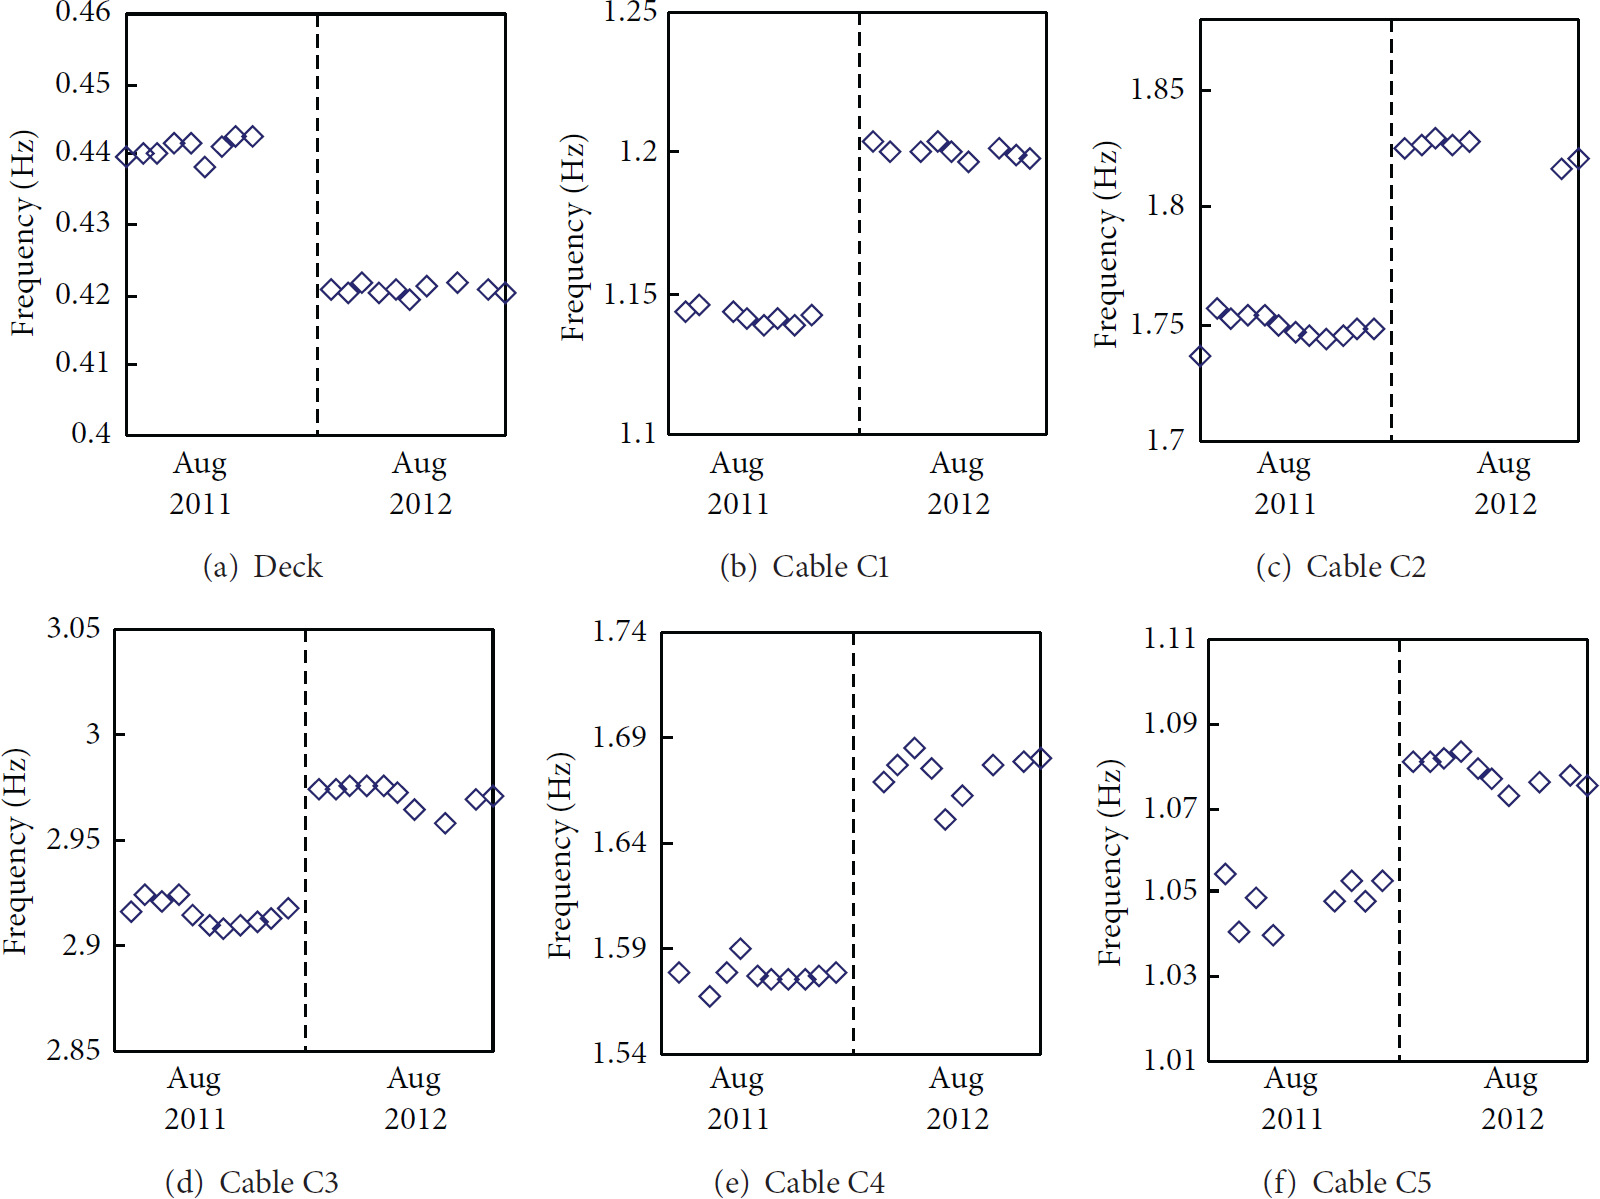
Changes in 1st natural frequencies of deck and five cables before and after asphalt pavement.
5. Summary and Conclusions
A long-term vibration monitoring of the Hwamyung cable-stayed bridge in Korea using an Imote2-platformed wireless sensor network was presented in this study. First, the wireless vibration monitoring system of the bridge was briefly described by outlining the test history, the design of wireless sensor system, and the sensor deployment. Next, the vibration behaviors of the bridge were experimentally examined with respect to the variation of temperature, the wind loads induced by typhoons, and the change of bridge deck mass caused by asphalt pavement.
The long-term vibration monitoring of the bridge has been operated successfully via the wireless sensor network. It was found that the cables' natural frequencies varied linearly with temperature variation. Natural frequencies of the deck and the cables were found much influenced by the deck mass change caused by the pavement, but in opposite trends. During a typhoon passing the bridge (typhoon Sanba), vibration amplitudes of the deck and the cables significantly increased, and all modal responses became more resonant. Future works remain on examining the effect of temperature variation on the deck's modal parameters and wind effect on the deck's and the cables' modal parameters.
Footnotes
Acknowledgment
This research was supported by a grant from a Strategic Research Project (Development of Smart Prestressing and Monitoring Technologies for Prestressed Concrete Bridges) funded by the Korea Institute of Construction Technology.