
Abstract
Belt conveyors are the equipment widely used in coal mines and other manufacturing factories, whose main components are a number of idlers. The faults of belt conveyors can directly influence the daily production. In this paper, a fault diagnosis method combining wavelet packet decomposition (WPD) and support vector machine (SVM) is proposed for monitoring belt conveyors with the focus on the detection of idler faults. Since the number of the idlers could be large, one acceleration sensor is applied to gather the vibration signals of several idlers in order to reduce the number of sensors. The vibration signals are decomposed with WPD, and the energy of each frequency band is extracted as the feature. Then, the features are employed to train an SVM to realize the detection of idler faults. The proposed fault diagnosis method is firstly tested on a testbed, and then an online monitoring and fault diagnosis system is designed for belt conveyors. An experiment is also carried out on a belt conveyor in service, and it is verified that the proposed system can locate the position of the faulty idlers with a limited number of sensors, which is important for operating belt conveyors in practices.
1. Introduction
Belt conveyor is one of the important equipments in coal mines and some other manufacturing factories, especially in the large modern coal miningenterprises where almost all of the coal is transported by belt conveyor from the coal mining to the loading station. Some faults such as slipping, deviation, and belt tearing often occur in the working process of belt conveyors, and most of them are caused by idler fault. If the idler fault can be detected in early stage, the operational failure of belt conveyor can be avoided and the economic losses can be reduced. There are few fault diagnosis systems for belt conveyor currently, and the intelligent level of existing systems is not high enough which cannot achieve the real-time online diagnostic purpose. Therefore, it is of practical interest to design a fault diagnosis system that can easily test belt conveyor online without affecting its daily working.
Vibration analysis is a commonly used tool in fault diagnosis for rotating machinery such as idler on belt conveyor [1–4]. The key to the analysis of vibration signal is the extraction of fault features for fault recognition [5]. Earlier research on fault diagnosis was focused on the using of time domain or frequency-domain methods to detect different types of faults. Due to the complicate working environment of rotating machinery, some unknown factors such as load friction can generate unpredictable effect on the vibration signal. Therefore, the signal is usually nonstationary and nonlinear and contains strong noises. The fault diagnosis by simply extracting the time- or frequency-domain features is often ineffective. In recent years, many time-frequency techniques have been widely developed for monitoring the condition of mechanical systems, such as short-time fourier transform (STFT) and Wigner-Ville distribution and wavelet analysis [6, 7]. Among these time-frequency domain techniques, WPD provides an effective method for extracting the time-frequency domain features for rotating machinery. According to WPD, the extracted features describe the energy distribution of respective bands, and the energy of respective band changes over time. In [6], Wu et al. applied discrete wavelet transform and adaptive neuro-fuzzy inference to gear fault diagnosis and classification. In [8], Jena et al. used analytic wavelet transform in gear fault diagnosis and localization. In [9], Saravanan and Ramachandran used discrete wavelet transform to extract gear fault features for neural network in order to classify and identify the gear faults. Although the wavelet analysis can effectively extract the fault features of the signal, it is still difficult to identify the fault of the signal directly and accurately. As a result, the intelligent classification techniques such as neural network and SVM have been widely applied in fault diagnosis of mechanical system [9–11]. The output of SVM is a global optimum theoretically, and the SVM could solve the problem of local extreme which the neural network cannot avoid. Hence, the SVM is more suitable for multifault classification [12].
In this paper, the vibration signals of idler are decomposed using the method of WPD, and then the energies of different frequency bands of the original signals are obtained. The vibration signal changes when some idler faults occur, and the energy of each frequency band is different under different health conditions. Therefore, the energy is employed to diagnose the fault of belt conveyor. In order to classify the fault features, the SVM is chosen as the classifier, and the trained SVM is used in the designing of online monitoring and fault diagnosis system of belt conveyors. The proposed method and system are verified on a testbed as well as on a belt conveyor in service.
2. The Principle of Feature Extraction Based on WPD
The method of WPD is proposed based on wavelet analysis [13, 14]. According to this method, a multilevel band division is conducted on the signal, and the high frequency part in the multilevel analysis can be further decomposed. The corresponding band is chosen to match the signal spectrum according to the characteristics of the signal to be analyzed, and then the time-frequency resolution can be improved [12].
The function of wavelet packet W j, k n (t) can be written as

where n is the decomposition level, j is the scale factor, and k is the translation factor.
Here f(t) is defined as the signal in time domain, and the sampling rate is f
s
. A WPD with the decomposition level J is carried out on signal f(t), and 2
J
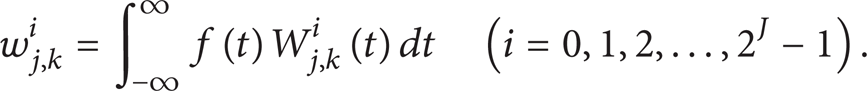
group of wavelet packet coefficients can be obtained. The frequency band that the ith (i = 0,1, 2, …, 2
J
– 1) wavelet packet coefficients are corresponding to is
The energy of band i is

The dimensionless and normalized quantization energy of the band i is

Then, the wavelet packet energy of signal f(t) on the decomposition level J can be written as

Such wavelet packet energy in (5) could be used as the input of SVM to classify the faults of idler.
3. The Principle of Fault Classification Based on SVM
SVM is a machine learning method based on statistical learning theory and structural risk minimization [15, 16]. SVM can effectively solve the nonlinear, finite sample, and high-dimensional problems, and it can usually provide a good learning ability and generalization ability. Hence, it has been successfully applied in areas such as fault diagnosis [17–19].
For the linearly separable sample set (x i , y i ) (x i ∈ R d ; y i ∈ {– 1, + 1}; i = 1,2, … n), SVM transforms the classification surface problem which guarantees the largest classification space to the problem of solving convex quadratic optimization, and it can be described as [20]

where ω is the weight vector, b is the bias, ξ is the relaxation factor, and C is the penalty factor.
The dual description of algorithm (6) can be obtained through Lagrange theorem. The Lagrange coefficients α satisfy condition

If the α i in algorithm (7) is not zero, then there is the equation

The samples that satisfy the conditions in (8) are support vectors, and these samples are distributed on the edge of the training sample. The support vectors play a key role in the classification. The classification function can be obtained through (6), and the result is

where l is the number of support vectors.
If the sample set of (x i , y i ) is not linearly separable, then the samples can be mapped to a high-dimensional linear separable feature space through a nonlinear mapping ϕ: R d → H, and the classification surface can be constructed in the space H. The classification function of the linear inseparable samples can be obtained as
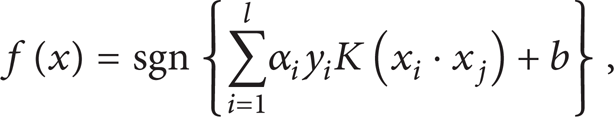
where K(x i · x j ) is the Kernel function. The commonly used Kernel functions are linear kernel, polynomial kernel, RBF kernel, and sigmoid kernel.
4. The Analysis of Simulation Signals and Idler Vibration Signals of a Belt Conveyor
4.1. Analysis of Simulation Signals
In order to illustrate the feasibility of the method, the experiment is carried out on the mechanical fault simulation test bench, and the signals collected in the experiment are analyzed. On the simulation bench, the normal state (GN) and 3 abnormal conditions which are gear with crack at root of the tooth (GTC), gear with tooth breakage (GTB), and gear with face wear of the tooth (GFW) are simulated. The mechanical fault simulation test bench is shown in Figure 1. The motor speed is 600 r/min, while the sample rate is 2 kHz in the experiment.

Mechanical fault simulation test bench.
A variety of wavelet basis functions could be used in the WPD. Based on theoretical analysis and practical experience, Daubechies (db5) wavelet basis function is selected since the series of Daubechies is more suitable than other basis functions in the fault signal analysis for the rotating machinery.
The 3-level decomposition on the vibration signal gathered by the experiments is carried out, and eight frequency bands are obtained. Then, the energy of each band under the above four conditions is calculated. After normalization, the energy value of each frequency band is used to construct the feature vector. The energy percentage of each frequency band is shown in Figure 2. It can be seen from Figure 2 that the energy distribution of the corresponding bands is different under different conditions, and the difference indicates that the extracted features can describe current health conditions.
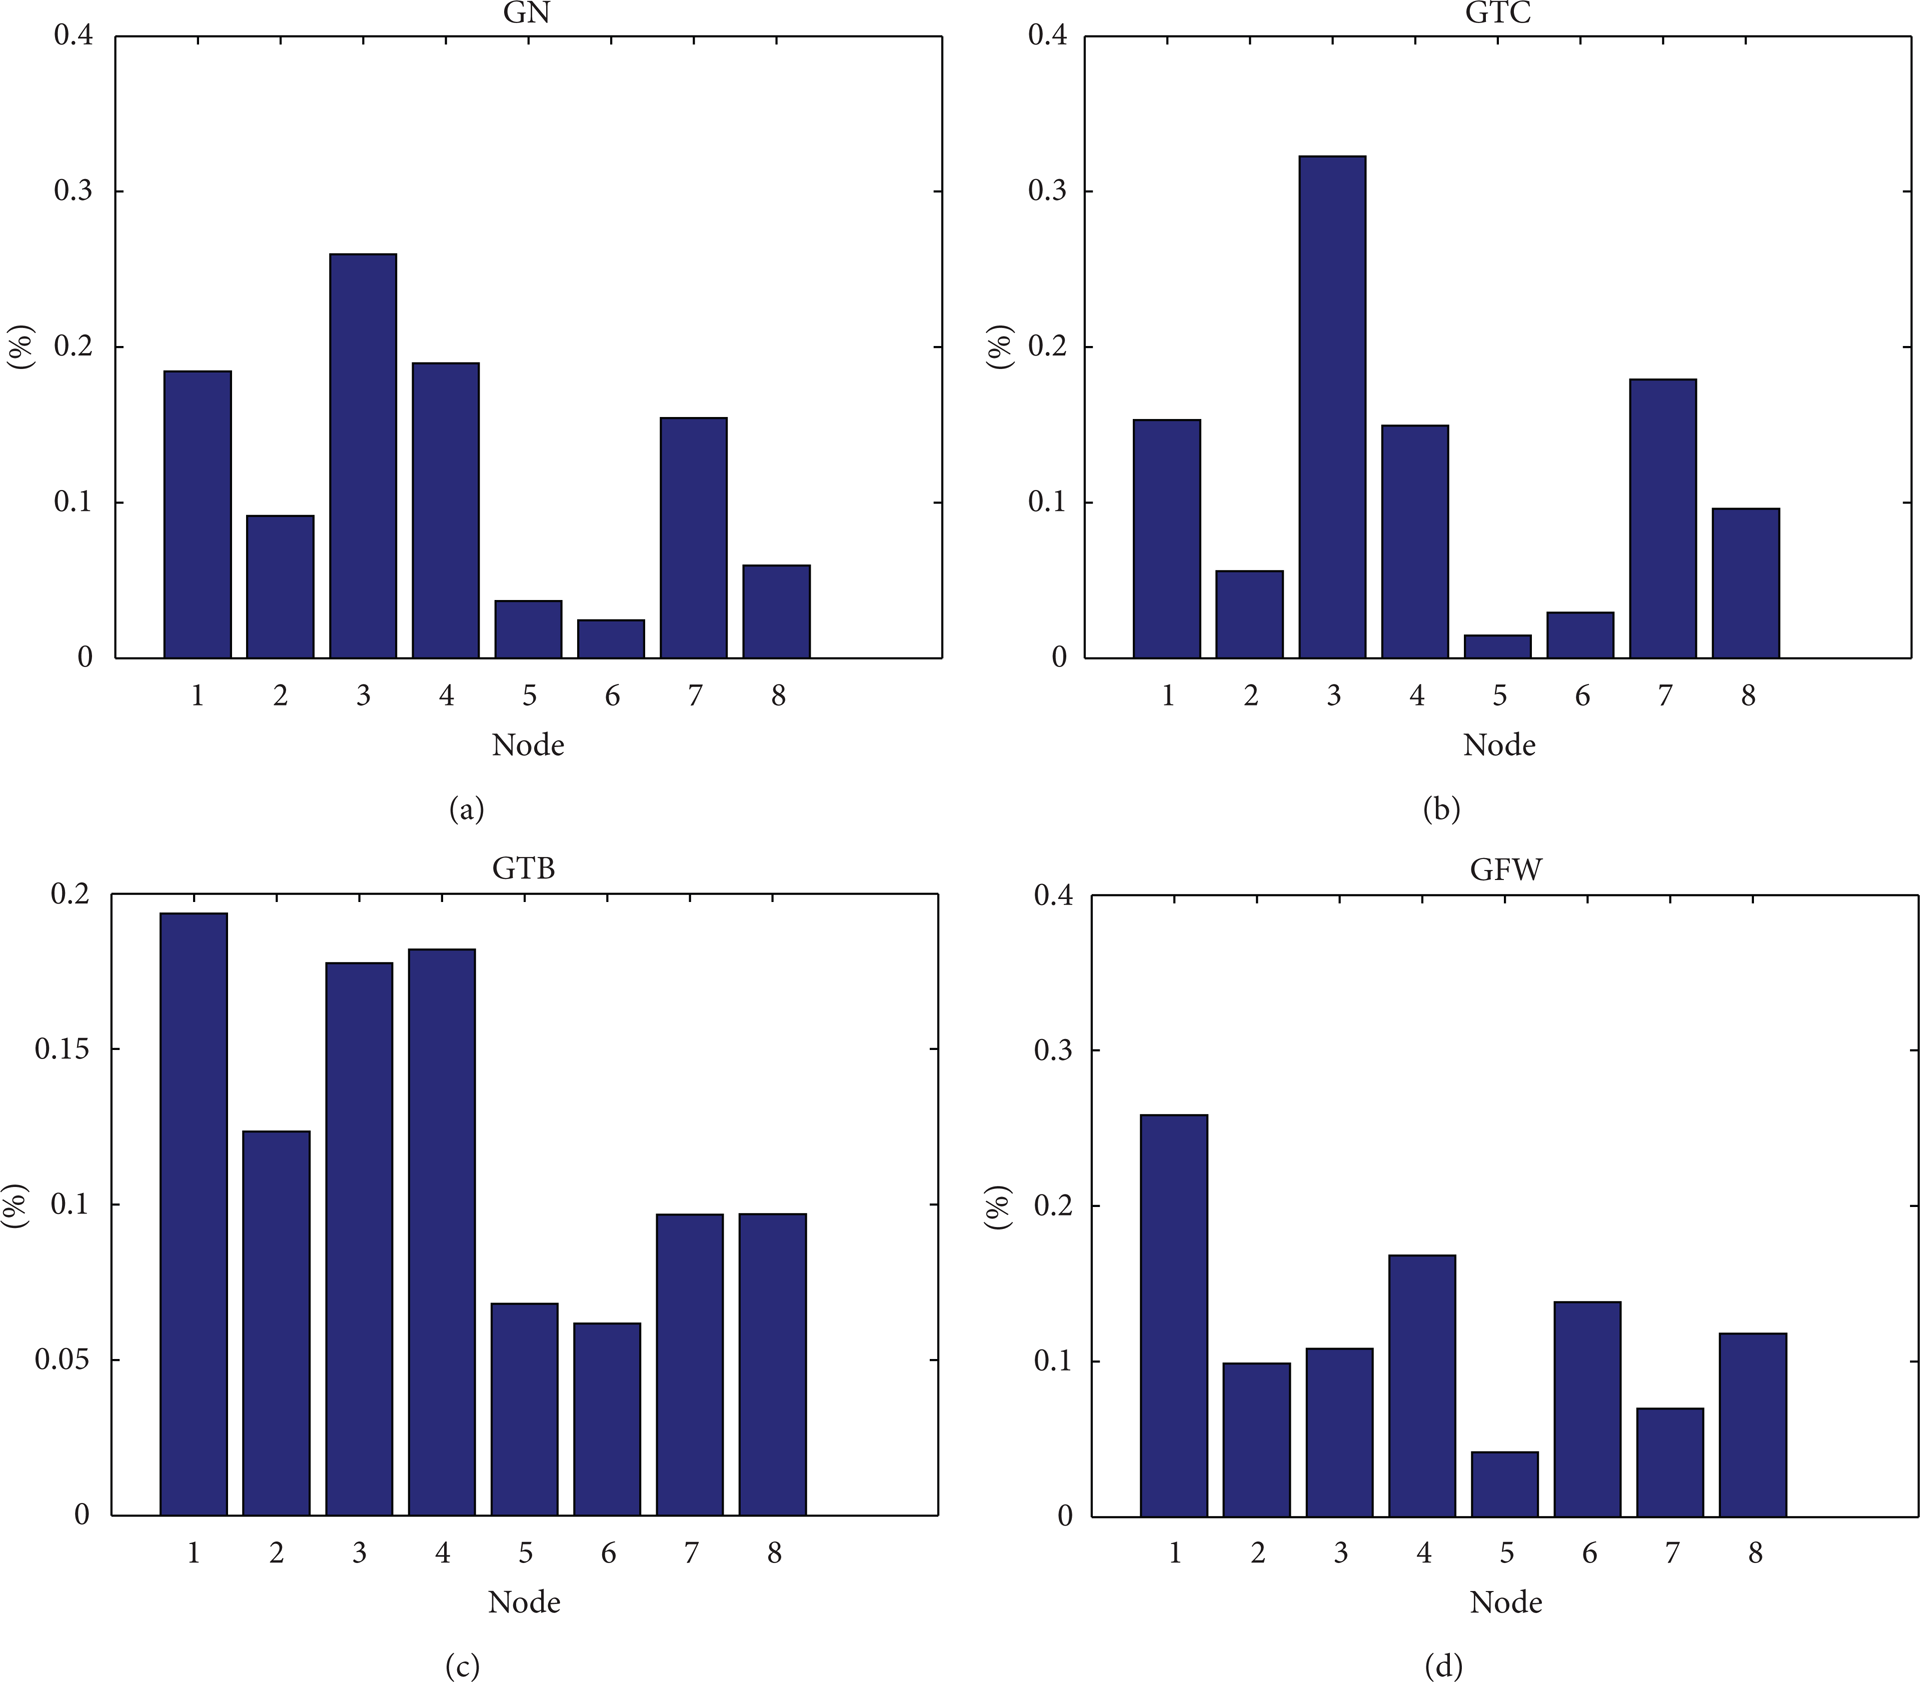
The energy percentage of each frequency band under different conditions.
Eighty samples of vibration signals under each condition are gathered. In each sample, 8 features are obtained after WPD, and then the feature vector is constructed to train and test the SVM model. Among the 80 samples, 60 samples are used to train the SVM, and the rest are used for testing purposes. Here, the integers from 1 to 4 are used to represent the four conditions (GN, GTC, GTB, and GFW), respectively.
The toolbox of LibSVM-mat-3.14 [21] is adopted to design the SVM. In order to select the most suitable kernel function for fault diagnosis, the four kernel functions of linear, polynomial, RBF, and sigmoid, all are taken to establish the SVM model, and their results are compared. The penalty factor C and kernel function parameters g are selected through the cross-validation and network search method, and the optimal result is C = 0.0039 and g = 0.0039, and the optimal accuracy is 100%. The result shows that the classification accuracy of SVM model is as high as 100% no matter which kernel function is selected.
Figure 3 is the output comparison of RBF neural network and SVM using the same features that are extracted by WPD. The train error of RBF neural network is 6.63E – 25, and it meets the requirement. In the figure, it can be found that the output value of sample 17 of RBF neural network is different from the actual situation. In addition, if the acceptable range of output value deviates from the ideal value taken into account, then the diagnostic accuracy of RBF neural network is less than the SVM. The reason is that the output of SVM is a global optimum theoretically, while the neural network could not avoid the problem of local extreme. Therefore, the effect of the method proposed is more effective.

The output comparison of RBF neural network (red points) and SVM (blue points).
4.2. Analysis of Idler Vibration Signals
The belt conveyor is shown in Figure 4, and a series of idlers mounted on it with a distance. Due to the poor working environment of belt conveyor in coal mine, dust and some other corrosive substances affect the operation of idlers. As a result, some failures usually occur on idlers which are dangerous for the safe operating of belt conveyors. In order to gather the idler vibration signals in different health conditions, related experiments are carried out on the belt conveyor in coal mine production site, and the detailed steps of the experiment are described as below.

Belt conveyor and sensor installation.
4.2.1. Installation of Sensors
Since the belt conveyor is usually long and the number of idlers is large, it is unrealistic and uneconomical to install a sensor on each idler in order to monitor the vibration signal. Therefore, the sensors are installed, every few idlers as Figure 4 shows. In the experiment, one acceleration sensor is installed, every three idlers. Firstly, clean the place on the beam that the sensor is installed on, polish the place with sandpaper to smooth, and then install the sensor on it with magnetic base and make sure the sensors are firmly installed on the beam. The idler that sensor is installed on is named idler 2, and the idlers near to it are named idler 1 and idler 3, respectively.
4.2.2. Gathering the Vibration Signal of Belt Conveyor in Different Transportation Volume
In the actual production process, the amount of coal on the belt is changing all the time, and it may affect the vibration signal that is collected by sensors. Under a certain transportation volume, the signal is firstly gathered under normal condition without any idler being installed, and then one of the three idlers is stopped from rotating with tools to simulate the idler faults and the corresponding vibration signals are gathered. The normal condition is denoted as the health condition 1, and the condition with the corresponding faulty idler is denoted as the health condition 2, 3 and 4, respectively. The transportation volume of the belt conveyor is changed, and vibration signals under different health conditions are gathered again. Three load cases are considered under each health condition, that is, light load, medium load and high load. Through a set of experiments, 32 samples under each health condition are obtained, where each load case is with 8 samples. Hence, there are totally 128 samples.
In Figure 5, the vibration signals and the WPD results under light load (low transportation volume) and heavy load (large transportation volume) are shown. It can be seen that, the variation of transportation volume does not significantly influence the WPD results. Hence, the WPD results are suitable for the fault diagnosis of idler faults under different transportation volumes.

The results of WPD under light and heavy loads.
The vibration signal is gathered by the signal acquisition system, and the accuracy of the vibration signal directly affects the accuracy of the diagnosis results. The acceleration sensors used to gather vibration signal are CTC AC133. The sensitivity of the sensor is 500 mv/g; the frequency response is 0.1 ~ 10000 Hz, the dynamic input range is ±10 g. The data acquisition card in the system is NI 9234 and along with it there is a wireless chassis NI cDAQ-9191. The NI 9234 is a four channels simultaneous sampling analog input module. The input voltage of NI 9234, is ±5 V. There is a 24-bit software selectable IEPE signal conditioning in the module, and the highest sampling rate of it is 51.2 k Sample/s per channel.
The 3-level decomposition on the vibration signals is also carried out under different health conditions. Figure 6 shows the eight frequency bands obtained with the WPD technique under faulty conditions with a medium load.

The vibration signals and WPD results under faulty conditions.
The energy of each frequency band is extracted, and the feature vector of the sample can be obtained to form the train and test sample of SVM, where 28 samples under each health condition are treated as the training samples, and the rest are used for testing purposes. Similarly, the penalty factor C and kernel function parameters g are chosen with the cross-validation and network search method. The optimal result is C = 5.28 and g = 82.45. The result of classification of SVM with RBF kernel function is shown in Figure 7. In the figure, the results of sample 16 and sample 18 do not match with the real situation, and therefore the accuracy rate is 91.67% (22/24). It is obvious that the classifier of SVM can identify the normal condition (Class 1) and faulty condition (Class 2, 3, and 4) correctly, which is important for the managers of belt conveyor to take the right operation. The computation time of the classification is around 0.5 second with a 2.1 GHz CPU and 4 G memory, which may result in a delay of the detection of faults. Since the speed of the conveyor is about 4 m/s, the delay is still acceptable for the purpose of online monitoring.

Classification result of SVM (RBF kernel function).
5. Design of the Online Monitoring and Fault Diagnosis System for Belt Conveyors
5.1. Functional Structure Design
The online monitoring and fault diagnosis system monitors the vibration signals of idlers and diagnoses the health condition of the belt conveyor. The diagnostic results are provided to management personnel so that they can make appropriate decision in the early stage of failures. The procedure of the fault diagnosis consists of three parts. Firstly, the vibration signal of the idler is collected by acceleration sensors, and the vibration data is transferred to computer in which the analysis and diagnosis work is carried out. Secondly, the software of fault diagnosis system extracts features from the original vibration signal data. Thirdly, the software recognizes the conditions of idlers through the extracted features, and the management personnel make appropriate decision according to the diagnosis results. The entire procedure is shown in Figure 8.
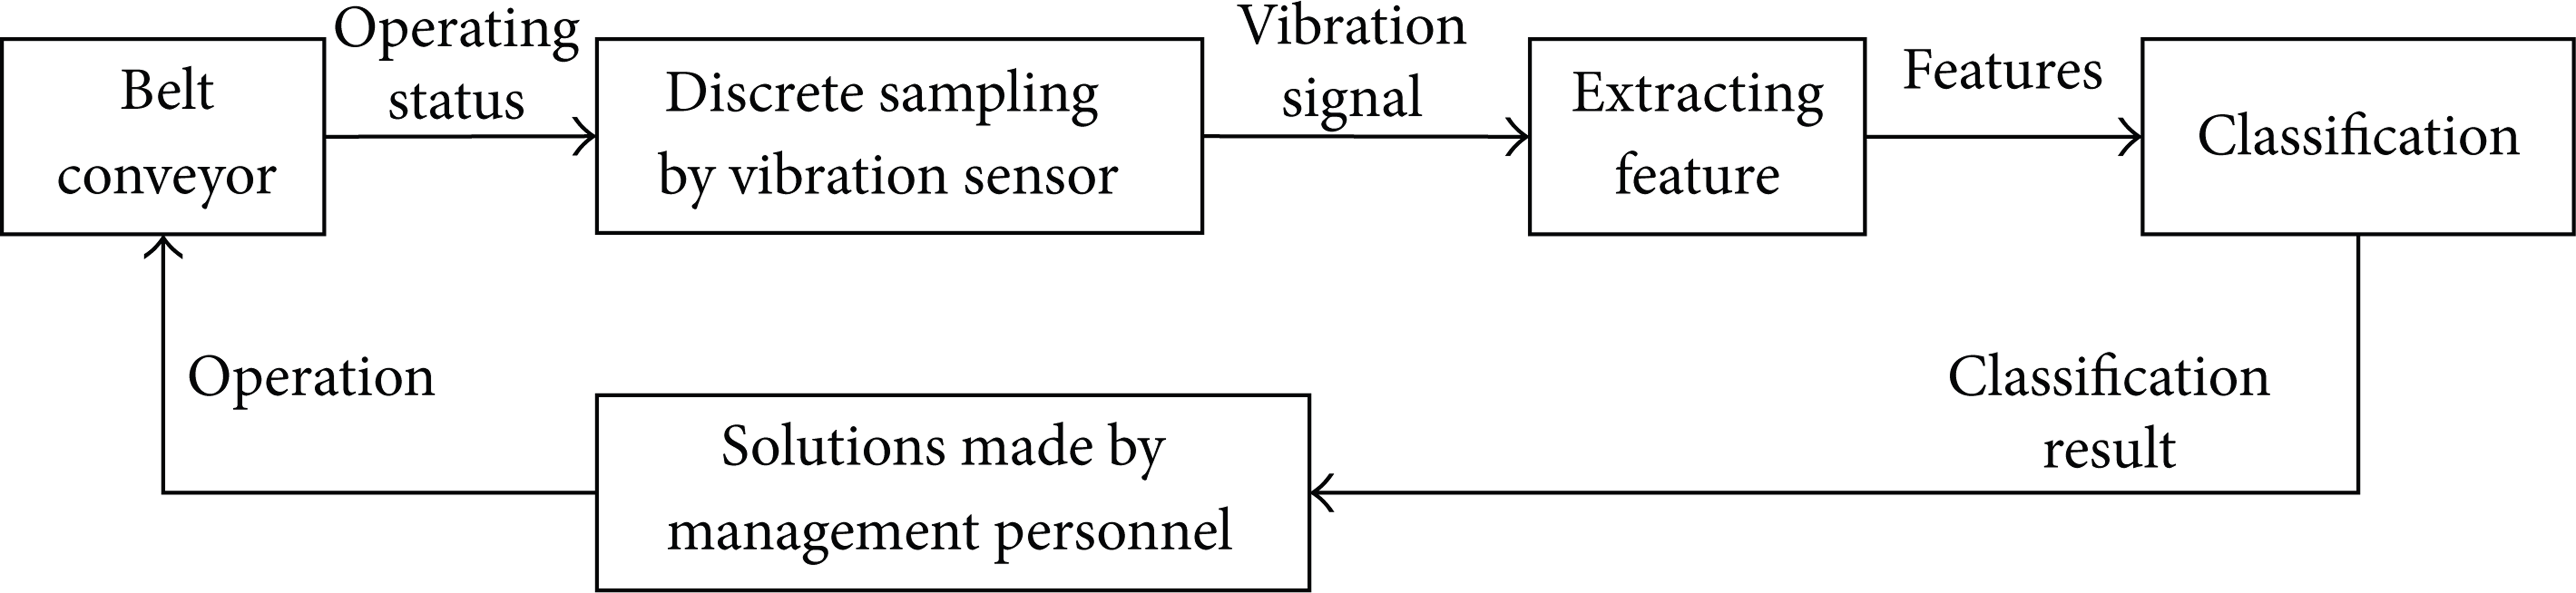
The procedure of online monitoring and fault diagnosis system for belt conveyor.
The system for belt conveyor consists of the hardware and the software. The hardware part includes acceleration sensors, data acquisition system, and industrial control computer. The sensors can be installed on the supporter as shown in Figure 4. One sensor can be used to diagnose several idlers. The number and position of the sensors can be determined according to the practical requirement. The data acquisition system and the industrial control computer can be placed in the control station of the conveyor. The software part is the vibration signal acquisition and analysis software. The functional structure of the software is shown in Figure 9.

Diagram of software functional structure.
5.2. Software Design
The workflow chart of the software is shown in Figure 10. Start the fault diagnosis software, then the system begins initializing and searching for online data acquisition devices. In the process of data acquisition, the fault diagnosis software analyses the data; the results are displayed on the interface and stored in the database. The management personnel of belt conveyor can be clear about the health condition according to the diagnosis results and take appropriate action. Figure 11 is the screenshot of the main interface of the software. The fault diagnosis method presented before is applied to design the system for belt conveyors. The results of field experiment show that the fault diagnosis system could diagnose faults of idler failure effectively.
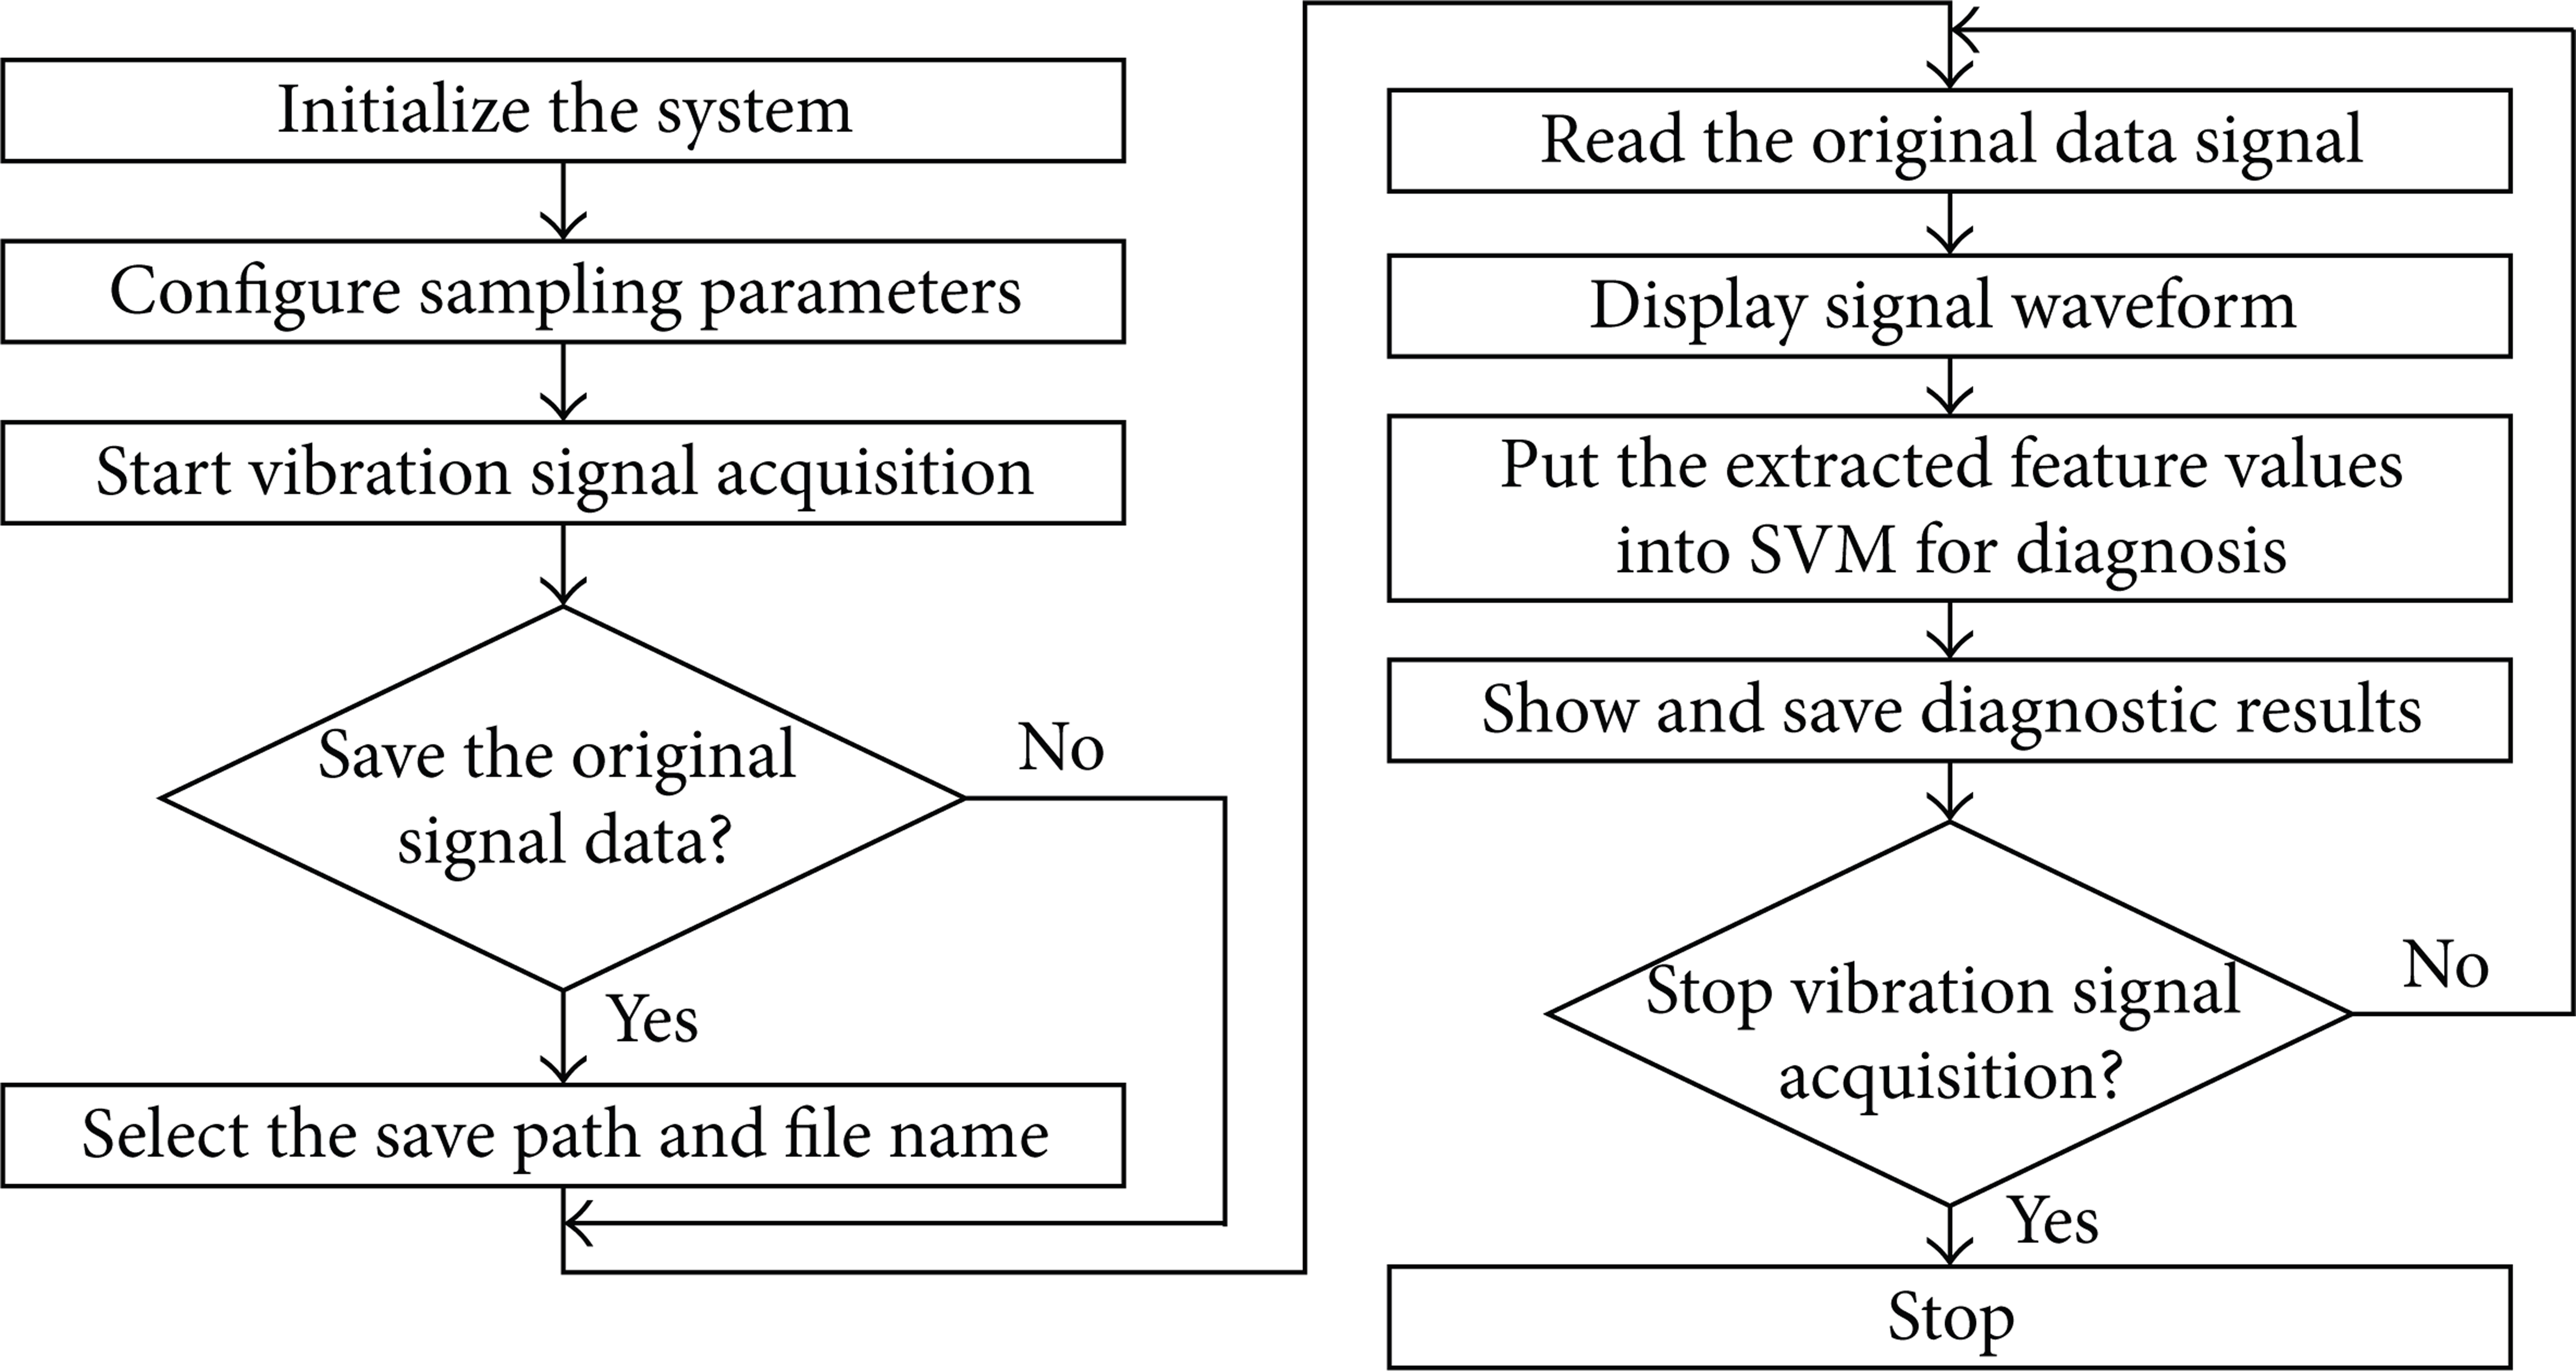
The workflow chart of the software.

The main interface of the software.
6. Conclusion
In this paper, the method of fault diagnosis for belt conveyor was presented by combining WPD and SVM techniques. One acceleration sensor was used to gather vibration signals of several idlers. The vibration signals were decomposed with WPD, and the energy of each frequency band was extracted as the features. Then, the features were employed to train an SVM to realize the detection of idler faults. Based on the method, the online monitoring and fault diagnosis system for belt conveyors was designed, which can automatically detect the faults. The results of the experiment on a belt conveyor in a coal mine demonstrate that the proposed system can locate the position of the faulty idlers with limited number of sensors. Such a monitoring and fault diagnosis system is of practical interests for the users of belt conveyors.
Conflict of Interests
All of the authors do not have any direct financial relation with the commercial identities mentioned in this paper.
Footnotes
Acknowledgments
The research was supported by The National Natural Science Foundation of China (51275513), the Fundamental Research Funds for the Central Universities (2012QNA31), and the Project Funded by the Priority Academic Program Development of Jiangsu Higher Education Institutions (PAPD).