
Abstract
Finite element methods, such as the ANSYS, are widely used as traditional structural dynamic analysis methods. Due to the low calculation efficiency of the ANSYS, there is a hindrance factor in using the finite element method to compute the elastic-plastic responses of special engineering structures. In this paper, we detail a pioneer study in which the transfer matrix method of multibody system (MS-TMM) was introduced to analyze the dynamic responses of civil engineering structures. Although the responses obtained by the MS-TMM are similar to the responses obtained by the ANSYS, the ANSYS requires a greater amount of computation time. The results indicate that the MS-TMM can satisfy the requirements of calculation efficiency and calculation accuracy.
1. Introduction
Negative Gaussian curvature board is the scientific name for a prestressed concrete saddle plate, which is commonly known as a saddle plate. The saddle plate is a prestressed element that is composed of a combination of beam and plate. The saddle plate is widely used in frame-bent industrial structures in southern China [1]. In frame-bent structures, a framework is used in the longitudinal direction, and the saddle plates are used on the roof [2]. Although seismic analyses of single-story industrial buildings with saddle plates are rare, they possess practical significance.
Finite element methods, such as the ANSYS, are widely used as traditional structural dynamic analysis methods. However, the calculation efficiency of the ANSYS is low, which has prevented its application in special engineering fields [3]. With social and technological advancements, the demand for calculation accuracy and calculation efficiency has increased, which remains a contradiction and creates a time-delay problem in active vibration control technology. Therefore, a vibration analysis method that works efficiently and accurately for engineers and researchers is needed.
The transfer matrix method of multibody system (MS-TMM) was developed by Rui et al. in 2008 [4]. The premise of MS-TMM is the decomposition of global dynamics into substructures and joints. The joint is involved in the progress of docking and transfer [5]. Compared with the classical transfer matrix method, this method offers advantages such as high programming, a low order for the system matrix, and high computational efficiency, and global dynamics equations of the system are not required [6]. Compared with the finite element method, the transfer matrix method of multibody system can reduce computing time and improve computational efficiency. As a result, the MS-TMM has been widely used in areas such as aerospace and the manufacture of weapons and vehicles in recent years [7]. However, the application of MS-TMM for solving structural dynamic responses remains in the initial stage.
In this paper, we introduced the MS-TMM for the analysis of the elastic-plastic responses of a new single-story frame-bent structure during rarely occurring earthquakes. A comparison of the results obtained by the MS-TMM and ANSYS is discussed.
2. Mechanical Model
In the new single-story frame-bent structure, precast prestressed saddle plates are used on the roof, a framework is used in the longitudinal direction, and saddle plates are connected to the longitudinal beams. Because the mass and stiffness distribution of the new single-story frame-bent structure are average in the longitudinal direction, a representative frame-bent model of the structure is selected to study its responses during rarely occurring earthquakes. Based on the saddle plates connected to the longitudinal frame beams in the structure, a model of the links is simplified to a model of the planar hinges because a rotational degree of freedom and a transverse displacement degree of freedom exist between the hinges. The saddle plates are considered to be the model of rigid bodies because minimal transverse deformation occurs under the action of transverse loads. The columns in the new single-story frame-bent structure are simplified to a model of elements, such as particles and massless beams (1,2, …, j), whose deformations are only considered in the transverse direction. And in structural engineering, the foundation is usually assumed as a rigid body. The mechanical model of a new single-story frame-bent structure during an earthquake can be simplified as shown in Figure 1, including particles (2,4, 6, …, j) and (2,4, 6, …, j′), massless beams (1,3, 5, …, j – 1), planar hinges (1′), and rigid bodies (2′). A rigid body contains three degrees of freedom, including translations in the x and y directions, as well as a rotation around the z-axis.
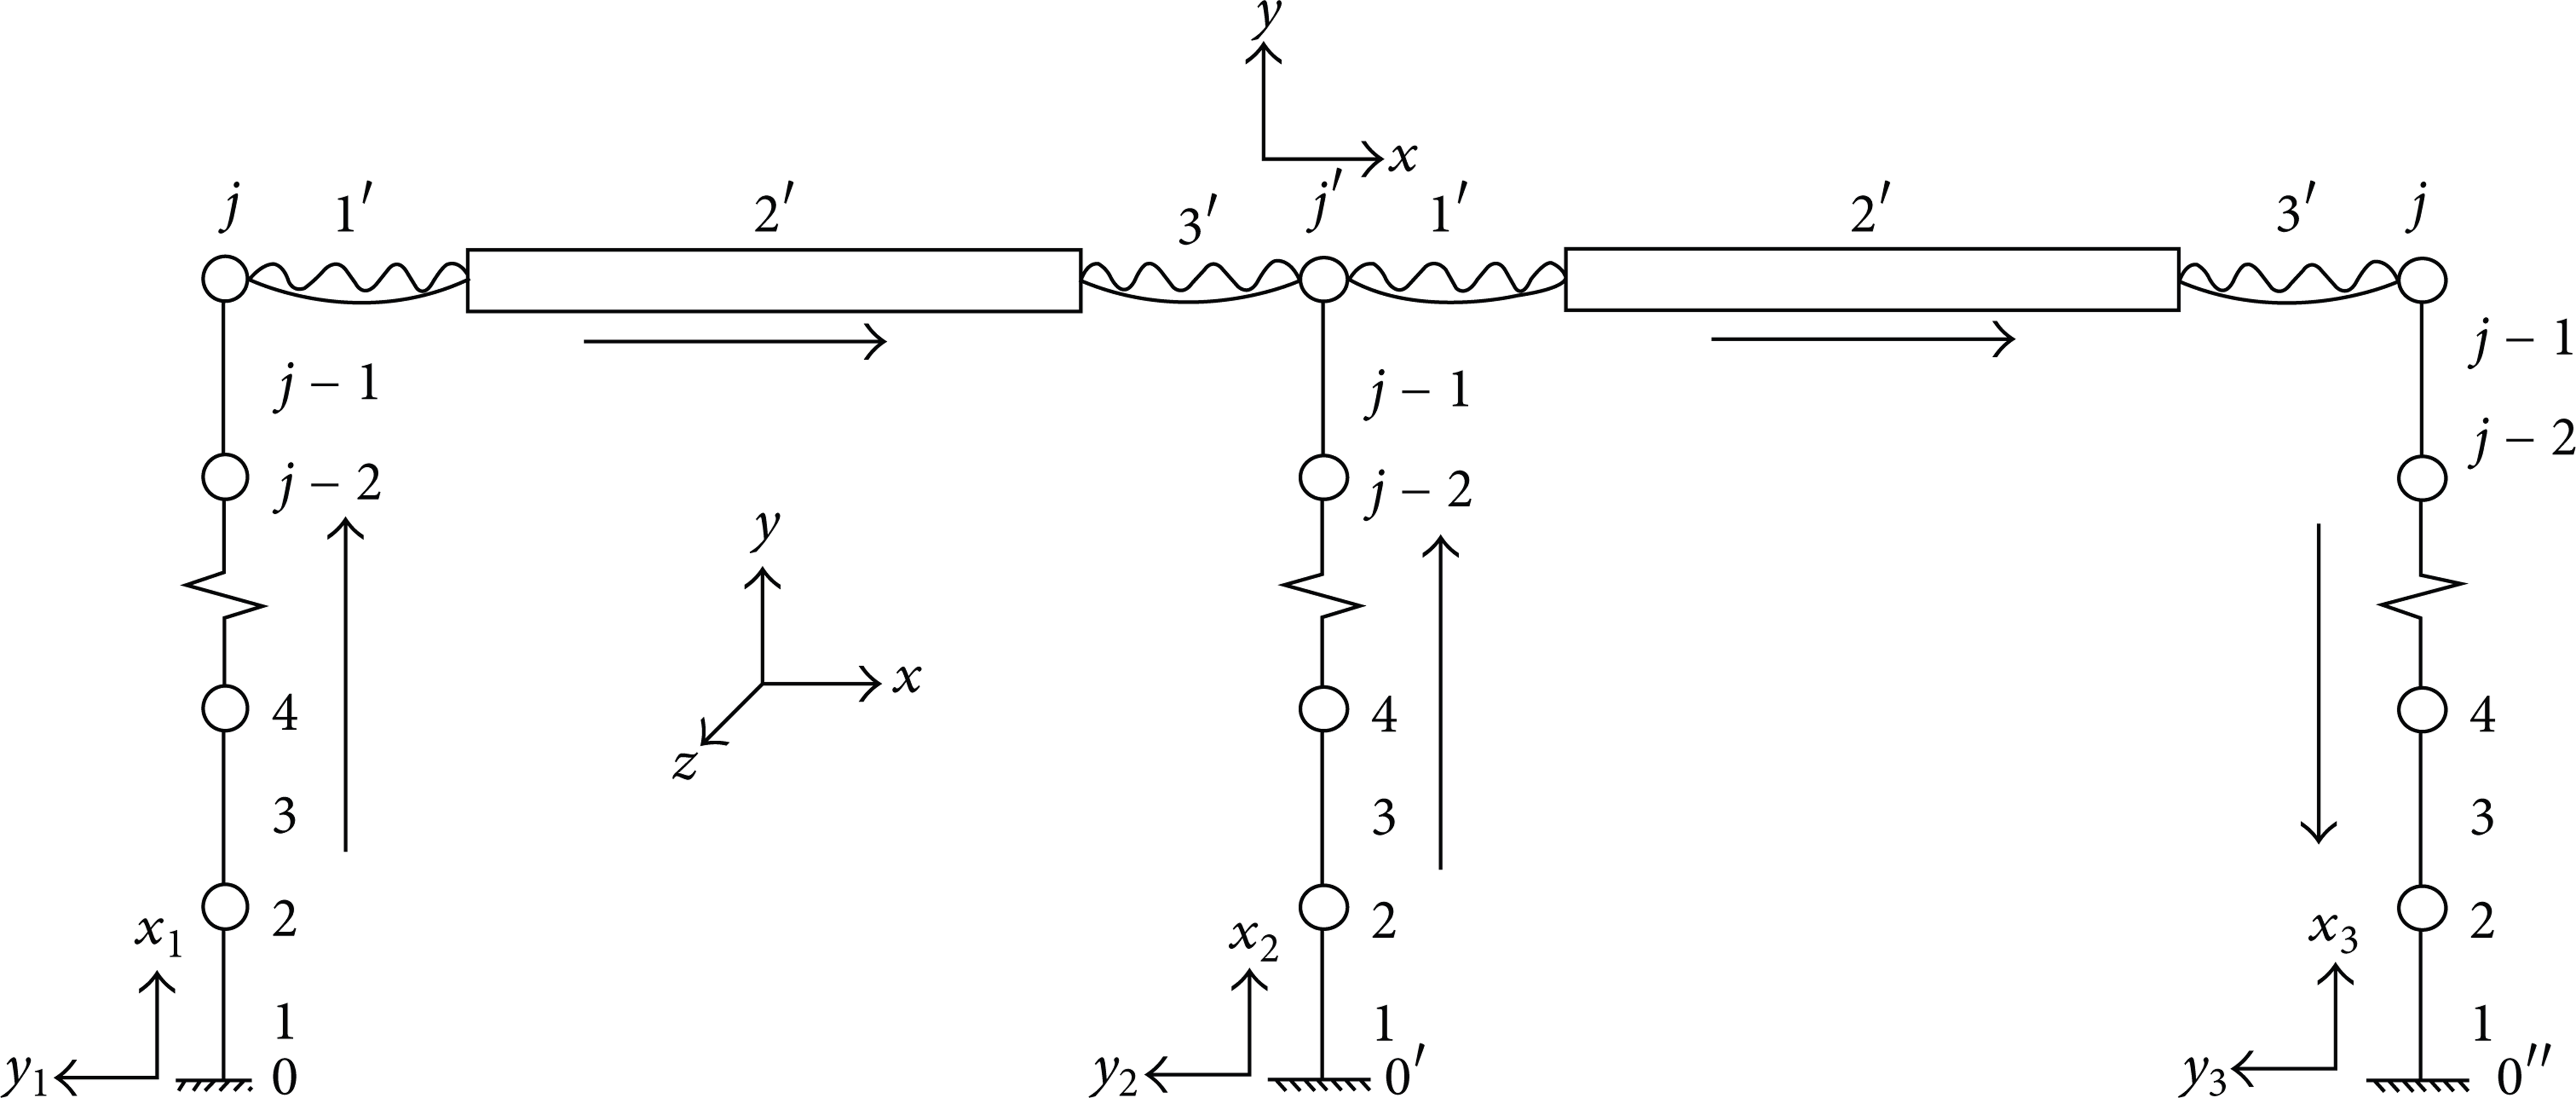
The mechanical model of a single-story frame-bent building structure.
3. The Transfer Matrix of a New Single-Story Frame-Bent Structure Based on the MS-TMM
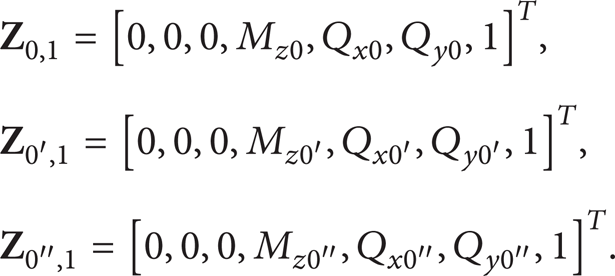
We define the state vector of the element in plane motion as

where x, y, θ z , m z , q x , and q y denote the displacements in the x and y directions, angular displacement around z, internal moment, internal force in the x direction, and internal force in the y direction, respectively.
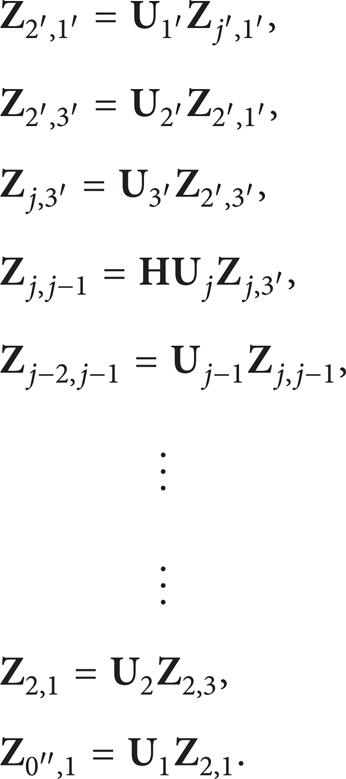
The transfer process is derived as follows.
The side column on the left is as

The middle column is as

The side column on the right is as
In the same coordinate, we obtain

where

The frame-bent structure is decomposed into numerous chain systems; thus, the transfer equation is expressed as

where

The element numbered as j′ is a particle with two inputs and one output. The state vectors of these two inputs consist of
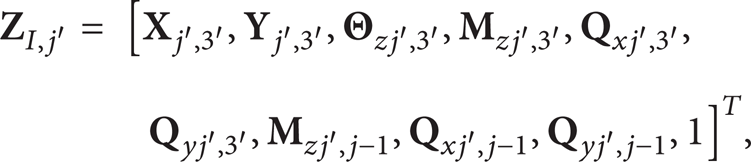

where

Therefore, the transfer equation of the element j′ is expressed as follows:


For j′, all displacements are equivalent; we obtain

where
By combining (7), (10), (12), and (16), we obtain the following equations:

By combining (15), and (17), we obtain

where

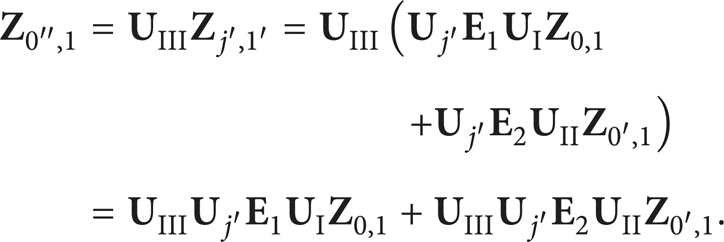
The boundary conditions are listed as follows:
The detailed steps for solving the elastic-plastic responses of a new single-story frame-bent structure during rarely occurring earthquakes by the MS-TMM are shown in Figure 2.

The process of solving the elastic-plastic responses of structures by the MS-TMM.
All transfer matrixes of the elements are illustrated in (21) through (26). The transfer matrix of a rigid body in plane motion is expressed as

where m r is the mass of the rigid body and cζ is the damping of the structure


When the earthquake acceleration is
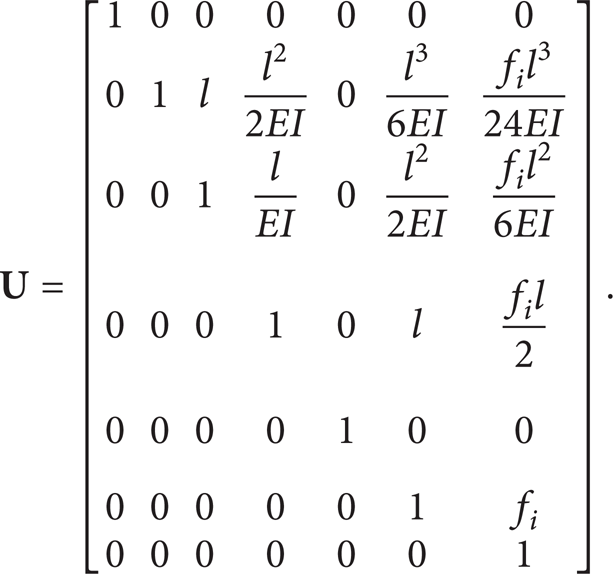
The transfer matrix of the particle is expressed as

where m is the mass of the particle and cζ is the damping of the structure.
When the earthquake acceleration is
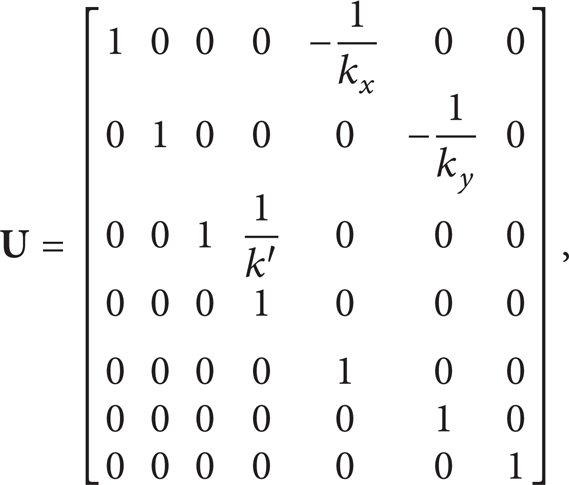
where k x , and k y are the spring stiffness in the x, y directions, respectively, and k′ is the stiffness of the rotational spring around z.
The process of solving the elastic-plastic responses of a new single-story frame-bent structure during rarely occurring earthquake is as follows (Figure 2).
4. The Elastic-Plastic Restoring Force Model of the Structure
Because the structure exhibits elastic plasticity during rarely occurring earthquakes, the stiffness varies with time; thus, it is important to establish relations between the restoring force and the displacement. Currently, the commonly used models are the double restoring force model and the three linear restoring force models. The double model is the simpler model. To reflect the properties of the concrete structure in the elastic-plastic region, the model of the trilinear restoring force is selected for this paper, as shown in Figure 3 [8].

The model of the trilinear restoring force.
In Figure 3, point 1 is the cracking point, F c and x c are the corresponding force and displacement, stage 01 is elastic, and k1 is the elastic stiffness; point 2 is the yielding point, F y and x y are the corresponding force and displacement, stage 12 represents cracking to yielding, and k2 is the cracking stiffness; after yielding, k3 is the yielding stiffness; the secant stiffness k4 is the unloading stiffness; in stage 12, when unloading to zero, the straight line extends to the cracking point for the first reverse loading; in stage 23, when unloading to zero, the straight line extends to the yielding point for the first reverse loading; for subsequent reverse loadings, the straight line extends to the point of maximum deformation prior to the first cycle.
In the model of the stiffness degradation for the three linear restoring forces, the variation in stiffness is represented by the intersecting point of the two straight lines; this type of intersecting point is named as the inflection point, for example, points 1, 2, 3, and 4 in Figure 3. Some errors exist in the inflection point; if we do not continue the processing to the inflection point, additional errors will cause distortion of the computational results due to the distortion of the restoring force model. Therefore, we employ a shortened integral step pΔt(0 < p < 1) at the inflection point to ensure that the restoring force curve is located precisely in the allowable error range at the end of the shortened integral step and that it continues to the integral in the new interval (t + pΔt, t + Δt). Generally, we employ the method of approximate interpolation to determine p. A different inflection point p corresponds to a different corresponding method. Inflection points are generally divided into three categories. The first category comprises the transition points, in which steep lines transition to slow lines, such as points 1, 2, and 5 in Figure 3. The second category comprises transition points, in which slow lines transition to steep lines, such as points 3, 6, 8, and 9 in Figure 3. The third category comprises points for which the restoring forces change sign, such as points 4, 7, and 10 in Figure 3.
(1) Determine the value of the first category p.
For the two points shown in Figure 4, the Taylor series is used to expand at time t. Equation (27) can be obtained as follows:

According to formula (27), p can be determined as follows:

After p has been determined, we can calculate the speed and acceleration of point 2 as

(2) Determine the value of the second category p.

Processing of the three categories of inflection points.
Researchers have concluded that the second category p, such as point 5, does not require processing. Because the skeleton curve is relatively rough, the pursuit of this subtle precision is insignificant.
(3) Determine the value of the third category p.
For point 5 in Figure 4 as follows:

5. An Engineering Example
A new single-story bent-frame structure with two spans and equal heights is selected as an engineering example. Because the lateral stiffness and mass of each bent-frame structure in the longitudinal direction are nearly equivalent, the transverse seismic action is approximately equal. Thus, the original spatial structure can be simplified to a model of planar structure under the lateral action of an earthquake. Consider a typical bent-frame structure as an example; the calculating diagram is shown in Figure 1 (j = 6). The type of saddle plate is YMB – 15 – 3.0; the transversal span is 15 m; the grade of loads is I; the snow load is 0.35 KN/m2; the strength grade of concrete in the columns is C30; the longitudinal span is 9 m; the section size of the RC columns is 600 mm × 800 mm; the thickness of the wall is 240 mm; the transversal spring stiffness k x and the stiffness of the rotational spring k′ between a saddle plate and a longitudinal beam are 1.68 × 10⁸ N/m, 1.59 × 10⁶ N · m, respectively; the elastic modulus E is 3 × 10¹⁰ N/m2; the elastic stiffness of a column in longitudinal frame k1 is 7.68 × 10⁸ N/m; the cracking stiffness k2, the yielding stiffness k3, and the secant stiffness k4 are 3.16 × 10⁸ N/m, 2.3 × 10⁸ N/m, and 3.46 × 10⁸ N/m, respectively; the cracking displacement x c is 6.3 mm; the yielding displacement x y is 21.8 mm; the mass of saddle plate m2′ is 25.14 × 10³ kg; the masses of particles are m2 = m4 = m6 = 5.93 × 10³ kg. The seismic fortification intensity is 7, the site type is II, and the classification of design earthquake is the 1st classification.
To study the responses of a new single-story bent-frame structure during rarely occurring earthquakes, two natural earthquake waves (the El Centro earthquake wave and the Taft earthquake wave) and one artificial earthquake wave (the Nanjing earthquake wave) are chosen. The duration time is 10 s. According to the seismic codes of the PROC, we adjust the peak value of the earthquake waves to 220 cm/s2 for the rarely occurring earthquake.
5.1. Analysis of the Elastic-Plastic Displacement of a New Single-Story Bent-Frame Structure during Rarely Occurring Earthquakes Is Based on the MS-TMM
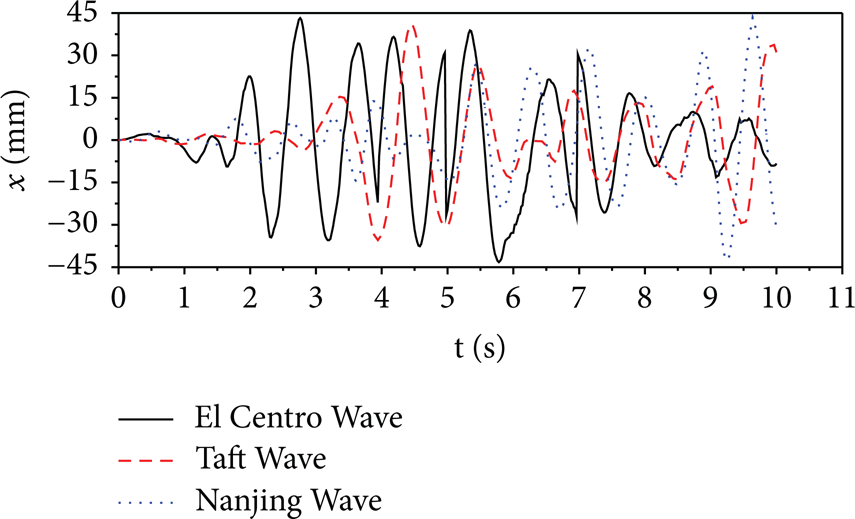
The responses of a new single-story bent-frame structure during rarely occurring earthquakes are computed using the MS-TMM (as shown in Figure 5) and the finite element software ANSYS (as shown in Figure 6). When the responses of a new single-story bent-frame structure during rarely occurring earthquakes are computed by using the finite element software ANSYS, the BEAM198 and SHELL63 are chosen as the models of a beam or column and a saddle plate, respectively. Because the foundation is assumed to be a rigid body, the link model at the bottom of a column corresponds to the fixed constraint.

The displacement time history curves for the top of the structure during rarely occurring earthquakes (based on the MS-TMM).
The displacement time history curves for the top of the structure during rarely occurring earthquakes (based on the ANSYS).
As illustrated in Figures 5 and 6, based on the MS-TMM, the maximum elastic-plastic displacement on the top of the new single-story bent-frame structure under the activity of El Centro Wave, Taft Wave, and Nanjing Wave is 47.93 mm at t = 2.78 s, 44.41 mm at t = 4.48 s, and 46.65 mm at t = 8.00 s, respectively. And based on ANSYS, those are 43.13 mm at t = 2.76 s, 46.12 mm at t = 4.46 s, and 42.3 mm at t = 7.96 s, respectively. Based on the MS-TMM, the maximum elastic-plastic story drift angles under the activity of three earthquake waves are 1/188, 1/203, and 1/193, respectively. And based on ANSYS, those are 1/195, 1/213, and 1/205, respectively. The average maximum elastic-plastic displacement on the top of the structure got by both methods are 46.33 mm and 43.58 mm under the activity of three earthquake waves, respectively; the average maximum elastic-plastic story drift angles got by both methods are 1/194 and 1/205 under the activity of three earthquake waves, respectively. Because determinate regulations regarding elastic-plastic story drift displacement angle of the frame-bent structure are nonexistent, we refer to the concrete frame structure, in which the limit of an elastic-plastic story drift angle is 1/50. Thus, the frame-bent structure satisfies the requirement of the seismic codes of the PROC.
Evidently, the elastic-plastic displacement trajectories on the top of a new single-story bent-frame structure obtained by the MS-TMM and the ANSYS under the actions of the three earthquake waves are very close, as shown in Figures 5 and 6.
The maximum displacement on the top of a new single-story bent-frame structure obtained by MS-TMM and ANSYS under the actions of the three earthquake waves is shown in Table 1; their errors are also listed.
The maximum elastic-plastic displacement for the top of a new single-story bent-frame structure during rarely occurring earthquakes.

As listed in Table 1, the error for the average maximum elastic-plastic displacement on the top of a new single-story bent-frame structure under the actions of three earthquake waves using the MS-TMM and ANSYS is 5.66%, which is similar to the results of engineering computations. The MS-TMM required only 100 s of post-processing time, but the ANSYS required more than 1800 s of postprocessing time to solve the maximum elastic-plastic displacement on the top of the structure. Because the transition matrixes and the transmission equations do not require a second derivation, they are selected directly from the library of transition matrixes; the transfer matrix method of multibody system is convenient. Computations of the elastic-plastic displacement during rarely occurring earthquakes with the MS-TMM exhibit more advantages than the computations by the ANSYS.
5.2. Analysis of the Base Shear Force of a New Single-Story Bent-Frame Structure during Rarely Occurring Earthquakes Based on the MS-TMM
In the design of seismic structures, note that the beams are damaged prior to the columns, which is named the concept of strong columns and weak beams, because the destruction of beams belongs to broken members and the destruction of columns endangers the entire structure. Therefore, we analyze the maximum shear force at the bottom of the column as a control target.
As illustrated in Figures 7 and 8, based on the MS-TMM, the maximum shear forces at the bottom of the side column under the activity of El Centro Wave, Taft Wave, and Nanjing Wave are 119.82 kN at t = 4.44 s, 97.78 kN at t = 4.48 s, and 111.14 kN at t = 7.98 s, respectively. And based on ANSYS, those are 104.42 kN at t = 4.46 s, 93.83 kN at t = 4.40 s, and 101.85 kN at t = 7.92 s, respectively. The average maximum shear forces at the bottom of the side column under the actions of the three earthquake waves got by the MS-TMM and ANSYS are 109.58 kN and 100.1 KN, respectively.
The shear force time history curves for the bottom of the side column during rarely occurring earthquakes (based on the MS-TMM).

The shear force time history curves for the bottom of the side column during rarely occurring earthquakes (based on ANSYS).
Evidently, shear force trajectories at the bottom of the side column of a new single-story bent-frame structure obtained by the MS-TMM and the ANSYS under the actions of the three earthquake waves are very close, as shown in Figures 7 and 8.
The maximum shear forces at the bottom of the side column obtained by the MS-TMM and ANSYS under the actions of the three earthquake waves are shown in Table 2; their errors are also listed.
The maximum shear forces at the bottom of the side column in a new single-story bent-frame structure during rarely occurring earthquakes.

As shown in Table 2, the error between the average maximum shear force at the bottom of the side column obtained by MS-TMM and the average maximum shear force at the bottom of the side column obtained by ANSYS is 9.5%, which is similar to the results of engineering computations.
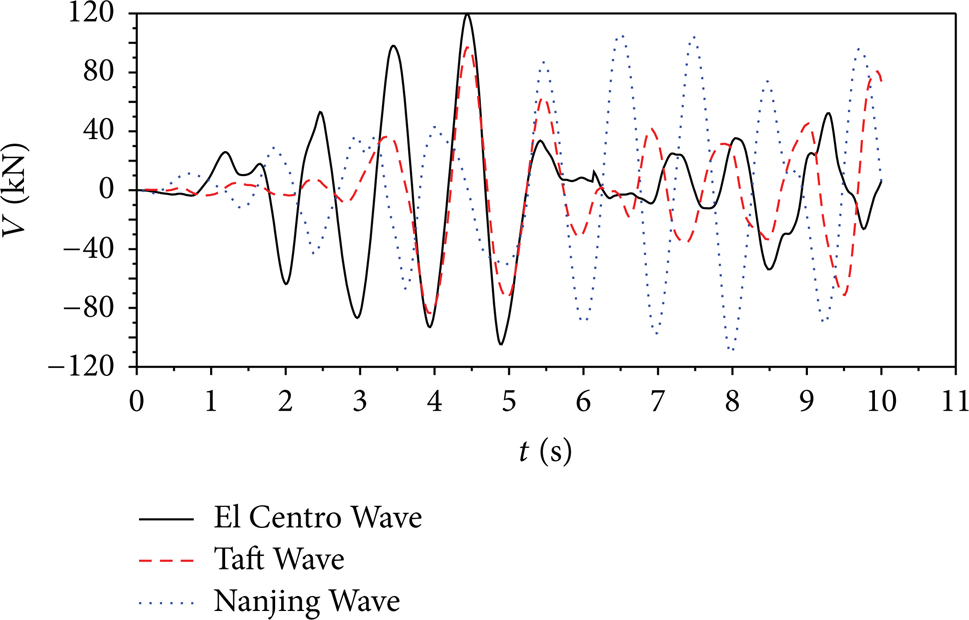
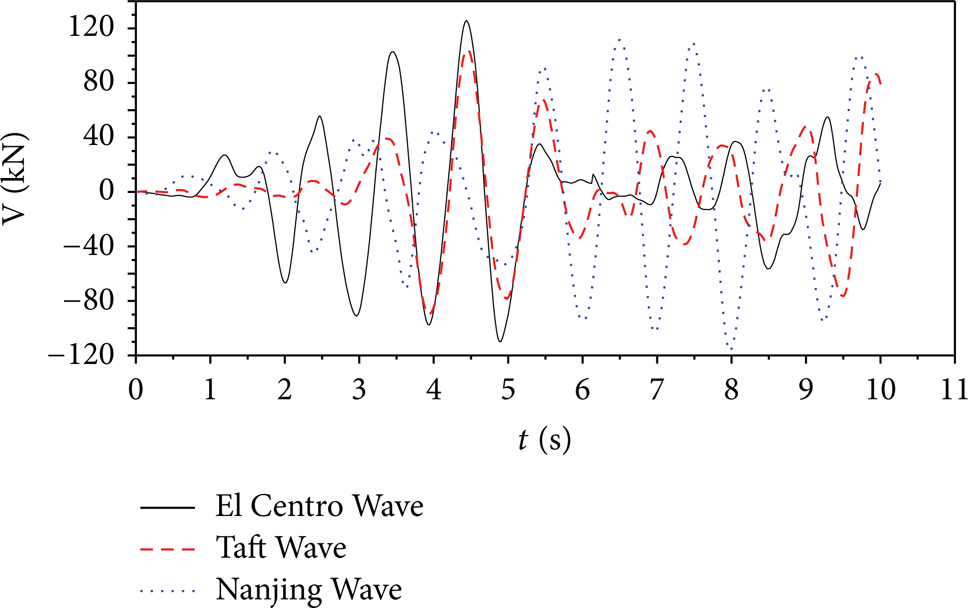
As illustrated in Figures 9 and 10, based on the MS-TMM, the maximum shear forces at the bottom of the middle column under the activity of El Centro Wave, Taft Wave, and Nanjing Wave are 125.81 kN at t = 4.46 s, 104.67 kN at t = 4.50 s, and 116.70 kN at t = 7.94 s, respectively. And based on ANSYS, those are 112.8 kN at t = 4.42 s, 101.3 kN at t = 4.48 s, and 110.3 kN at t = 7.94 s, respectively. The average maximum shear forces at the bottom of the side column under the actions of the three earthquake waves got by the MS-TMM and ANSYS are 115.73 kN and 108.1 KN, respectively.
The shear force time history curves for the bottom of the middle column during rarely occurring earthquakes (based on the MS-TMM).

The shear force time history curves for the bottom of the middle column during rarely occurring earthquakes (Based on ANSYS).
Evidently, shear force trajectories at the bottom of the middle column of a new single-story bent-frame structure obtained by the MS-TMM and the ANSYS under the actions of the three earthquake waves are very close, as shown in Figures 9 and 10.
The maximum shear forces at the bottom of the middle column obtained by MS-TMM and ANSYS under the actions of the three earthquake waves are shown in Table 3; their errors are also listed.
The maximum shear forces at the bottom of the middle column in a new single-story bent-frame structure during rarely occurring earthquakes.
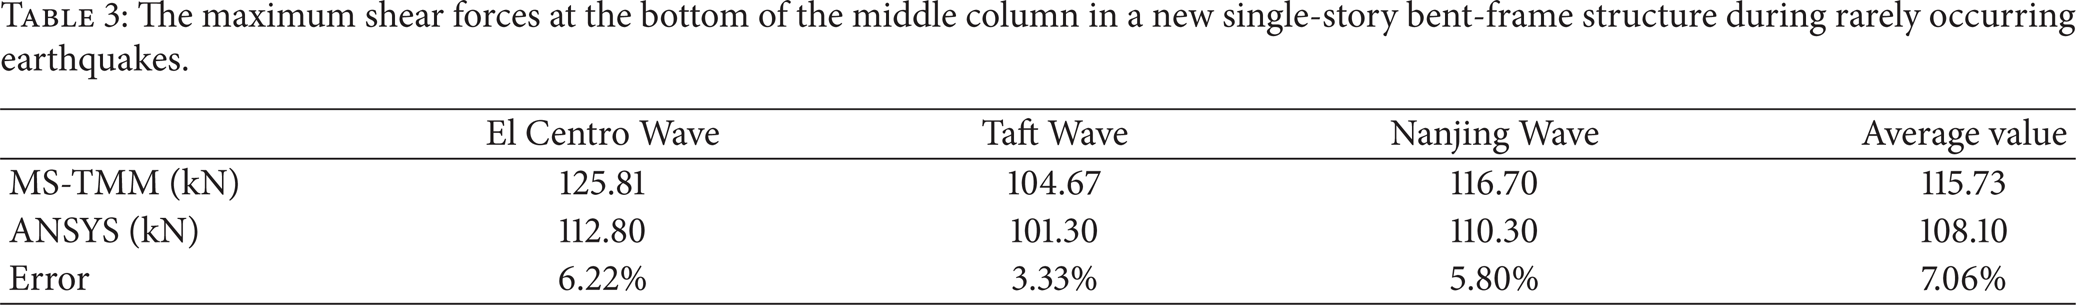
As shown in Table 3, the error between the average maximum shear force at the bottom of the middle column obtained by the MS-TMM and the average maximum shear force at the bottom of the middle column obtained by ANSYS is 7.06%. The results are nearly equivalent.
Because the speed of calculations by the MS-TMM for computing the base shear forces of a new single-story bent-frame structure during rarely occurring earthquakes is 10 times faster than the speed of calculations by the ANSYS; the MS-TMM has been proved to be extremely efficient in analyzing the seismic responses of structures, especially for active vibration controls of structures. The MS-TMM provides a feasible direction in the solution of the time lag.
6. Conclusions
In this paper, we conducted a pioneer study that included the analysis of the elastic-plastic responses of structures using the transfer matrix method of multibody systems (MS-TMM). We studied the seismic performance of a single-story frame-bent building structure during rarely occurring earthquakes and compared the calculation speed based on the MS-TMM with the calculation speed based on the finite element method ANSYS. We obtained the following conclusions.
The transfer matrix method of multibody system (MS-TMM) can be introduced to the dynamic analysis of civil engineering structures. The method has been proved to be substantially more efficient than other methods, such as the finite element method ANSYS.
The error between the average maximum elastic-plastic displacement on the top of a new single-story bent-frame structure under the actions of three earthquake waves obtained by MS-TMM and ANSYS is 5.66%; this value is similar to the results of engineering computations. The MS-TMM required only 100 s to solve the maximum elastic-plastic displacement on the top of the structure, whereas ANSYS required more than 1800 s.
The error between the average maximum shear force at the bottom of the middle column obtained by the MS-TMM and the average maximum shear force at the bottom of the middle column obtained by the ANSYS is 7.06%; the variation in error for the average maximum shear force on the side column is 9.5%. The results are nearly equivalent. Because the calculation speed of the MS-TMM is 10 times faster than the calculation speed of the ANSYS; the MS-TMM has been proved to be highly efficient for analyzing the dynamic responses of structures.